 Open Access Article
Recycling the CoMo/Al2O3 catalyst for effectively hydro-upgrading shale oil with high sulfur content and viscosity
Suleiman Sabo Belloabc,
Chao Wangad,
Mengjuan Zhangad,
Zhennan Hana,
Lei Shi a,
Kangjun Wanga,
Ziyi Zhong
 ef,
Fabing Su
 *abc and
Guangwen Xu*abc
aKey Laboratory of Chemical and Material Resources, Institute of Industrial Chemistry and Energy Technology, Shenyang University of Chemical Technology, Shenyang 110142, China. E-mail: fbsu@ipe.ac.cn; gwxu@syuct.edu.cn; Fax: +86-10-82544851; Tel: +86-10-82544850
bState Key Laboratory of Multiphase Complex Systems, Institute of Process Engineering, Chinese Academy of Sciences, Beijing 100190, China
cSchool of Chemical Engineering, University of Chinese Academy of Sciences, Beijing 100049, People's Republic of China
dGraduate School of Science and Technology, Hirosaki University, 3 Bunkyo-cho, Hirosaki, Aomori 036-8560, Japan
eGuangdong Technion Israel Institute of Technology (GTIIT), 241 Da Xue Road, Shantou, 515063, China
fTechnion Israel Institute of Technology (IIT), Haifa, 32 000, Israel
First published on 8th October 2020
Abstract
Hydrotreatment is an effective upgrading technology for removing contaminants and saturating double bonds. Still, few studies have reported the hydro-upgrading of shale oil, with unusually high sulfur (13200 ppm) content, using the CoMo/Al2O3 catalyst. Here we report an extensive study on the upgrading of shale oil by hydrotreatment in a stirred batch autoclave reactor (500 ml) for sulfur removal and viscosity reduction. From a preliminary optimization of the reaction factors, the best-operating conditions were 400 °C, an initial H2-pressure of 5 MPa, and an agitation rate of 800 rpm, a catalyst-to-oil ratio of 0.1, and a reaction time of 1 h. We could achieve a sulfur removal efficiency of 87.1% and 88.2% viscosity reduction under the optimal conditions. After that, the spent CoMo/Al2O3 was repeatedly used for subsequent upgrading tests without any form of pre-treatment. The results showed an increase in the sulfur removal efficiency with an increase in the number of catalyst runs. Ultimately, 99.5–99.9% sulfur removal from the shale oil was achieved by recycling the spent material. Both the fresh and the spent CoMo/Al2O3 were characterized and analyzed to ascertain their transformation levels by XRD, TEM, TG, XPS, TPD and N2 adsorption analysis. The increasing HDS efficiency is attributed to the continuing rise in the sulfidation degree of the catalyst in the sulfur-rich shale oil. The light fraction component in the liquid products (IBP–180 °C) was 30–37 vol% higher than in the fresh shale oil. The product oil can meet the sulfur content requirement of the national standard marine fuel (GB17411-2015/XG1-2018) of China.
1 Introduction
The ample reserve of unconventional oil deposits such as oil shale and bitumen is estimated to be around 9–13 trillion barrels.1 They are seen as potential candidates to supplement the light crude oil that has been enormously depleted. However, the demand and utilization have been limited by the former's poor characteristics, such as the high concentration of heteroatoms (S, N, & O), asphaltenes, metals (Ni, V, & Fe), and high viscosity.2 In particular, shale oil has a considerable amount of sulfur content that precludes its direct application as a transportation fuel,3,4 because the new environmental regulations limit the amount of sulfur in gasoline and diesel to 10 ppm and 15 ppm, respectively.5 Thus, it is necessary to upgrade such types of oil to lower their sulfur concentration to meet the industrial fuel or refinery feedstock specifications. Among the several ways to remove sulfur from oil, hydrodesulfurization (HDS) is the most commonly used technology for industrial applications.6However, the severity of the reaction conditions, such as high reaction temperature, hydrogen pressure and the entire processing cost, limit the application of the HDS technology.7 Designing catalysts that are capable of attaining high HDS activity under mild reaction conditions is deemed key to improving the inadequacies of the existing HDS processes, especially when applying to shale oil upgrading. The conventional HDS catalysts include CoMo/Al2O3, NiMo/Al2O3, and NiW/Al2O3, and among them, CoMo/Al2O3 is most selective to HDS.8,9 The HDS reaction occurs mainly through two different routes: the direct cleaving of the C–S bond, which is known as the direct desulfurization (DDS), and the hydrogenation (HYD) pathway.10 However, some sulfur compounds present in shale oil are refractory by characteristics, making them difficult to be removed. Two typical such kinds of compounds are 4-methyl dibenzothiophenes (4-MDBTs) and 4,6-dimethyl-dibenzothiophenes (4,6-MDBTs), which are difficult to be converted to sulfur-free compounds because of the steric hindrance imposed by the substituting alkyl groups at 4,6 positions.11,12
Intensive efforts have been made to modify CoMo/Al2O3 to increase its deep hydrodesulfurization activity, including optimizing the balance in Co/Mo ratio as investigated by Al-Zeghayer et al.,8 fine-tuning the properties of the alumina support as reported by Zhang et al.,13 and the addition of promoters like F, B and P.14,15 Alumina has always been the first choice as the support material for HDS catalysts, due to its stability, acidity, and high surface area. The composites of alumina and silica or zeolite have also been tested as support material for hydrodesulfurization catalysts.16 Yumoto et al. blended CoMo/Al2O3 catalyst with less than 10% zeolite to adjust the catalyst's acidity and increased the HDS activity by 40% compared with the conventional CoMo/Al2O3 catalyst when upgrading straight-run gas oil with 1.3 wt% sulfur content.17 Also, Ding et al. observed an increase in the activity of hydrotreatment catalysts by doping alumina support with zeolite beta.11 Improving the lifetime of the HDS catalysts is another significant challenge due to rapid deactivation, especially when upgrading shale oil.18 The quick deactivation is caused by coke and metals deposition on the catalyst surface.19,20 Compounds with large molecular size are also abundant in shale oil,21 and tend to deposit at the pore mouth of catalysts and stand between reactants and active sites. It is reported that the use of slurry reactors with a nano-sized catalyst helps reduce deactivation by coke and metals deposition in heavy crude oil upgrading.1,22 The main reasons are that the small-size catalysts offer a high surface area to volume ratio, more accessibility to active sites, low mass-transfer resistance, and reduced plugging chance.
In this work, we report a simple procedure for shale oil upgrading at a small to medium scale by hydrodesulfurization in a batch-wise slurry reactor. The upgrading tests were conducted in a stirred tank (autoclave) reactor over a CoMo/Al2O3 catalyst synthesized by sequential incipient wetness impregnation. A slurry was obtained after the reaction and separated into liquid and solid product by filtration. The spent catalyst was reused several times by repeating a similar experiment without pre-sulfiding, burning off coke, or any other pretreatment procedure. A sample of the CoMo/Al2O3 was collected at different stages of the operation and further characterized to analyze the changes in structural and chemical states. The extent of the hydrodesulfurization efficiency of the catalyst was evaluated by analyzing the sulfur contents in both feed oil and oil products. The hydrocracking ability of the catalyst was also ascertained by assessing the boiling point distribution in feed oil and liquid products. The upgraded oil met the requirements for Grade II and Grade III marine fuels of the Peoples' Republic of China, under the newly amended regulation-GB17411-2015/XG1-2018. The Grade II fuel has a sulfur limit of 0.5 wt% (for ships operating in international waters), while the Grade III has a sulfur limit of 0.1 wt% (for vessels operating within sulfur emission control areas).
2 Experimental
2.1 Chemical reagents
The chemical reagents of Co(NO3)2·6H2O and Citric acid were purchased from Tianjin Damao Chemical Reagent Factory, while (NH4)6Mo7O24·4H2O and γ-Al2O3 were obtained from Tianjin Hengxing Chemical Preparation Co. Ltd. and Sinopharm Chemical Reagent Co. Ltd., respectively. All chemicals were of analytical grade and used as received without any further purification. The feed oil used was a shale oil obtained from Beipiao, China, whose properties are listed in Table 1. The shale oil had a sulfur content of about 1.32 wt%, while the oil fraction with a boiling point above 350 °C was about 66 vol%.| Parameter | Feed oil | R1 | R2 | R3 | R4 | R5 |
|---|---|---|---|---|---|---|
| Density (g ml−1) | 0.923 | 0.856 | 0.843 | 0.845 | 0.849 | 0.854 |
| Viscosity at 20 °C (mPa s) | 68.4 | 13.87 | 11.88 | 11.32 | 8.10 | 17.11 |
| Sulfur (wt%) | 1.32 | 0.14 | 0.1 | — | — | 0.13 |
| Boiling point (oC) | Distillation fraction (vol%) | |||||
|---|---|---|---|---|---|---|
| IBP–180 °C | 1.37 | 36.47 | 45.91 | 44.26 | 39.01 | 32.98 |
| 180–350 °C | 32.26 | 25.42 | 18.17 | 19.79 | 23.69 | 26.07 |
| 350–500 °C | 44.54 | 26.89 | 23.48 | 24.46 | 26.03 | 29.81 |
| >500 °C | 21.83 | 11.22 | 12.44 | 11.49 | 11.28 | 11.14 |
2.2 Catalyst preparation
The CoMo/Al2O3 catalyst was synthesized by sequential incipient wetness impregnation method using Co(NO3)2·6H2O and (NH4)6Mo7O24·4H2O as precursors. γ-Al2O3 powder support was impregnated with the aqueous solution of (NH4)6Mo7O24·4H2O, followed by stirring for 4 h and drying at 110 °C for 8 h. To this material, Co(NO3)2·6H2O aqueous solution was further impregnated and stirred for 4 h. The latter was also dried at 110 °C for 8 h. Impregnation with citric acid (CA) followed, at a CA/Mo ratio of 1.5, and then drying at 110 °C for 8 h. The MoO3 and CoO loading were kept at 17.0 wt% and 3.0 wt%, respectively. The resultant sample was then calcined at 550 °C for 5 h at a ramp rate of 1 °C min−1 to obtain the catalyst, and was designated as Fresh CoMo/Al2O3.2.3 Characterization
X-ray diffraction (XRD) measurements were conducted using a Bruker D8 ADVANCE spectrometer working at 40 kV and 30 mA in a 2θ range of 10–90° and a scan speed of 6° min−1. Thermal properties of the samples were analyzed in air by ThermoPlus EV02 TG 8121. Transmission electron microscope (JEOL-JEM-2100F) was used to analyze the morphologies of the fresh, presulfided, and spent catalyst samples. The samples' specific surface areas were calculated using the Brunauer–Emmett–Teller (BET) method, based on the nitrogen adsorption–desorption isotherms measured on the ASAP 2020C analyzer. Simultaneously, the pore size distribution was analyzed according to the Barrett–Joyner–Halenda (BJH) method. The total pore volume was determined from the volume of nitrogen adsorbed at the relative pressure p/p0 of 0.995. The X-ray photoelectron spectroscopy measurement was performed on a Thermo ESCALAB 250XI spectrometer, equipped with monochromatized A1Kα radiation (225 W, 0.45 eV, Ag 3d5/2) under a minimum XPS analysis area of 3 × 7 mm2. Ammonia-temperature programmed desorption (NH3-TPD) was carried out on a TPD/TPR/TPO Belcat II instrument and analyzed with ChemMaster software. The sulfur content of the upgraded liquid product was analyzed by the RPP-5000SN analyzer. Simulated distillation was carried out on a Clarus 690 PerkinElmer gas chromatography (GC) based on ASTM D6352 method and analyzed with software developed by SINOPEC, to evaluate the boiling point distribution of the upgraded liquid products to ascertain the hydrocracking activity of the catalyst. The calibration mixture of the GC contained hydrocarbons from nC5–C100 with column details as follows: GSD-3 10 m length, 0.53 mm internal diameter, and a film thickness capillary of 0.15 μm. The viscosity and density of feed oil and all upgraded liquid samples collected after the reaction were also measured and compared to assess the upgrading level. The analysis of the produced gas was performed on INFICON micro GC fusion.2.4 Hydro-upgrading measurement
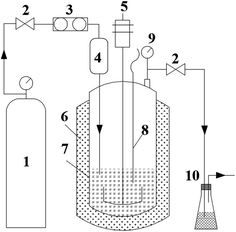
A stirred batch autoclave reactor of 500 ml was used in this study. The diagram of the experimental setup is shown in Fig. 1. In a typical experiment, 6 g of the prepared CoMo/Al2O3 catalyst was sieved through 100 μm mesh and loaded into the reactor. The reactor was flushed with hydrogen repeatedly to replace the trapped air. 1 ml of dimethyl disulfide (DMDS) was then injected into the reactor as a sulfiding agent, and subsequently, the reactor was pressurized to the initial H2 pressure of 4 MPa. The catalyst was pre-sulfided in situ at 360 °C for 4 h, at a ramp rate of 3 °C min−1 and an agitation rate of 800 rpm. After pre-sulfiding, the reactor was again flushed with hydrogen gas to remove the H2S generated from DMDS decomposition, and the obtained activated catalyst was named as pre-sulfided CoMo/Al2O3. Shale oil (60 g) was then charged into the reactor through the oil inlet, from a feed tank mounted on the top of the autoclave reactor. The hydrogen pressure was then adjusted to the desired value of 2–6 MPa as the initial pressure, and after that, the reaction was started. When the temperature inside the reactor reached the set value (340–420 °C), the reaction was allowed to proceed for 1 h under stirring. The effect of agitation from 800 to 1200 rpm was also explored. After the reaction, the reactor was cooled to room temperature naturally at sealed status.At the beginning of the temperature build-up, a mild cracking first occurred, leading to a measurable increase of gas pressure inside the reactor. However, a rapid pressure drop follows due to hydrogen consumption caused by the HDS and hydrocracking reactions. The cooling stage was also characterized by a pressure drop due to the capture and conversion of activated gaseous radicals into the liquid phase by the catalyst (more details in Section 3.2). The non-condensable gas generated was passed through the H2S scrubber and released through the vent. The mixture of the upgraded liquid and the solid product was always separated by filtration and quantified. The weight of the non-condensable gas released was derived by subtraction (eqn (3)).
The spent catalyst collected after filtration was reused subsequently for another round of upgrading without pretreatment. It was reloaded directly into the reactor, and the whole procedure mentioned above was repeated, except for the pre-sulfiding. The CoMo/Al2O3 recycling was investigated under the optimized reaction conditions of temperature (400 °C), pressure (5 MPa), agitation (800 rpm), and reaction time (1 h). These derived samples from the CoMo/Al2O3 catalyst are named as fresh and pre-sulfided, while those of the recycled spent material are denoted as R1, R2, R3, R4, and R5 (where 1, 2, 3, 4, and 5 are the number of catalyst recycling).
The hydrodesulfurization efficiency (sulfur removal) and yields of oil, coke, and gas were calculated using the following equations, respectively.
 | (1) |
 | (2) |
| Gas (wt%) = 100 − liquid yield (wt%) − coke yield (wt%) | (3) |
3 Results and discussion
3.1 Hydrodesulfurization
The reaction temperature is the most influential process parameter in oil upgrading. Over the pre-sulfided CoMo/Al2O3 catalyst, the influence of temperature on the removal of sulfur compounds by hydrodesulfurization was investigated in a range of 340–420 °C. The results are shown in Fig. 2a. The HDS efficiency increased exponentially with an increase in reaction temperature. The positive effect of temperature observed is consistent with most of the literature results.23–25 However, at temperatures above 380 °C, the HDS efficiency recorded was 80.8% and 82.3% for 400 °C and 420 °C, respectively, which was not changed significantly. This could be because a too high reaction temperature for HDS reaction could result in loss of selectivity and higher catalyst deactivation.26 Another reason could be that, since reactive sulfur compounds, such as thiophenes, benzothiophenes (BTs), are the most abundant sulfur compounds in shale oil and are easily converted at moderate temperatures from 340 to 380 °C, hence the rapid sulfur removal. For example, the hydrogenation activity of thiophenes is three times higher than that of dibenzothiophenes,27 which justify the rapid HDS efficiency observed at the range of 340–380 °C. Thus, the small HDS efficiency change from 400–420 °C signifies the conversion of the refractive sulfur compounds, such as DBTs and 4,6-DMDBTs, which are difficult to be removed.28 The same result on the little influence of higher temperature on HDS rate was observed by Haji et al. when studying the HDS of model diesel on PT/Al2O3 catalysts.29 Additionally, higher temperatures promote thermal cracking, evidenced by the liquid products collected at 400 °C and above that were dark brown; in contrast, the samples collected at lower temperatures were in light brown. This indicated that severe coking30 due to the high temperature might have contributed to the decline of the sulfur removal efficiency. Gas and coke yield shown in Fig. 3a showed an increasing trend with temperature, while the liquid output declined rapidly. From the perspective of temperature influence on HDS efficiency, liquid yield, and energy-saving, 400 °C was thus selected as the optimal temperature for further investigations. To reveal the actual advantage of the bimetallic CoMo/Al2O3 catalyst, we also conducted a series of tests for the HDS efficiency under the same reaction conditions of 400 °C, 4 MPa, and 800 rpm, for comparison, as follows: (a) without catalyst, (b) with Al2O3, (c) Co/Al2O3, and (d) Mo/Al2O3. The HDS efficiency results obtained were 23.5%, 28.4%, 33.7%, and 61.2%, respectively, as compared with the 80.8% efficiency recorded on the CoMo/AL2O3. These results highlighted the comparative advantage of the CoMo/Al2O3 over the monometallic catalysts.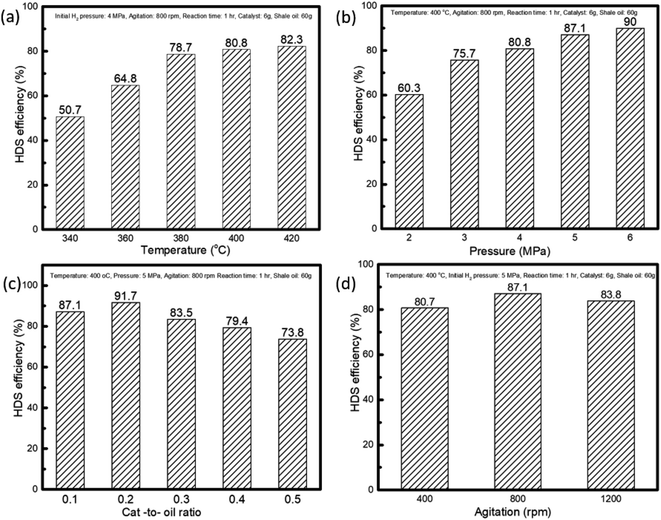 | ||
| Fig. 2 The investigated conditions for reactor optimization: (a) temperature, (b) initial H2 pressure, (c) catalyst-to-oil ratio, (d) agitation. | ||
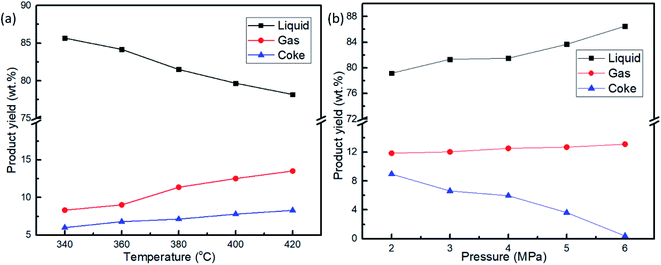 | ||
| Fig. 3 Products yield at (a) 4 Mpa initial H2 pressure and different temperature, (b) at 400 °C and different initial H2 pressure, 800 rpm, 1 h reaction time, 60 g shale oil and 6 g CoMo/Al2O3. | ||
An increase in initial hydrogen pressure positively influences the hydrodesulfurization, as shown in Fig. 3a. The presence of hydrogen boosts the hydrogenation function of the CoMo/Al2O3 catalyst and hence increases the HDS efficiency. This function is expected to be more effective at a higher hydrogen pressure. Also because the hydrogenation of aromatic rings is an important step in the HDS reactions, an increasing HDS efficiency trend was observed.31 The higher hydrogen pressure ensures the solubility of more hydrogen into the shale oil feed, which in essence, is readily available on the surface of the catalyst for hydrodesulfurization reaction, and consequently increases the sulfur removal.32 Fig. 3b shows that the liquid and gas yield increased with H2 pressure, while the coke formation behaved in a reverse trend. H2 pressure is known to improve the HDS reaction performance by increasing the supply of H2 in the liquid phase, thereby increasing hydroconversion and suppressing coke formation.26 As for the slight increase in gas yield as observed in Fig. 3b, it can be explained that not every molecule of hydrogen partakes in the HDS reaction; therefore, as the H2 pressure increases, so does the unreacted gas, leading to the rise of the gas products. This was confirmed from the high concentration of H2 in the product gas analysis carried out in Section 3.2. Thus, 5 MPa of H2 pressure was chosen as the optimal pressure taking into account the insignificant change in the HDS efficiency at higher pressures.
Since the tests were carried out in the slurry phase, the overall reaction rate depends on the solid–liquid–gas mass transfer rates, intrinsic reaction rate, and catalyst concentration. The result in Fig. 2c shows the sulfur removal was proportional to the catalyst concentration at the ratios of 0.1 and 0.2, before experiencing a reversal from 0.3 to 0.5. The apparent drop in HDS efficiency could be due to the increase in the slurry viscosity as the catalyst concentration increases. An increase in slurry viscosity could lead to decreased fluidity in liquid–solid suspension inside the reactor, resulting in a decreased HDS performance.33 Additionally, the increasing concentration of the solid catalyst might result in precipitation,34 which implies that the slurry-phase reactor should be operated at the highest possible concentration of solid catalyst within the hydrodynamics limit for high reaction efficiency.32 The results shown in Fig. 2c indicate that the catalyst to oil ratio of 0.2 gives the highest possible concentration of the CoMo/Al2O3 catalyst for optimal HDS efficiency. However, the ratio of 0.1 seems more logical, given the little change in efficiency from 0.1 to 0.2. Hence, the catalyst to oil ratio of 0.1 was chosen for further investigations.
Fig. 2d shows the agitation effect on HDS efficiency after reaction at 400 °C at an initial hydrogen pressure of 5 MPa. As it is known, agitation helps to increase the dispersion of catalyst particles, which in turn reduces the mass transfer resistance between the solid–liquid–gas phases in the reaction medium.1 Increasing the agitation rate from 400 to 800 rpm increased the sulfur removal from 80.67% to 87.10%. At a low agitation rate (400 rpm), the HDS activity might have been hindered by the poor contact between the liquid and catalyst's active sites. With an increase of the agitation rate to 800 rpm, the efficiency increased. However, with a further increase to 1200 rpm, the sulfur removal dropped to 83.83%. This indicates the sulfur removal efficiency reached an optimal value at 800 rpm. Thus, any further increase did not have a positive effect. A similar result was reported by Al-Marshed et al.35 when optimizing a slurry reactor for heavy oil upgrading. They realized an optimal agitation midway between 400–900 rpm and experienced an increase in viscosity and a decrease in API gravity as the agitation rate was raised to a maximum (900 rpm). The drop in efficiency was attributed to the nano-size effect of the catalyst particles, as they require a moderate agitation speed to maintain an adequate suspension necessary for the reaction.36 This is also consistent with the findings of Hart et al.22
3.2 Produced gas composition
The composition of the produced gas with an increase in reaction temperature is shown in Table 2. With an initial pressure of 4 MPa, an agitation rate of 800 rpm, and a reaction time of 1 h, a significant difference was observed in the decrease of hydrogen composition in the gas product, as the temperature increases from 340 to 420 °C. The decreasing hydrogen gas explains the hydrodesulfurization efficiency with reaction temperature, as shown in Fig. 2a, due to the increased hydroconversion. Another noticeable change is in the rising amount of aliphatic and olefin gases with temperature increase, which correlates with the increasing gas yield shown in Fig. 3a. Also, the growing coke yield in Fig. 3a was due to the observed rise in aliphatic hydrocarbons, because their production would have led to some carbon rejection to balance the elemental H/C distribution in their chain, since they have a high hydrogen-to-carbon ratio.37 However, the small change in coke formation was due to the use of hydrogen gas as the reaction media. In the presence of hydrogen, the hydroconversion function of the CoMo/Al2O3 allows it to suppress thermal cracking with an increase in reaction temperature.| Gas | Reaction temperature | ||||
|---|---|---|---|---|---|
| 340 °C (vol%) | 360 °C (vol%) | 380 °C (vol%) | 400 °C (vol%) | 420 °C (vol%) | |
| nC1–C5 | 1.233 | 4.131 | 7.722 | 14.82 | 27.752 |
| Olefin (C2–C3) | 0.023 | 2.73 | 0.039 | 0.093 | 4.625 |
| H2 | 96.236 | 87.698 | 86.281 | 79.699 | 60.649 |
| O2 | 0.361 | 0.665 | 0.879 | 0.251 | 0.859 |
| CO2 | 0.03 | 0.148 | 0.094 | 0.008 | 0.129 |
| CO | 0.161 | 0.162 | 0.148 | — | 0.067 |
| N2 | 1.956 | 4.467 | 4.833 | 5.129 | 5.87 |
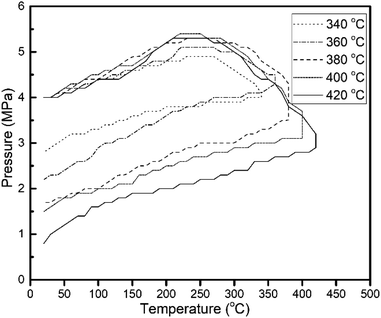
The changes in the internal pressure of the reactor with temperature are shown in Fig. 4, and show a similar trend for all the experiments conducted. With an initial pressure of 4 MPa, an agitation rate of 800 rpm, and a reaction time of 1 h, the reactor profile for reactions at varying temperatures (340–420 °C) was determined. The pressure rise in the temperature build-up stage was a result of cracking reactions. Hydrogen consumption started when the temperature hit 200–230 °C mark, from where the internal pressure started dropping. The hydrodesulfurization and hydrocracking started when H2 consumption was initiated and lasted for 1 h (experimentally determined for complete H2 consumption) until its termination. Upon cooling, the catalyst captured and converted activated radicals such as methyl, ethyl, and light hydrocarbons from the gas phase into the liquid phase, causing the continuous drop in pressure inside the reactor.1 Fig. 3 shows how the liquid, gas, and coke yield varied with the reaction temperature and initial hydrogen pressure. Higher temperatures led to the formation of more coke and incondensable gases, while the increase in the initial hydrogen pressure resulted in a higher liquid yield. However, it is also noticed that the gas yield increased with the rise of the initial H2 pressure, attributable to the presence of more unreacted hydrogen in the reactor. The drastic drop in coke yield at higher initial hydrogen pressure confirmed the increase of hydroconversion and the conversion of heavy molecular weight hydrocarbons into intermediate and light distillates in the system.
3.3 Catalyst reusability and hydrocracking activity
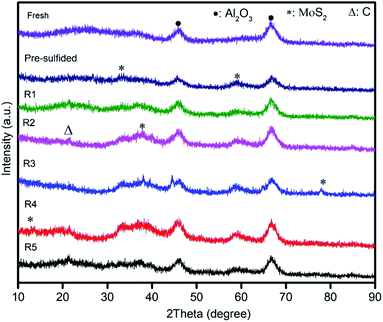
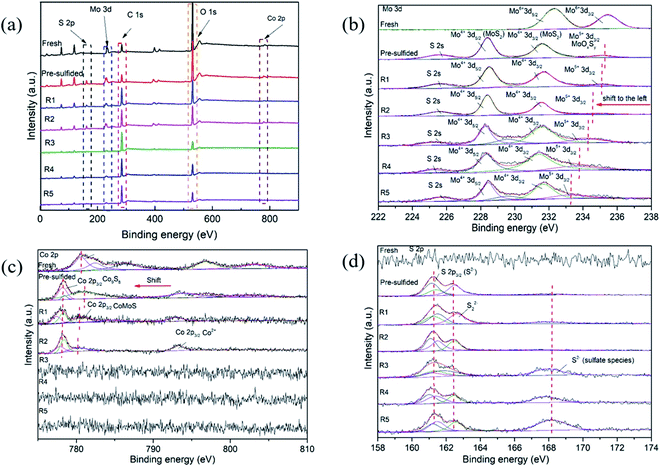
The stability of the CoMo/Al2O3 was studied for the hydrodesulfurization of shale oil. The catalyst was directly reused five times without any form of treatment. Fig. 5 shows the HDS efficiency of the CoMo/Al2O3 catalyst with an increase of the recycle times. During the CoMo/AL2O3 recycling, the HDS efficiency increased from 89.4% in the first run to 92.2% after the second run. This increase coincides with the emergence of an additional MoS2 peak in the XRD patterns of the CoMo/Al2O3 sample (from Run 1 (R1) to Run 2 (R2)), as shown in Fig. 7. The MoS2 phase is the active phase of the catalyst for the HDS reaction. This was also confirmed by the shifting of the oxidic Mo species to lower binding energies of sulfide (active) state in the second run of the reaction, as revealed by the XPS results in Fig. 8b. As the reaction continued to the 3rd and 4th runs, sulfur was completely not detected in the product oil. This signifies a sulfur content below the detection capacity of the analyzing equipment, which falls between 1–9 ppm. The sulfur content of that range indicates a 99.5–99.9% HDS efficiency by the catalyst. The improved efficiency is attributed to the higher sulfidation degree of the CoMo/Al2O3 catalyst in the sulfur-rich shale oil, as indicated by the further conversion of oxidic and partially sulfided Mo species into a fully active state in Fig. 8b. However, the efficiency dropped from the 99.5–99.9% in the run 3 and 4 to 90.1% in the run 5, which was attributed to coke accumulation on the catalyst surface (Fig. 8a). From the second reaction run (run 2), the liquid yield decreased drastically, while both gas and coke yield became higher (Fig. 5). It is believed that leaching of the catalyst from previous reactions could cause loss of some active components, which might have induced some catalytic cracking due to insufficient active sites in the subsequent runs. Table 3 shows the change of active component concentrations in catalyst samples with reaction runs. The loss of Co and Mo species and the increasing accumulation of coke on the catalysts' surface are evident as the catalytic reaction continued, confirming our initial suggestion of catalytic cracking due to the loss of active components. Therefore, the drop in HDS efficiency was inevitable. Additionally, the increased acidity in the catalyst with reactions runs, as indicated by the NH3-TPD results shown in Table 4, also increased the catalytic cracking. A similar study by Sudhakar et al.38 reported that a spent hydroprocessing catalyst was very active for the selective removal of sulfur in the naphtha fraction. Sakabe et al.39 achieved 80% HDS using a spent hydrotreating catalyst to upgrade residual oil. In some studies, the spent catalysts were first decoked before reused and were found to have good activity and selectivity for mild hydrocracking of vacuum distillates to middle distillates.40,41 A comprehensive review of the recycling of spent HDS catalysts can be referred.42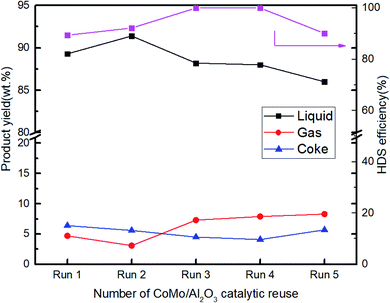 | ||
| Fig. 5 Number of CoMo/Al2O3 catalytic run for hydrodesulfurization of shale oil (R1 to R5: 400 °C, initial H2 pressure of 5 MPa, 1 h reaction time, 60 g shale oil and 6 g catalyst). | ||
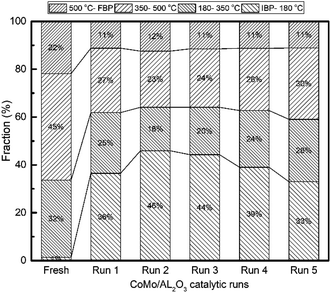 | ||
| Fig. 6 Boiling point distribution of upgraded oil products obtained by recycling CoMo/Al2O3 catalyst at 400 °C, initial H2 pressure of 5 MPa, 800 rpm and 1 h reaction time (R1 to R5). | ||
| Sample | Surface atomic concentration (%) | |||||
|---|---|---|---|---|---|---|
| Co | Mo | S | C | O | Al | |
| Fresh | 1.29 | 3.27 | 0.79 | 15.34 | 79.31 | — |
| Pre-sulfided | 1.15 | 3.07 | 1.88 | 37.22 | 56.68 | — |
| R1 | 0.99 | 2.62 | 1.93 | 58.77 | 35.69 | — |
| R2 | 0.63 | 1.59 | 1.94 | 59.07 | 36.77 | — |
| R3 | 0.37 | 1.01 | 5.24 | 66.06 | 24.51 | 2.9 |
| R4 | 0.35 | 0.79 | 3.78 | 70.07 | 20.27 | 4.74 |
| R5 | 0.32 | 0.74 | 1.74 | 72.91 | 19.17 | 5.18 |
| Sample | Amount of ammonia desorbed (μmol g−1) | |
|---|---|---|
| At < 200 °C (weak acidic site) | At > 350 °C (strong acidic site) | |
| Fresh | 383 | — |
| Pre-sulfided | 70 | — |
| R1 | 293 | 84 |
| R2 | 236 | 86 |
| R3 | 221 | 89 |
| R4 | 206 | 93 |
| R5 | 221 | 112 |
The hydrocracking activity was determined by analyzing the simulated distillation results of the liquid products, as shown in Fig. 6. With increasing catalyst reuse times, the fraction of light distillates (IBP–180 °C) increased significantly from 1.37% in the fresh shale oil to about 46% by the second run. The volume of fractions in the region between 350–500 °C and 500 oC–FBP were almost cut by half due to conversion to the light distillates (IBP–180 °C). However, the 180–350 °C fraction was less impacted. The boiling point distribution for the shale oil samples upgraded over recycled CoMo/AL2O3 (R1 to R5) is presented in Table 1. All samples showed a similar boiling point distribution trend, indicating that the majority of the hydrocracking occurred in the heavy components of the shale oil. The hydrocracking activity is also in agreement with the increased acidity of the catalyst samples, from the NH3-TPD results shown in Table 4.
3.4 Catalysts characterization
Fig. 7 shows the XRD patterns of seven (7) different CoMo/Al2O3 catalyst samples. In all the samples, two diffraction peaks at 2θ = 46° and 66.7° were observed, corresponding to (400) and (440) planes of γ-Al2O3 (PDF#51-0769).43 For the fresh CoMo/Al2O3 sample, there were no peaks of the Co and Mo oxides detected, suggesting a high dispersion of these metal oxides on the Al2O3 support. The peaks at 33° and 58.3° attributing to the characteristic planes (100) and (110) of MoS2 (PDF#17-0744) were identified in the pre-sulfided sample. Additional new peaks of MoS2 at 14.2°, 38.2°, and 78° belonging to (002), (103), and (201) planes10 emerged in the CoMo/Al2O3 samples after the second, third, and fourth times of catalyst reuse (R2, R3, and R4), respectively. The intensity of these diffraction peaks increased with the increasing reactions runs. The emergence of the new MoS2 peaks explains the change in the sulfidation degree of the CoMo/Al2O3 catalyst as recycling continued, and is justified by the increasing HDS efficiency shown in Fig. 5. The catalytic HDS efficiency is directly proportional to the MoS2 phase.44 However, all these peaks diminished after the fifth run, which should be due to coke accumulation on the catalyst surface. This also coincides with the drop in the HDS efficiency observed after the 5th run, as shown in Fig. 5.The CoMo/Al2O3 catalyst samples at various stages of the experiment were also analyzed by X-ray photoelectron spectroscopy. Fig. 8a shows the Mo 3d, S 2p, C 1s, O1s, and Co 2p survey spectra of the detected surface species, and Fig. 8b shows the deconvolution of the Mo 3d spectra. In the fresh CoMo/Al2O3 sample, two prominent peaks were observed, corresponding to Mo6+ 3d5/2 (BE 232.3 eV) and Mo6+ 3d3/2 (BE 235.5 eV) and representing the oxidic Mo.9,43 In the pre-sulfided sample, the Mo 3d spectrum decomposed into four bands, corresponding to Mo6+ 3d3/2, Mo4+ 3d5/2, Mo4+ 3d3/2 and Mo5+3d3/2. The Mo6+ 3d3/2 peak at BE 235.2 eV belongs to oxidic Mo species that were still in oxide form, while those of Mo4+ 3d5/2 (BE 228.4 eV) and Mo4+ 3d3/2 (BE 231.5 eV) belong to fully sulfided Mo species (MoS2 species) in Co–Mo–S phase.43,45 The peak found within the range of BE 230.7 to BE 234.5 is ascribed to Mo oxy-sulfided (Mo5+3d3/2) species (Mo-species that were partially sulfided). After the first catalytic run (R1), there was no visible change to the Mo 3d peaks, except for the small shift in Mo6+ 3d3/2 and Mo5+ 3d3/2 peaks to lower binding energies, indicating a slight increase in sulfidation degree. After the second run (R2), the Mo4+ 3d peaks showed an increased intensity, with a more visible shifting of Mo6+ 3d3/2 and Mo5+ 3d3/2 peaks to lower binding energies, as indicated in Fig. 8b. The shifting of peaks to the left (low binding energy) indicates the transformation of more oxidic and partially sulfided Mo species into the full sulfide state, and this effect was reflected by the increased HDS efficiency from run 2 onward (Fig. 5). Subsequently, as the recycling of the catalyst continued, it accompanied the transition of more oxidic Mo-species into the sulfide phase. This confirms the XRD results (Fig. 7), which showed the formation of more MoS2 with an increasing number of catalytic runs. However, the fall in the HDS efficiency after the last run (R5) was observed, which should be related to the increased coking on the catalyst surface, as evidenced by the raised intensity of C 1s peak in this sample (Fig. 8a).
Fig. 3c shows the Co 2p spectra with an intense peak at 780.3 eV, together with some satellite peaks in the fresh CoMo/Al2O3 sample. The pre-sulfided sample had peaks at BE 778 eV, 779 eV, and 794 eV, which are assigned to Co9S8, CoMoS, and Co (CoOx or CoAl2O4),46 respectively. A shift to lower binding energy was noted in favor of the CoMoS (active phase). However, due to heavy coking and also the relatively low Co loading in the catalyst, no Co phases were detected in the samples from the third to fifth run. The increasing intensity of C 1s (carbon) peak after the second run in Fig. 8a could correlate with the disappearance of the Co peak. The increase in sulfur removal from R2 to R4 was attributed to the increasing number and slab size of the MoS2, as explained previously. For the S 2p spectra shown in Fig. 8d, there was no sulfur peak observed in the fresh sample. The band at 161.2–162.3 eV in the pre-sulfided and other subsequent samples was attributed to the S 2s core levels, corresponding to the sulfur species at active (sulfide) state. Except for the first three catalyst samples, the S 2p spectra for the reused CoMo/Al2O3 from the third to the fifth run (R3 to R5) exhibited a peak at 168.2 eV, indicating the presence of sulfate species. This implies that oxidation occurred while transferring the solid catalyst for subsequent reuse.47 The detailed elemental concentrations of the used catalyst samples derived from the atomic peak% of each element in the XPS data are shown in Table 3.
The temperature-programmed desorption of ammonia was performed to measure acidity strength of the catalyst samples. The NH3-desorption temperature determines the strength of an acid site, and the higher the acidity, the greater the desorption temperature will be.48 Because NH3 is basic and adsorbs readily on acidic sites, and if the acid strength is high, the bond is stronger, and consequently, the greater is the energy (temperature) required to desorb. Thus, based on the NH3-desorption temperature, the acidic sites in hydrotreating catalysts are categorized as weakly acidic (<200 °C), moderately acidic (200–350 °C), and strongly acidic (>350 °C).49 Table 4 shows the distribution of acid sites based on the acidic strength in all catalyst samples. As can be seen, the amount of NH3 desorbed at temperature >350 °C by the R5 sample is the highest, implying its ability to retain the most NH3 at high temperatures, thereby making it the sample with the highest acidic strength. Therefore, based on Table 4, the acidic strength of all the samples follows the order R5 > R4 > R3 > R2 > R1 > pre-sulfided > fresh.
The N2 adsorption–desorption isotherms, and the pore size distribution of the fresh, pre-sulfided and recycled CoMo/Al2O3 samples are displayed in Fig. 9a and b, respectively. The fresh sample exhibited the type IV isotherm characteristics, while the pre-sulfided and the recycled samples depicted both the type II and IV isotherms, indicating the filling or capillary condensation in mesopores. For the recycled CoMo/Al2O3, the decreasing N2 uptake over the same relative pressure range (p/p0) is visible with an increasing number of catalytic runs. The hysteresis loop type H2 in isotherms shows pores with narrow mouths (ink-bottle pores). In the pre-sulfided sample, this may be due to the percolation of sulfide compounds into the pores of the catalyst, which got even worse with the deposition of coke in the remaining samples, as indicated by the absence of hysteresis closure. Both the specific surface area and pore-volume decreased drastically. However, the pore diameter kept increasing, probably due to the loss of mesoporosity resulting from the merging of smaller pores into larger ones.
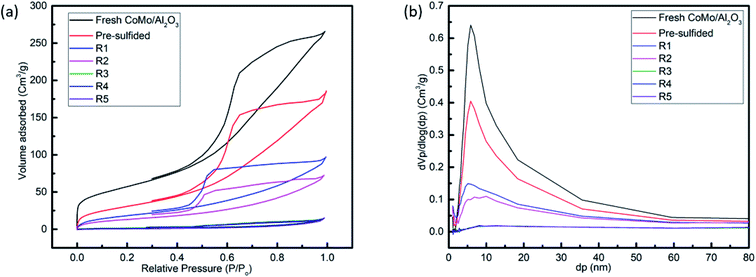 | ||
| Fig. 9 (a) Nitrogen adsorption–desorption isotherms, (b) pore size distribution for fresh, pre-sulfided, R1, R2, R3, R4 and R5 sample of CoMo/Al2O3. | ||
The BET surface area, average pore volume, and average pore diameter are listed in Table 5. The number of active sites determine the catalyst activity, while the porosity determines its selectivity to a certain extent.50 However, the state of the active component also plays a big role. In this case, it can be seen that the loss of surface area from the first sample after reuse (R1 = 72.17 m2 g−1) to the last sample (R5 = 3.3 m2 g−1) was over 20-fold. Nevertheless, the sulfur removal efficiency was almost the same (R1 = 89.4% and R5 = 90.1%), confirming the strong effect of the sulfidation degree of the active component as the catalytic run continued.
| Sample | SBET (m2 g−1) | Vp (cm3 g−1) | DBJH (nm) |
|---|---|---|---|
| Fresh CoMo/Al2O3 | 207.5 | 0.41 | 6.72 |
| Pre-sulfided | 119 | 0.31 | 6.27 |
| R1 | 72.17 | 0.17 | 4.82 |
| R2 | 50.85 | 0.13 | 4.97 |
| R3 | 6.36 | 0.03 | 8.23 |
| R4 | 5.13 | 0.02 | 9.31 |
| R5 | 3.30 | 0.02 | 10.50 |
The TEM images shown in Fig. 10 reveal a layered sheet morphology for the fresh catalyst sample. By visualizing the fringes characteristics, it was found that there was an increase in the MoS2 slab length and number of layers after pre-sulfiding.51 However, when the CoMo/AL2O3 catalyst was recycled, agglomeration of the metal particles seemed to occur with the appearance of more coagulated and dense patches in the TEM images. Coke deposits identified by the light layer covering the surface of the catalyst increased with the recycling time of the catalyst. The increasing amount of coke covering the surface of the catalyst, as can be observed from Fig. 10c–f, is also a confirmation of the elemental XPS results in Table 3, which revealed 59.07, 66.06, 70.07, and 72.91% carbon concentration in these samples, respectively.
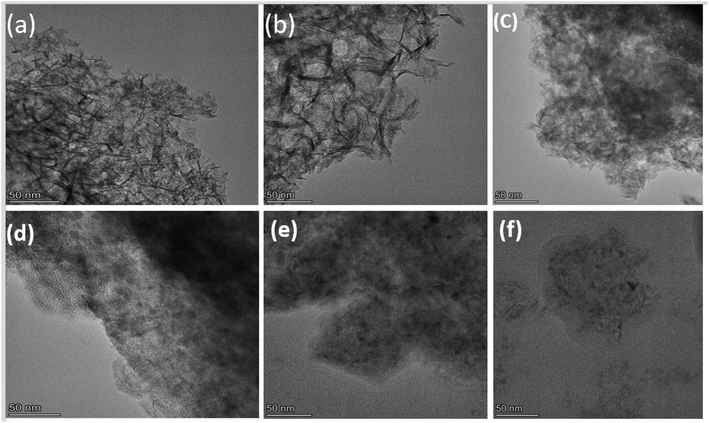 | ||
| Fig. 10 TEM images for CoMo/Al2O3 catalysts of (a) fresh, (b) pre-sulfided, (c) R2, (d) R3, (e) R4 and (f) R5. | ||
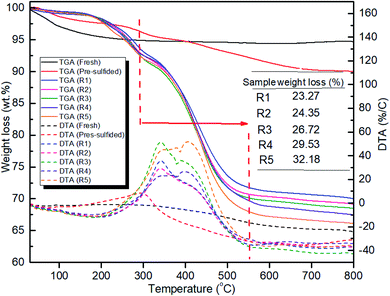
HDS catalysts are likely to suffer from coke deposition during the oil upgrading due to the high concentration of macromolecules in shale oil, the high acidity, and the high temperature.52 Hence, TGA was used to quantitatively analyze the amount of coke deposited on the surface of the CoMo/Al2O3 catalyst. Fig. 6 shows the thermograms plotted as a function of temperature increase for the fresh, pre-sulfided, and spent CoMo/Al2O3 catalysts. There are several stages of weight loss for the spent catalysts. The stage between 25 to 280 °C was due to the devolatilization of residual oil in the solid sample, while the one from 320 °C to terminal temperature represented the burn-off of soft coke and hard coke.53 The thermogravimetric weight loss between 280 °C and 580 °C in sample R1, R2, R3, R4, and R5 is 23.27, 24.35, 26.72, 29.53, and 32.18 wt%, respectively. These weight losses closely correlate with the elemental carbon concentration in the samples, as analyzed by XPS (Table 3). The pre-sulfided sample was used as the reference since it was used for the first catalytic reaction. The relatively small change in weight loss observed (Fig. 11) after the successive recycling of the CoMo/Al2O3 catalyst could be attributed to the presence of hydrogen in the reaction media, which suppressed excessive carbon–rejection reaction. Also, the function of the catalyst for capturing and terminating the produced aromatic radicals that would otherwise condense to form coke played a big part in reducing coking. Although coke deposits decrease catalyst activity,50 in this case, the effect was hardly reflected in the HDS activity of the CoMo/Al2O3 catalyst, which underlines the active state of the catalyst. However, the continued increase in the amount of coke on the catalyst surface reflected in the liquid yield as the recycling continued, as shown in Fig. 5.
4 Conclusion
In summary, we report the hydrotreating of shale oil with high sulfur content and viscosity over a CoMo/Al2O3 catalyst synthesized by sequential incipient wetness impregnation in a batch autoclave reactor. An 87.2% HDS efficiency and 88.2% viscosity reduction are obtained at the optimum combination of the reaction conditions (temperature 400 °C, initial H2 pressure 5 MPa, agitation 800 rpm, and catalyst-to-oil ratio 0.1). The recycling of the spent catalyst without any form of pretreatment is investigated under the optimum conditions. The results reveal a gradual increase in the sulfur removal efficiency with the rise in the recycling runs. The best results are obtained by recycling the CoMo/Al2O3 catalyst for four consecutive runs (R4) which enabled: a 99.5–99.9% sulfur removal, a reduction of viscosity by 88.2%, and an increase in the light distillates fraction (IBP–180 °C) by 37.6%. Recycling the CoMo/Al2O3 increases its acidity, as proven by the NH3-TPD analysis, which further contributes to its hydrocracking ability. Gas product analysis shows increasing H2 consumption with an increase in reaction temperature. The bimetallic CoMo/Al2O3 shows a superior HDS performance (80.8%) to that of the monometallic Co/Al2O3 (33.7%) and Mo/AL2O3 (61.2%) catalysts under the same reaction conditions. This excellent catalytic performance is attributed to the increased sulfidation degree of the catalyst in the sulfur-rich shale oil. The upgraded oil can meet the sulfur content requirements for Grade II and Grade III marine fuels (GB17411-2015/XG1-2018) of the Peoples' Republic of China. The catalyst also demonstrates an excellent hydrocracking activity in converting the majority of heavy fractions of the shale oil into light distillates.Conflicts of interest
The authors declare that they have no known competing financial interests or personal relationships that could have appeared to influence the work reported in this paper.Acknowledgements
This work was financially supported by the National Key Research and Development Program of China (Grant 2018YFE0103400) and the Education Key Program of Liaoning Province, China (Grant LZ2017001).References
- A. Hart, M. Greaves and J. Wood, Chem. Eng. J., 2015, 282, 213–223 CrossRef CAS.
- J. A. M. S. Rana, S. K. Maity and G. Marroquin, Int. J. Oil, Gas Coal Technol., 2008, 1(3), 250 CrossRef.
- O. S. Al-Ayed and M. d. Matouq, J. Energy Resour. Technol., 2009, 131(1) DOI:10.1115/1.3068338.
- G. Jin, S. Li and H. Yu, Oil Shale, 2010, 27, 126 CrossRef.
- M. Ja'fari, S. L. Ebrahimi and M. R. Khosravi-Nikou, Ultrason. Sonochem., 2018, 40, 955–968 CrossRef.
- G. H. C. Prado, Y. Rao and A. de Klerk, Energy Fuels, 2016, 31, 14–36 CrossRef.
- Y. Muhammad, Y. Lu, C. Shen and C. Li, Energy Convers. Manage., 2011, 52, 1364–1370 CrossRef CAS.
- Y. S. Al-Zeghayer, P. Sunderland, W. Al-Masry, F. Al-Mubaddel, A. A. Ibrahim, B. K. Bhartiya and B. Y. Jibril, Appl. Catal., A, 2005, 282, 163–171 CrossRef CAS.
- L. Ding, Y. Zheng, H. Yang and R. Parviz, Appl. Catal., A, 2009, 353, 17–23 CrossRef CAS.
- H. Zhang, H. Lin and Y. Zheng, Int. J. Chem. React. Eng., 2016, 14, 703–711 CAS.
- L. Ding, Y. Zheng, Z. Zhang, Z. Ring and J. Chen, Appl. Catal., A, 2007, 319, 25–37 CrossRef CAS.
- J. Ramírez, P. Rayo, A. Gutiérrez-Alejandre, J. Ancheyta and M. S. Rana, Catal. Today, 2005, 109, 54–60 CrossRef.
- C. Zhang, X. Liu, T. Liu, Z. Jiang and C. Li, Appl. Catal., A, 2019, 575, 187–197 CrossRef CAS.
- Y. V. Vatutina, O. V. Klimov, E. A. Stolyarova, K. A. Nadeina, I. G. Danilova, Y. A. Chesalov, E. Y. Gerasimov, I. P. Prosvirin and A. S. Noskov, Catal. Today, 2019, 329, 13–23 CrossRef CAS.
- W. Wang, Y. Yang, H. Luo, T. Hu and W. Liu, Catal. Commun., 2011, 12, 436–440 CrossRef CAS.
- I. Shafiq, S. Shafique, P. Akhter, W. Yang and M. Hussain, Catal. Rev., 2020, 1–86, DOI:10.1080/01614940.2020.1780824.
- M. Yumoto, K. Usui, K. Watanabe, K. Idei and H. Yamazaki, Catal. Today, 1997, 35, 45–50 CrossRef CAS.
- H. Yu, S. Li and G. Jin, Energy Fuels, 2010, 24, 4419–4424 CrossRef CAS.
- S. K. Maity, J. Ancheyta, F. Alonso and P. Rayo, Fuel Process. Technol., 2013, 106, 453–459 CrossRef CAS.
- K. Kohli, R. Prajapati, S. K. Maity, M. Sau and M. O. Garg, Fuel, 2016, 175, 264–273 CrossRef CAS.
- K. Zhang, J. Yu, S. Gao, C. Li and G. Xu, Energy Fuels, 2017, 31, 1362–1369 CrossRef CAS.
- A. Hart, C. Lewis, T. White, M. Greaves and J. Wood, Fuel Process. Technol., 2015, 138, 724–733 CrossRef CAS.
- Y. Muhammad and C. Li, Fuel Process. Technol., 2011, 92, 624–630 CrossRef CAS.
- C. Papadopoulou, J. Vakros, H. K. Matralis, C. Kordulis and A. Lycourghiotis, J. Colloid Interface Sci., 2003, 261, 146–153 CrossRef CAS.
- Z. S. M. Lewandowskia, Fuel, 2000, 79, 487–495 CrossRef.
- J. Ancheyta, A. Alvarez-Majmutov and C. Leyva, 2016, DOI:10.1002/9781119248491.ch13, 295–329.
- P. R. Robinson and G. E. Dolbear, 2006, DOI:10.1007/978-0-387-25789-1_7, 177–218.
- M. S. Rana, A. Al-Barood, R. Brouresli, A. W. Al-Hendi and N. Mustafa, Fuel Process. Technol., 2018, 177, 170–178 CrossRef CAS.
- S. Haji, Y. Zhang, D. Kang, M. Aindow and C. Erkey, Catal. Today, 2005, 99, 365–373 CrossRef CAS.
- Z. Fu, Z. Wang, W. Lin, W. Song and S. Li, Appl. Catal., A, 2017, 547, 248–255 CrossRef CAS.
- A. Al-Mutairi and A. Marafi, Energy Fuels, 2012, 26, 7257–7262 CrossRef CAS.
- Z. Deng, T. Wang and Z. Wang, Chem. Eng. Sci., 2010, 65, 480–486 CrossRef CAS.
- J. F. Brady, Chem. Eng. Sci., 2001, 56, 2921–2926 CrossRef CAS.
- M. J. Angeles, C. Leyva, J. Ancheyta and S. Ramírez, Catal. Today, 2014, 220–222, 274–294 CrossRef CAS.
- A. Al-Marshed, A. Hart, G. Leeke, M. Greaves and J. Wood, Energy Fuels, 2015, 29, 6306–6316 CrossRef CAS.
- R. Jafari, J. Chaouki and P. A. Tanguy, Int. J. Chem. React. Eng., 2012, 10(1) DOI:10.1515/1542-6580.2808.
- A. Hart, J. Wood and M. Greaves, J. Pet. Sci. Eng., 2017, 156, 958–965 CrossRef CAS.
- S. G. C. Sudhakar, US pat., 5286373, 1994.
- Y. T. Sakabe T, Hydrocarbon Process., 1979, 59, 103–107 Search PubMed.
- K. G. Mittal, S. C. Gupta, R. K. Agarwal and J. R. Rai, J. Chem. Technol. Biotechnol., 2007, 39, 59–64 CrossRef.
- A. N. B. Thorsten and F. Diehl, USPA 20050075528, 2005.
- M. Marafi and A. Stanislaus, Resour., Conserv. Recycl., 2008, 52, 859–873 CrossRef.
- C. Zhang, M. Brorson, P. Li, X. Liu, T. Liu, Z. Jiang and C. Li, Appl. Catal., A, 2019, 570, 84–95 CrossRef CAS.
- M. Ramos, G. Berhault, D. A. Ferrer, B. Torres and R. R. Chianelli, Catal. Sci. Technol., 2012, 2, 164–178 RSC.
- W. Chen, X. Long, M. Li, H. Nie and D. Li, Catal. Today, 2017, 292, 97–109 CrossRef CAS.
- B. Xia, L. Cao, K. Luo, L. Zhao, X. Wang, J. Gao and C. Xu, Energy Fuels, 2019, 33, 4462–4473 CrossRef CAS.
- S. C. Bendezu, J. L. G. Fierro and A. L. Agudo, Appl. Catal., A, 2000, 197, 47–60 CrossRef CAS.
- S. Badoga, R. V. Sharma, A. K. Dalai and J. Adjaye, Fuel, 2014, 128, 30–38 CrossRef CAS.
- S. Badoga, A. Ganesan, A. K. Dalai and S. Chand, Catal. Today, 2017, 291, 160–171 CrossRef CAS.
- A. Hart, G. Leeke, M. Greaves and J. Wood, Fuel, 2014, 119, 226–235 CrossRef CAS.
- M. Ramos, D. Ferrer, E. Martinez-Soto, H. Lopez-Lippmann, B. Torres, G. Berhault and R. R. Chianelli, Ultramicroscopy, 2013, 127, 64–69 CrossRef CAS.
- A. Hart, A. Shah, G. Leeke, M. Greaves and J. Wood, Ind. Eng. Chem. Res., 2013, 52, 15394–15406 CrossRef CAS.
- R. P. F. A. Shah, G. A. Leek, J. Wood, S. P. Rigby and M. Greaves, J. Can. Pet. Technol., 2011, 50(11/12) DOI:10.2118/136870-pa.
| This journal is © The Royal Society of Chemistry 2020 |

