 Open Access Article
The stability of disperse red/reactive-red dye inks
Runshan Chu,
Yue Zhang,
Tieling Xing and
Guoqing Chen
 *
*
National Engineering Laboratory for Modern Silk, College of Textile and Clothing Engineering, Soochow University, 199 Renai Road, Suzhou 215123, Jiangsu, China. E-mail: xingtieling@suda.edu.cn; chenguoqiang66688@163.com; chenguojiang@suda.edu.cn; churunshan@163.com; y1035327037@163.com
First published on 24th November 2020
Abstract
CI disperse red 896 was used as a representative disperse red dye to investigate the stability of inkjet printing colour paste. Various additives were added to the dye in different mass fractions to study the thermal stability and freeze–thaw stability of the ink in terms of average particle size, viscosity, and surface tension. The centrifugal stability of the colour paste and ink was characterised by their specific absorbance. When grinding the colour paste, use of a defoamer can improve the grinding efficiency, without affecting the stability of the paste. The most stable ink prepared from the colour paste contained 20–35 wt% paste. Ethylene glycol and glycerol were combined and their amounts controlled respectively at 6–14 wt%. The triethanolamine content was <1 wt% when the fatty alcohol polyoxyethylene ether content was 0.2 wt%. The sodium dodecyl sulphate content should be less than 0.15 wt%, and that of polyvinylpyrrolidone-K30 should be <0.7 wt%.
1. Introduction
Since digital inkjet printing was introduced for textile printing in the 1990s, there have been significant advancements in printing technology. Inkjet printing inks are the main consumables for digital inkjet printing production. Hence, the development of inkjet printing inks has become essential to the development of inkjet printing technology, and is also a research hotspot in the field of fine chemicals for textiles.1 It is well known that the stability and suitability of printing inks for digital inkjet applications can be evaluated by monitoring the particle size, viscosity, surface tension, pH, and conductivity over a period of time.2The dispersion stability of the dye in the ink is an important factor in performance, because it directly affects the particle size, viscosity, and surface tension. During application, the ink with poor stability is likely to block the printing nozzle, degrade printing accuracy, and outline definition. Many methods have been used by researchers to increase the stability of dye dispersions and reduce the particle size, such as spray and drying methods,3 emulsion or mini-emulsion polymerisation,4 interfacial polymerisation,5,6 and direct dispersion with the aid of dispersants.7
The dispersion stability is measured in a process wherein the primary particles or smaller agglomerates are under the action of electrostatic repulsion and steric hindrance to shield the van der Waals forces, such that the particles cannot agglomerate.8 Dispersion stability is discussed with respect to the following three theories.
(1) DLVO theory
DLVO theory, proposed by Darjiguin and Landan in 1941 and Verwey and Overbeek in 1948, describes the relationship between the distance and the force between colloidal particles. The van der Waals forces and electric double layer (EDL) repulsion between colloidal particles can occur simultaneously. When the attractive van der Waals force between the colloidal particles is dominant, the colloidal particles agglomerate. When the repulsive force between the colloidal particles is dominant, the colloidal particles can overcome the van der Waals forces and avoid collision with other colloidal particles due to Brownian motion. Such collisions reduce the occurrence of agglomeration to a certain extent, and stabilise the colloidal particles. The total potential energy in the suspension is equal to the sum of the potential energies arising from the van der Waals and charge repulsion forces.9,10In this study, during the dispersion and stabilisation of disperse dye particles in a colour paste, the anionic dispersant MF (naphthalenesulfonic acid, polymer with formaldehyde, sodium salt) was selected, and the anionic surfactant (SDS) and non-ionic surfactant (FAPE) were used in the preparation of the ink to reduce the surface Gibbs free energy of the dye particles to ensure that they are uniformly and stably dispersed in the suspension for a long period of time.
(2) Electric double layer theory
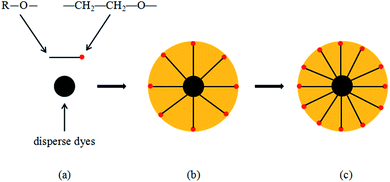
Gouy and Chapman proposed a point charge model. They believe that there are counterions around the point charge. While the counter ions are attracted by the point charge, they are also subjected to thermal diffusion, which will lead to the counterions near the point charge. The concentration is greater because when the distance between the counterions and the point charge increases, the attractive force decreases, resulting in counterions forming diffusion layers of different concentrations. Stern proposed the theory that the EDL is divided into two parts. One part is near the surface, and the other is located approximately 1–2 molecular thicknesses from the charge. The counterions have a greater binding force with the surface of the particle, forming a charge adsorption layer of a certain thickness, also called the Stern layer, which forms a diffusion EDL together with the counterions.11,12In this study, while grinding the colour paste, the anionic dispersant MF (naphthalenesulfonic acid, polymer with formaldehyde, sodium salt) was selected. The dispersant ionises a certain number of anionic groups in water and adsorbs on the surface of the disperse dye particles, which are called particle surface ions. The counterions present in the ink system and particles on the surface of the dye particles, are adsorbed by electrostatic attraction. Due to this surface adsorption, the counterions and particles on the surface of the dye particles are inseparable, and the remaining counterions form a diffusion layer on the surface of the particles, as shown by Fig. 1(b) and (c). The surface ions and counterions of the disperse dye particles form a complete diffusion EDL, which plays a role in the stability of the disperse dye particles in the system.
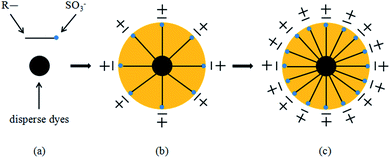 | ||
| Fig. 1 Formation of the electric double layer. (a) is disperse dyes and dispersant MF, R– is hydrophobic group, SO3− is hydrophilic group. (b) and (c) are formation of the electric double layer. | ||
(3) Stability theory of steric hindrance
This theory states that when the surface of solid particles adsorbs long polymer chains, the polymers prevent agglomeration of the particles. When these particles approach each other, the molecular chains become entangled and changes in the configuration occur, resulting in a decrease in the entropy (increase in the Gibbs free energy) between the particles, which enhances repulsion. To effectively prevent particle agglomeration, when the particles (with the adsorbed polymer chains) approach each other, the overlapping molecular chains generate a certain amount of osmotic pressure that prevents the particles from getting closer, which effectively hinders agglomeration between the particles.13,14In this study, a non-ionic surfactant was used, which has a long molecular chain. An adsorption layer with a certain thickness is formed on the surface of the disperse dye particles, where the hydrophilic (–CH2–CH2–O–) end of the long molecular chain extends into the water, as shown by Fig. 2(b) and (c). When the disperse dye particles approach each other, the long molecular chains from different particles overlap and form a three-dimensional network, which effectively prevents agglomeration of the dye particles and increases the stability of the ink system.
Herein we discuss the stability of the colour paste as a function of the content of various ingredients, such as the colour paste, ethylene glycol, glycerol, polyvinylpyrrolidone-K30, triethanolamine, and surfactant. A control variable method was used, where only one of these variables was changed at a time. The aforementioned theories were used to guide this investigation of the ink stability and discuss the effects of the use of different additives to prepare an ink with good stability.
2. Experimental procedure
2.1 Materials
CI reactive red 218 and CI disperse red 896 were purchased from Shanghai Annoqi Digital Technology Co., Ltd. Dispersant MF was purchased from Uso Sample Co., Ltd. Defoamer KYC-750 Keywin Chemical Co., Ltd. Ethylene glycol, glycerol and triethanolamine were purchased from Sinopharm Chemical Reagent Co., Ltd. Polyvinylpyrrolidone-K30 (PVP-K30) was purchased from Meilun Bio Co., Ltd. Fatty alcohol polyoxyethylene ether (FAPE) and sodium dodecyl sulfate (SDS) were purchased from Shanghai Aladdin Biochemical Technology Co., Ltd. All reagents used were of analytical grade and were used without further purification.2.2 Preparation of color paste
Weigh a certain amount of disperse red dye, dispersant MF, defoamer KYC-750 and deionized water, mix them in a beaker, and stir through a magnetic stirring table. After stirring evenly, add zirconia beads, grind with a planetary ball mill (Nanjing Chishun Technology Development Co., Ltd.) at a speed of 599 rpm, take out a small amount of samples every 2 h, and test the average particle size of the samples. When the average particle size of the color paste reaches a certain specification, the sample is taken out and filtered through qualitative filter paper to obtain the dye color paste.2.3 Preparation of disperse red/reactive red dye ink
Mix the prepared disperse red dye color paste with reactive red dyes, viscosity modifiers, surface tension modifiers, pH modifiers, water-soluble polymers and deionized water. After stirring evenly, filter with 0.8 μm, 0.45 μm and 0.2 μm filters in sequence to obtain inkjet printing disperse red/reactive red dye ink.2.4 Instrumentation and characterizations
The average particle size and the zeta potential were tested by the nanometer particle size potential analyzer (Zetasizer Nano ZS90 Malvern) at 25 °C. The viscosity were tested by rotational viscometer (Rheolab QC Anton Paar China Co., Ltd., Austria) at 20 °C. The surface tension were tested by surface tension meter (Dataphysics, Germany) at 20 °C. The ink were observed by transmission electron microscope (JEOL JEM 2100 Plus). According to the light industry standard of the People's Republic of China which QB/T 4973.1-2016 inkjet ink for textile printing. Part 1: reactive dye ink and QB/T 4973.2-2016 inkjet ink for textile printing. Part 2: disperse dye ink test ink stability.(1) Freeze–thaw stability test: take 100 mL sample and seal it in a sample bottle, put the sample to be tested in the refrigerator and set the temperature to −20 °C, take out the sample after 24 h, and test its average particle size, viscosity and surface tension after the sample returns to room temperature.
(2) Thermal stability test: take 100 mL sample and seal it in a sample bottle, put the sample to be tested into the oven and set the temperature to 60 °C, take out the sample after 14 days, and test its average particle size, viscosity and surface tension after the sample returns to room temperature.
(3) Centrifugal stability test: take 30 mL sample and seal it in a centrifuge tube, and centrifuge for 30 min under the condition of 3000 rpm with a centrifuge. Take 30 μL of the sample from the upper layer of the centrifuge tube, dilute it by a certain multiple, and measure the absorbance at the maximum absorption wavelength as A1; take 30 μL of the uncentrifuged sample, dilute the same multiple, and measure the absorbance at the maximum absorption wavelength as A. Characterized by specific absorbance R.
 | (1) |
Use the dispersion parameter Dp (nm−1) to characterize the dispersion performance of the dispersion system:
| Dp = (SMDSpan)−1 | (2) |
(5) Use the stability parameter S to characterize the dispersion stability of the color paste:
 | (3) |
 is the dispersion parameter after baking at 60 °C for 48 hours.
(6) The sedimentation velocity of particles in the dispersion system is characterized by the Stokes sedimentation formula:
 | (4) |
3. Results and discussion
3.1 Colour paste stability
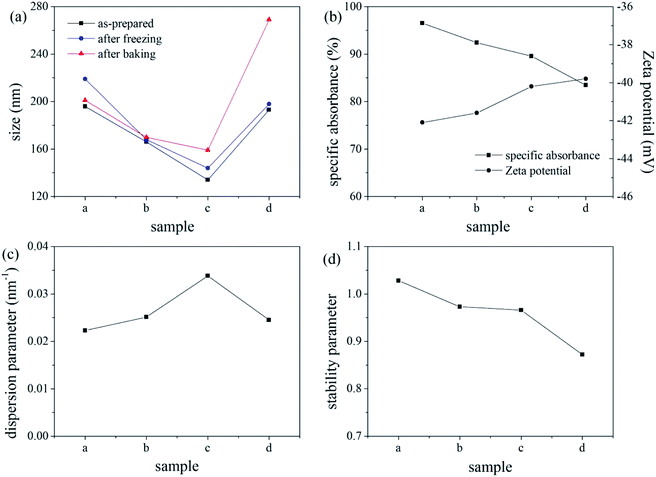
Four different colour pastes were prepared according to the formulations shown in Table 1. The colour pastes were processed using the same grinding conditions to investigate the thermal stability, freeze–thaw stability, and centrifugal stability of the pastes. The results are shown in Fig. 3. As evident from the data in Fig. 3(a), all pastes had good thermal stability, while paste d had poor freeze–thaw stability. The increase in particle size indicates that the disperse dye has agglomerated, particle size exceeding 200 nm is unacceptable. Fig. 3(b) shows that the specific absorbance values of all pastes were above 80%, indicating good centrifugal stability. Fig. 3(c) shows that the dispersibility of the colour pastes with different formulations followed this order: paste c > b > d > a, where larger dispersion parameters imply that the dye is more easily dispersed in the system during grinding.15 The stability parameters in Fig. 3(d) were close to 1 for pastes a, b, and c, while that of paste d was marginally smaller and therefore, less stable. Considering the stability and grinding efficiency, paste b was selected to be used for ink production in this study.| Colour paste | a | b | c | d |
|---|---|---|---|---|
| Disperse red (wt%) | 10 | 10 | 10 | 10 |
| Reactive red (wt%) | — | — | 5 | 5 |
| Dispersant MF (wt%) | 12.5 | 12.5 | 12.5 | 12.5 |
| Defoamer KYC-750 (wt%) | — | 0.5 | 0.5 | — |
| Deionized water (wt%) | 77.5 | 77 | 72 | 72.5 |
MF is an anionic dispersant. This dispersant is adsorbed on the surface of all the disperse dye particles, introducing an electrostatic negative charge that results in a repulsive force between the particles. This prevents agglomeration and improves the dispersibility of the disperse dye in the paste.16 In a certain concentration range, the dispersant forms a dense adsorption layer on the surface of the dye, which enhances further dispersion. With increasing dispersant concentration (i.e., more anionic groups), the dispersant will infiltrate the adsorption layer because of the existence of electrostatic repulsion stabilisation, thereby making it denser. This results in an increase in the charge of the disperse dye particles, and a corresponding increase in their zeta potential.
3.2 Ink stability
| Ink | Colour paste (wt%) | Reactive red (wt%) | Ethylene glycol (wt%) | Glycerol (wt%) | FAPE (wt%) | SDS (wt%) | Triethanolamine (wt%) | PVP-K30 (wt%) |
|---|---|---|---|---|---|---|---|---|
| 1 | 15–35 | 1.25 | 10 | 12 | 0.2 | 0.1 | 0.2 | — |
| 2 | 25 | 1.25 | 6–22 | — | 0.2 | 0.1 | 0.2 | — |
| 3 | 25 | 1.25 | — | 6–22 | 0.2 | 0.1 | 0.2 | — |
| 4 | 25 | 1.25 | 10 | 4–20 | 0.2 | 0.1 | 0.2 | — |
| 5 | 25 | 1.25 | 10 | 12 | 0.2 | 0.1 | 0.2 | 0–1.5 |
| 6 | 25 | 1.25 | 10 | 12 | 0.2 | 0.1 | 0–2 | — |
| 7 | 25 | 1.25 | 10 | 12 | 0–0.5 | — | 0.2 | — |
| 8 | 25 | 1.25 | 10 | 12 | — | 0–0.2 | 0.2 | — |
| 9 | 25 | 1.25 | 10 | 12 | 0.2 | 0–0.2 | 0.2 | — |
| 10 | 25 | 1.25 | 10 | 12 | 0.2 | 0.1 | 0.2 | 1.2 |
| 11 | 25 | 1.25 | 10 | 12 | 0.2 | 0.1 | 0.2 | — |
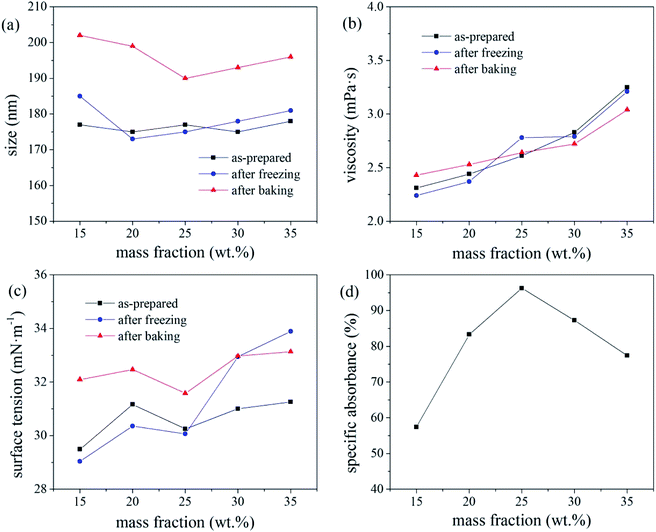
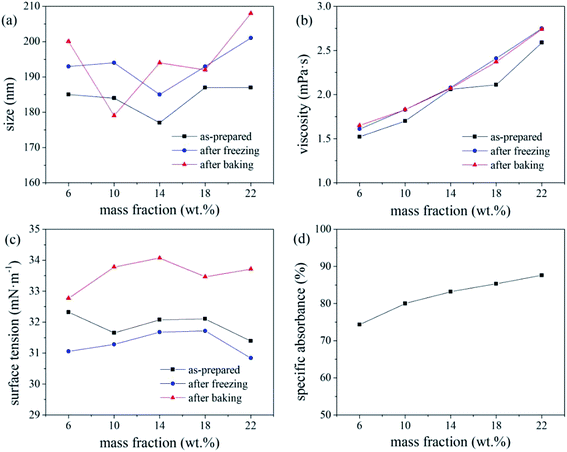
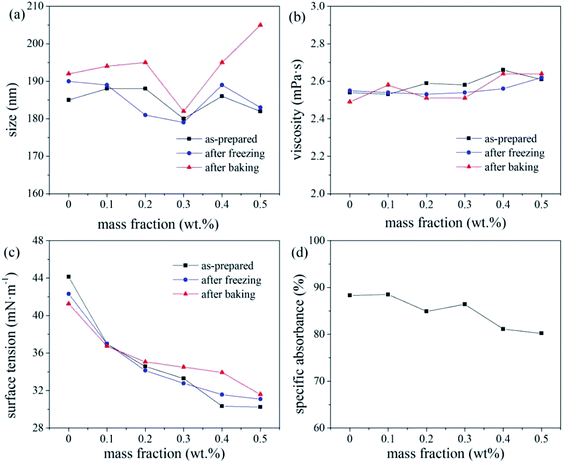
The overall ink stability is considered optimal for colour paste fractions of 20–35 wt%. As the number of disperse dye particles in the ink increases, their Brownian motion intensifies under high-temperature conditions, resulting in an increase in the probability of the dye particles colliding with each other, resulting in a deterioration of the thermal stability of the ink. The deterioration in the freeze–thaw stability of the ink with increasing colour paste fraction (i.e., number of disperse dye particles in the ink system), was attributed to the crystal particles generated by water molecules at low temperature applying pressure to the EDL of the dye particles, thereby greatly increasing the probability of collisions and agglomeration.
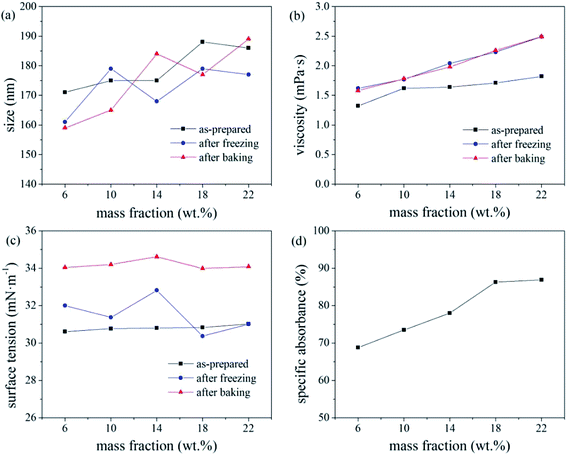
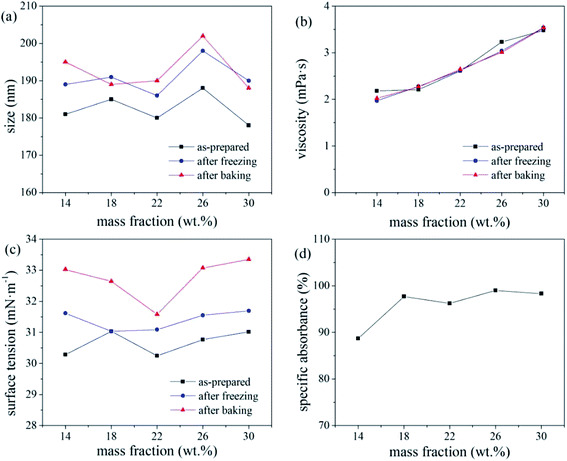
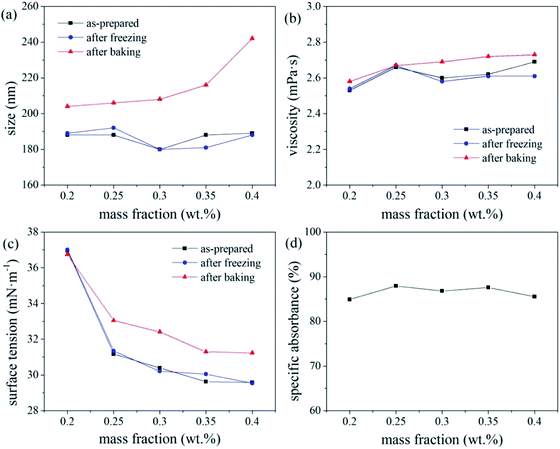
The freeze–thaw stability of inks generally increases with increasing mass fraction of water-soluble alcohol and tends to be stable for values exceeding 20%. With increasing alcohol content in the ink, a greater number of hydroxyl groups are present to bind water molecules, leaving less water to crystallise under −20 °C, which increases the freeze–thaw stability of the ink.17 Under the test condition of −20 °C, molecular movement is greatly limited, which increased the viscosity of the ink. According to the Stokes sedimentation equation, if the ink viscosity increases while all other conditions remain unchanged, the sedimentation speed of the dye particles in the ink decreases, and its freeze–thaw stability increases.
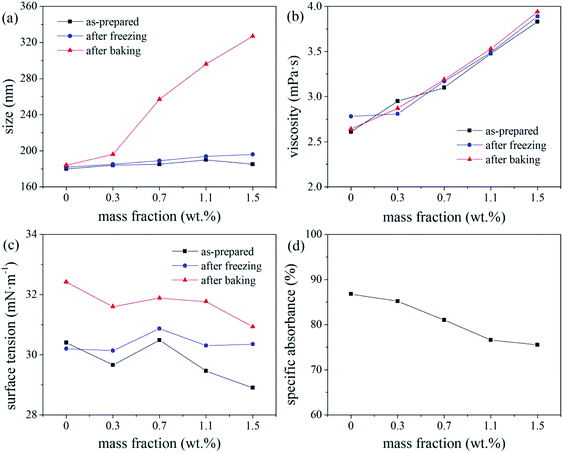
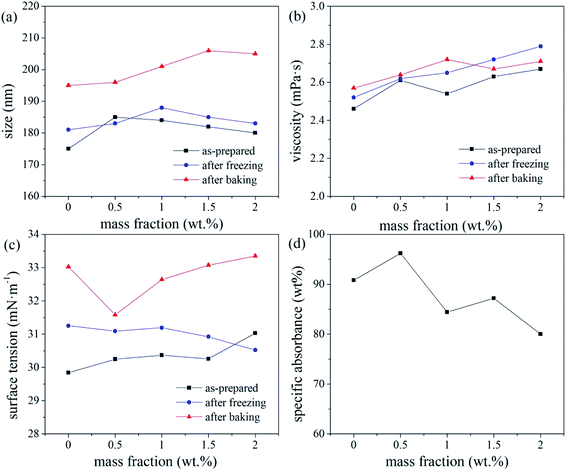
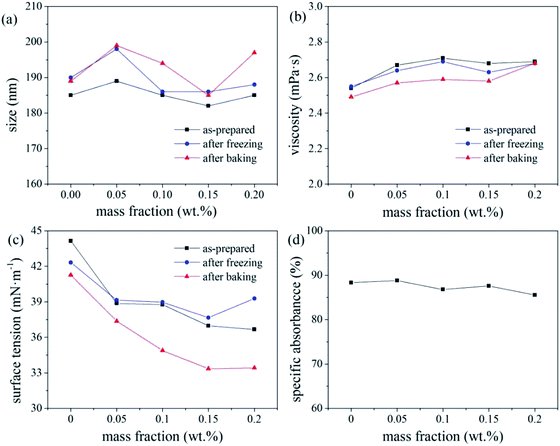
Based on the absorbance data shown in part (d) of Fig. 5, 6 and 7, the centrifugal stability of the ink increased with increasing ethylene glycol and glycerol concentrations. As the mass fraction of ethylene glycol and glycerol increased, the viscosity of the ink also increased, resulting in higher centrifugal stability of the ink due to the lower sedimentation speed of the dye particles.18 Considering the ink stability data shown in Fig. 6–8, use of a mixture of glycerol and ethylene glycol is better than using either compound alone. We recommend glycerol and ethylene glycol contents of 6–14 wt%.
According to a related study,19 when the SDS mass fraction exceeds a critical limit, the SDS-bound micelles interact with the PVP molecular chains via the sodium ion bridge to form a PVP–SDS “pseudopolyanion” and PVP–SDS associates. A higher degree of specific clustering of PVP–SDS results in a stronger polyelectrolyte of PVP–SDS pseudopolyanions, which was likely the reason for the decrease in ink stability with increasing PVP-K30 content. Hence, we recommend that the PVP-K30 content in the ink should be less than 0.7 wt%.
The pH of the inks with triethanolamine contents of 0, 0.5, 1, 1.5, and 2 wt% were 6.4, 8.84, 9.09, 9.23, and 9.34, respectively. A pH of 8–9, i.e., a mass fraction of triethanolamine <1%, produced a relatively stable ink. This is because changes in the pH of the ink system affect the zeta potential of the ink. If the pH of the ink is too high, the EDL on the surface of the disperse dye particles will be compressed by the excessive free charge in the ink,20 which reduces the electrostatic repulsion charge on the surface of the dye particles and reduces the zeta potential (and hence, stability) of the ink. In this study, the ink pH (8–9) resulted in sufficient surface charge (and hence, EDL thickness) of the disperse dye particles, resulting in the maximum zeta potential and stability of the ink system. Therefore, triethanolamine contents <1 wt% are recommended to ensure that the ink pH is 8–9.
Overall, the thermal stability of the ink systems with FAPE-containing links was poor. Since FAPE contains multiple polyoxyethylene chains, the disperse dyes will be solubilised in the oxyethylene chain. Hence, a higher FAPE content enhances the solubilisation effect. Thus, after heating to test the various physical properties of the ink, the dye will crystallise when returning to room temperature, resulting in a larger average particle size (indicating poor thermal stability).17 Therefore, when 0.2 wt% FAPE and SDS are compounded, the SDS content should be less than 0.15 wt% to ensure good ink stability.
4. Conclusions
Through the discussion of the ink average particle size, viscosity, and surface tension stability, the range of different additives added was selected to prepare ink with good stability. When grinding the colour paste, a defoamer was used to improve the grinding efficiency without affecting the stability of the paste. Reactive dyes were used to improve the grinding efficiency, but made the colour paste stability worse. The optimal ink stability was observed for the following formulation: 20–35 wt% colour paste, 6–14 wt% ethylene glycol and glycerol, respectively, <1 wt% triethanolamine, 0.2 wt% FAPE was, <0.15 wt% SDS, and <0.7 wt% PVP-K30.In industrial applications, the ink with good stability can be stored for a long time, and the storage environment has little effect on the physical properties of the ink. When the ink is used, it has better jetting performance and does not tend to block the nozzle.
Conflicts of interest
The authors declare that they have no known competing financial interests or personal relationships that could have appeared to influence the work reported in this paper.Acknowledgements
The authors would like to express sincere thanks to the National Key R&D Program of China (2017YFB0309800), Key R&D Plan of Jiangsu Province (BE2019001-3, BE2019001-4) for financial support.References
- K. J. Fang, Dyeing Finish., 2006, 18, 40–43 Search PubMed.
- K. Evangelos, N. Nikolaos and T. Eforia, Fibers Polym., 2016, 17, 248–256 CrossRef.
- S. H. Fu and K. J. Fang, J. Appl. Polym. Sci., 2007, 105, 317–321 CrossRef CAS.
- T. H. Kim, Y. S. Ko and Y. K. Kwon, J. Nanosci. Nanotechnol., 2006, 6, 3450–3454 CrossRef CAS.
- C. T. Kosolia and E. G. Tsatsaroni, J. Appl. Polym. Sci., 2010, 116, 1422–1427 CAS.
- J. J. Lee, W. J. Lee and J. H. Choi, et al., Dyes Pigm., 2005, 65, 75–81 CrossRef CAS.
- S. H. Fu, G. F. Zhang and C. S. Du, et al., J. Appl. Polym. Sci., 2011, 121, 1616–1621 CrossRef CAS.
- W. Y. Ma, Q. Tian and M. S. Cao, et al., China Powder Sci. Technol., 2002, 8, 28–31 CAS.
- Z. Adamczyk and P. Weronski, Adv. Colloid Interface Sci., 1999, 83, 137–226 CrossRef CAS.
- S. Shukla, S. Bhattacharjee and A. Z. Weber, et al., J. Electrochem. Soc., 2017, 164, F600–F609 CrossRef CAS.
- F. Beguin, V. Presser and A. Balducci, et al., Adv. Mater., 2014, 26, 2219–2251 CrossRef CAS.
- K. D. Danov, P. A. Kralchevsky and S. D. Stoyanov, et al., J. Colloid Interface Sci., 2020, 581, 262–275 CrossRef.
- S. C. Lin, C. J. Shih and M. S. Strano, et al., J. Am. Chem. Soc., 2011, 133, 12810–12823 CrossRef CAS.
- S. J. Yu, M. H. Shen and S. S. Li, et al., Environ. Pollut., 2019, 255 Search PubMed.
- L. Zhang, G. H. Que and W. A. Deng, J. Fuel Chem. Technol., 2009, 37, 189–193 CAS.
- I. S. Tyukova, A. P. Safronov and A. P. Kotel'nikova, et al., Polym. Sci., 2014, 56, 498–504 CAS.
- G. F. Zhang, S. H. Fu and A. L. Tian, et al., J. Text. Res., 2012, 33, 48–52 CrossRef CAS.
- G. J. Bu and C. X. Wang, Fine Chem., 2011, 28, 505–509 CAS.
- Y. F. Wu, L. S. Xi and Y. Fang, et al., China Surfactant Deterg. Cosmet., 2017, 47, 361–364 Search PubMed.
- Q. Q. Tan, Z. T. Zhang and Z. L. Tang, et al., Mater. Lett., 2003, 57, 2375–2381 CrossRef CAS.
| This journal is © The Royal Society of Chemistry 2020 |

