
 Open Access Article
 This Open Access Article is licensed under a Creative Commons Attribution-Non Commercial 3.0 Unported Licence
A KBr-impregnated paper substrate as a sample probe for the enhanced ATR-FTIR signal strength of anionic and non-ionic surfactants in an aqueous medium†
Ramsingh Kurrey*a,
Manas Kanti Deb *a,
Kamlesh Shrivasa,
Jayant Nirmalkarb,
Bhupendra Kumar Senc,
Mithlesh Mahilanga and
Vikas Kumar Jaind
*a,
Kamlesh Shrivasa,
Jayant Nirmalkarb,
Bhupendra Kumar Senc,
Mithlesh Mahilanga and
Vikas Kumar Jaind
aSchool of Studies in Chemistry, Pt. Ravishankar Shukla University, Raipur-492 010, Chhattisgarh, India. E-mail: debmanas@yahoo.com; ramsinghkurrey@gmail.com; Tel: +91 9425503750 Tel: +91 8889629675
bKorea Research Institute of Standards and Science, Yuseong, District, Daejeon, South Korea
cDepartment of Chemistry, Govt. D. B. Girls' PG Autonomous College, Raipur-492 001, Chhattisgarh, India
dDepartment of Chemistry, Govt. Engineering College, Raipur-492015, Chhattisgarh, India
First published on 7th November 2020
Abstract
Herein, we report a KBr-impregnated paper substrate as a sample probe to enhance the attenuated total reflection-Fourier transform infrared (ATR-FTIR) signal strength of anionic surfactants (AS) and non-ionic surfactants (NS) in an aqueous solution. The mechanism for the sensing of AS and NS is based on the strong interaction of surfactants with the silicate groups (SiO44−) of the KBr-impregnated paper substrate. The role of SiO44− on the surface of the paper is to enhance the adsorption of AS and NS, resulting in improved IR signal intensities for the target analytes. The improved signal intensity at 1253 cm−1 (SO42−, symmetric stretching) for AS and 1114 cm−1 (C–O–C, stretching vibration) for NS were selected for quantification. SEM-EDX was employed to determine the elemental compositions of pre- and post-adsorbed AS and NS on glass fibre filter paper (GFF). The linear range for the determination of AS and NS was 10–100 μg L−1 with a method detection limit (MDL) of 4 μg L−1 and method quantification limit (MQL) of 12 μg L−1. The good relative recovery of 71.4–109.7% and the interference studies showed the selectivity of the method for the determination of AS and NS in environmental water and commodity samples. The advantages of this method include its cost-effectiveness, enhanced sensitivity, disposability and accessibility of the paper substrate.
Introduction
Surfactants are surface active compounds that reduce the surface tension between two interfaces, and thus used as detergents, foaming agents, dispersants, emulsifiers and wetting agents.1 Surfactants are generally amphiphilic in nature, containing both hydrophobic tail (water-insoluble) and hydrophilic head (water-soluble) groups. Based on their characteristic behavior, these compounds can be classified as anionic, cationic, non-ionic and amphoteric surfactants. Anionic surfactants (AS) are comprised of molecules such as soap (aliphatic carboxylic acid), alkyl sulphates, alkyl sulfonates, and alkyl benzene sulfonates. Non-ionic surfactants contain no charged groups and can be used to separate grease from clothes, such as household cleaners and dish soap.2 Furthermore, mixed surfactant systems often also show synergistic behavior such as low critical micelle concentration (CMC) and surface-interfacial tension, resulting in a reduction in the total amount of surfactant used in a particular application, which consequently reduces both their cost and environmental impact.3 The entry of surfactants into the human body can disrupt the activity of enzymes and normal physiological functions.4 An earlier work reported that the absorption of anionic and non-ionic surfactants such as linear alkyl benzene sulfonate (LABS) and alkylphenol ethoxylate, respectively, through the skin can cause irritation, liver damage and other chronic symptoms.5,6 Therefore, the determination of AS and NS in different water (river water, raw water, and sewage water) and commodity samples is important to prevent the entry of these surfactants into the water supply network.Several spectrophotometric methods using active substances such as methylene blue, disulphine blue, cobalt thiocyanate and bismuth have been reported for the determination of AS and NS in a variety of samples.7,8 These methods are based on the formation of an ion-pair association complex between surfactants and dyes. The ion-pair complex is then extracted with a toxic solvent such as chloroform, benzene and toluene, followed by absorbance measurement spectrophotometrically.9 These methods have several disadvantages including time-consuming separation and pre-concentrations steps, and use of a large amount of toxic solvents and chemical reagents.10 Thus, the development of alternative methods is necessary to overcome the disadvantages of spectrophotometric methods. Other analytical techniques such as the flow-injection method (FIA),11 liquid chromatography-mass spectrometry (LC-MS),12 and high-performance liquid chromatography-mass spectrometry (HPLC)13 have been used for determination of AS and NS in a variety of samples. However, these methods are expensive and require highly pure chemicals, which are unavailable in small laboratories. Accordingly, many research groups are working on the development of alternative methods that are simple, rapid and cost effective for the determination of chemical substances from different types of samples.14,15
Fourier transform infrared (FTIR) spectroscopy is a simple and reliable technique widely used for the analysis of different chemical substances in a variety of samples, as reported by Berthomieu and Hienerwadel.16 FTIR is used for the qualitative identification of functional groups in organic compounds and structural elucidation using a potassium bromide (KBr) matrix or pellet.17–19 Deb's group demonstrated the use of a KBr pellet as a sample holder for the quantitative determination of metal ions and ionic species in various environmental and biological samples.20,21 However, the drawbacks of using the KBr matrix as a sample holder are its hygroscopic nature and the chances of breaking the pellet. It also includes a time-consuming process, use of a relatively large amount of pure KBr reagent and the need for a special hydraulic press machine. In many cases, the preparation of KBr pellets is not homogenous, and drifting of the baseline occurs due to the influence of stray light.22 Thus, there should be alterative approach free from the use of time-consuming sample preparation steps and large amount of KBr reagent. The use of paper substrates in analytical chemistry has attracted considerable attention as a matrix for the development of low-cost analytical devices.23,24 Different types of papers such as lab-on-paper, photo paper, Whatman and Xerox printing paper have been applied in colorimetric, fluorescent and electrochemical determinations due to their outstanding features including low price, suitable porosity, biocompatibility, biodegradability and flexibility.25 The paper substrate-based FTIR spectroscopic method is a novel development using an existing method based on paper substrate technology in analytical laboratories.26 The use of FTIR together with paper substrates is becoming versatile and has intensely increased the quality of IR analyses and spectra since the required time and errors in experimentation are minimized.
In the present work, a KBr-impregnated paper substrate is used as a sample probe for the analysis of surfactants (AS and NS) via ATR-FTIR instead of the conventional KBr matrix. This study revealed qualitative and quantitative information to understand the adsorption of surfactants onto silicate-containing KBr-impregnated paper surface. The characteristic absorption bands at 1253 (SO42− symmetry stretching) for AS and 1114 cm−1 (C–O–C stretching vibration) for NS were observed under the optimized conditions, i.e., number of scans, microzone diameter, temperature and sample volume, for the effective determination of AS and NS. The use of KBr-impregnated paper substrate has the advantages of ease of operation, small sample volume, low cost, flexibility, disposability, and low detection limit for a diverse range of applications. The sensing mechanism for the determination of AS and NS using FTIR coupled with a GFF-based sensor was illustrated and validated. The elemental composition of the paper substrate was determined via energy dispersive X-ray microanalysis (EDX) with scanning electron microscopy (SEM).
Experimental section
Apparatus
The infrared spectra of AS and NS were measured using a Thermo Fisher Scientific FTIR spectrometer (Nicolet iS10, Madison, USA) equipped with a narrow band nitrogen-cooled deuterated, L-alanine doped triglycine sulfate (DLaTGS) detector. All measurements were carried out using attenuated total reflectance (ATR) with a resolution of 4 cm−1 and 15 scans for each sample. The function of ATR is described in the literature.27 The Omnic 9 and TQ analysis software packages (Nicolet iS10) were used for the acquisition and processing of the spectra in the mid-IR range of 4000–400 cm−1. Prior to detection, the ATR crystal was cleaned with acetone/iso-propanol/methanol until the CH2 signal was eliminated. The background spectrum was obtained by transmitting the infrared beam along the ATR crystal, after which the sample spectrum was taken immediately after deposition of the surfactant on the paper substrate. The baselines of the ATR spectra were corrected using a commercial software package called “OMNIC”. The ATR spectra are presented as plots of absorbance as a function of wavenumber. The ATR-FTIR software specification is listed in Table S1.† The surface morphology of the different papers before and after adsorption of AS and NS was observed using a field emission scanning electron microscope (FE-SEM). The elemental compositions were determined using energy dispersive X-ray microanalysis (EDX) with SEM (JEOL JSM-6701F FE-SEM) operating at 15 kV.Reagents, materials and solution preparation
All chemicals used were of analytical grade. Linear alkylbenzene sulfonate (LABS), sodium dodecyl benzene sulfonate (SDBS) and alkylphenol ethoxylate were purchased from Sigma-Aldrich (ACS reagent, ≥99%, MA, USA). Glass microfibre filter paper, Whatman filter paper, chromatography filter paper, and quartz filter paper were purchased from Whatman (International Ltd, Maidstone England) and Xerox printing paper and tissue paper were purchased from a local market. Hydrochloric acid (HCl) and sodium hydroxide (NaOH) were obtained from Sigma-Aldrich (ACS reagent, >97%, MA, USA) and used for maintaining the pH of the sample solution. The Certified Reference Materials (CRM) of the surfactants, WP (sample code: RTC, QCI-244-20 mL), were purchased from Sigma-Aldrich. A saturated solution of KBr was prepared in 5.0 mL water by the slow addition of 0.01 mg portions of KBr in water until the solution reached the point at which it could not dissolve any more solute. The standard solution (10 μg mL−1) of each AS and NS was prepared by dissolving an appropriate amount of substance in ultrapure water (18.2 MΩ). 100 μg L−1 of mixed AS and NS was prepared by taking 0.1 mL of each surfactant (10 μg mL−1) in a glass vial and the total volume of the solution mixture was diluted to 10 mL with ultrapure water.Samples collection for ATR-FTIR analysis
Different types of water samples such as domestic waste, municipal waste and river water were collected in cleaned polyethylene bottles from different sites in Raipur City, India using the reported methodology.1,28 The water samples were filtered through Whatman filter paper (0.45 μm) to prevent the adsorption of the surfactants on the surface of suspended particles. The commodity samples were purchased from a local market in Raipur City, India. Briefly, 1.0 mL of commodity sample was separately added to a volumetric flask and diluted with 50 mL of ultrapure water. An aliquot of 20 μL of each sample was deposited on the test zone of the GFF paper for FTIR analysis.Preparation of KBr-impregnated paper substrate for FTIR analysis
GFF was impregnated with KBr for the determination of AS and NS in environmental and commodity samples. The detailed procedures for the preparation of the KBr-impregnated paper substrates are shown in Fig. S1.† Briefly, circular pieces of GFF with a diameter of 5.0 mm were obtained using punch machine. Over the surface of one of the sides of GFF, white beeswax was stacked. In the next step, the saturated KBr solution was deposited on the other side, i.e., the side that the sample is applied, of GFF. The coating of white beeswax acted as a hydrophobic barrier to prevent the spreading of the solution during the handling of samples in the liquid state. The KBr-impregnated surface was dried upon exposure to open air at room temperature (27 ± 2 °C) in about 5 min. Accordingly, a large number of substrates were prepared simultaneously, which were ready to be used for further analytical procedures. The stability of the device was checked by the analysis of the sample at different intervals (0 min to 7 days) without a change in the results. However, the paper devices should be stored in a dark box before use to prevent the KBr matrix from falling off the surface of the paper substrate. This KBr-impregnated paper substrate was further used as a sample probe for the analysis of AS and NS via FTIR spectroscopy.Procedure for the simultaneous determination of AS and NS using KBr-impregnated paper substrate
Different concentrations of standard solution of 20 μL AS and NS (10 to 100 μgL−1) were deposited on the test region of the KBr-impregnated paper substrate and dried in a hot-air oven at 65 °C. Before acquisition, the background spectrum of the KBr-impregnated GFF paper (blank) was recorded in the range of 4000–400 cm−1 via FTIR spectroscopy. The instrument was purged for 25–30 min with >99.99% analytical grade nitrogen gas (iS10, iZ10 model, Thermo Fisher Scientific) to eliminate possible interferences from the air (CO2) and water (H2O) vapor. The characteristic signals at 1253 cm−1 (SO42− symmetry stretching) for AS and 1114 cm−1 (C–O–C stretching vibration) for NS were used for the quantitative analysis of the surfactants in commodity and environmental water samples. Fig. 1 summarizes the preparation of the KBr-impregnated paper substrate and procedure for the analysis of AS and NS using FTIR. The reflectance spectrum measured by the ATR method was converted into a quantitative spectrum using the Kubelka–Munk (K–M) conversion formula [f(R∞) = (1 − R∞)2/2R∞ = K/S], where R∞ is the total reflectance of the impregnated material on the GFF substrate, KBr, which correlates with the concentration of the sample. K is the molecular extinction coefficient, and S is the scattering coefficient. The two important parameters of peak area and peak height at 1253 and 1114 cm−1 for AS and NS, respectively, obtained over the full concentration range (10–100 μg L−1) were plotted against the respective absorbance values using the Omnic 9 version TQ analyst software (Thermo Fisher Scientific, Madison, USA). The calibration curve is described by the equation y = a + bx, where y represents the peak area or peak height and x represents the concentration of AS and NS.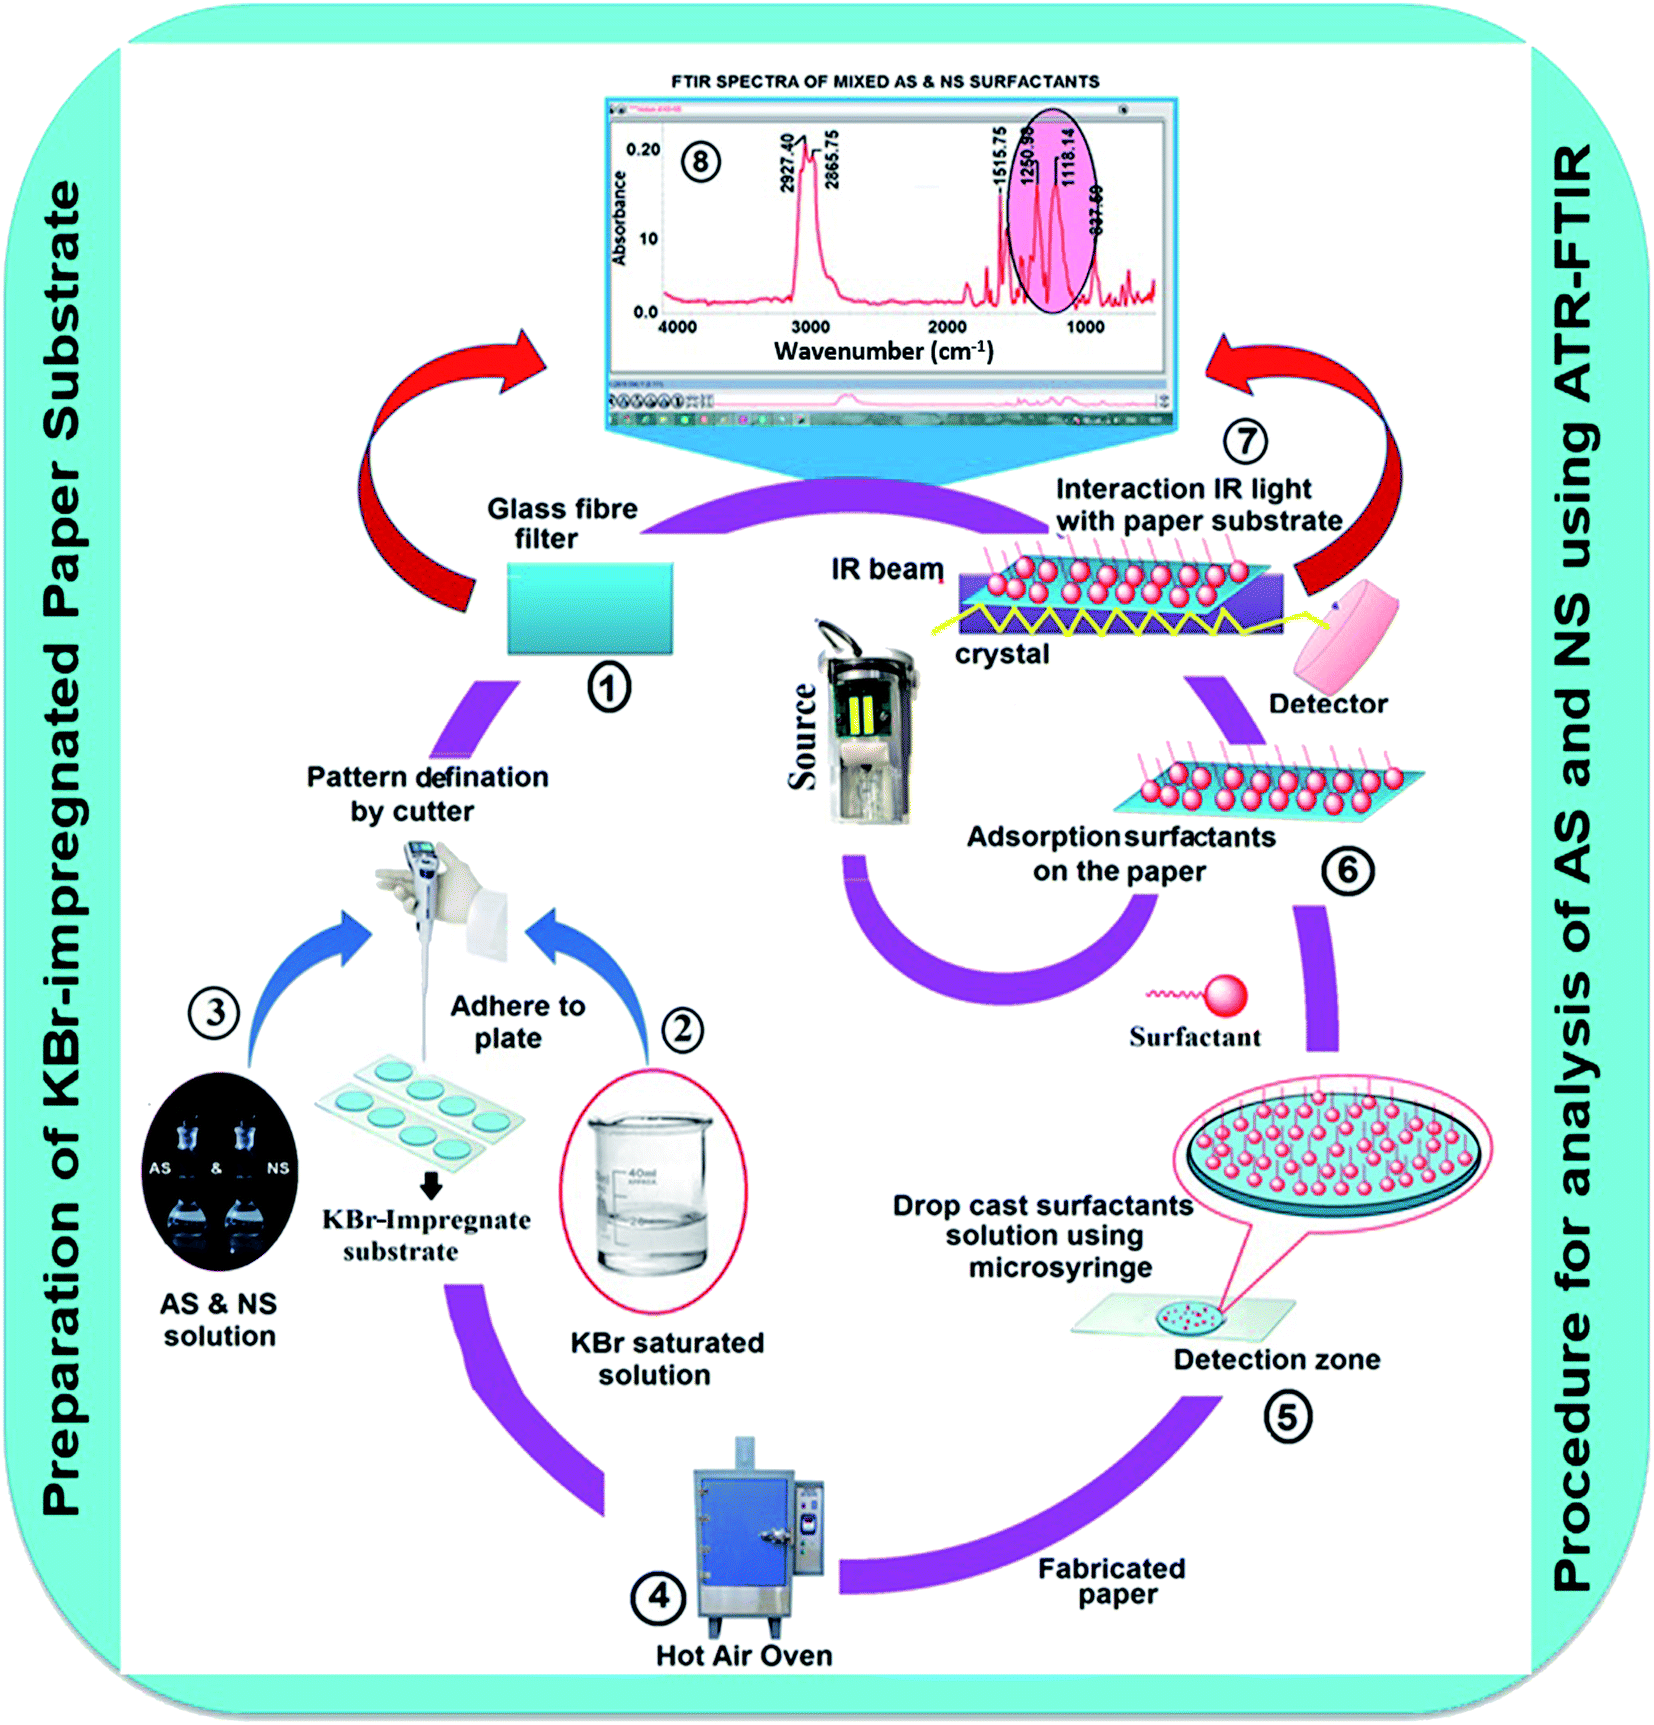 | ||
| Fig. 1 Flow diagram of the procedures for the analysis of surfactants using modified GFF as a paper substrate (CAS,NS (100 μg L−1) = 20 μL; paper diameter = 5 mm; number of scans = 15; and temperature = 65 °C for 2 min). | ||
Results and discussion
Spectral screening of surfactants using KBr-impregnated paper substrate: assignment of infrared peaks
FTIR spectroscopy is a powerful, rapid and non-destructive technique that can detect analytes at a low concentration by considering the molecular vibrational bands in the mid-infrared region.29–31 FTIR minimizes the required time to obtain a spectrum to within a few seconds and the data acquired can be stored and manipulated. Here, a KBr-impregnated paper substrate was used as a sample probe for the analysis of model compounds such as LABS and SDBS for AS and Triton-X-100 for NS for analysis via FTIR spectroscopy. Fig. 2a–d show the direct FTIR analysis of LABS, SDBS, Triton X-100 and mixed AS and NS without the use of the KBr-impregnated paper substrate as the sample probe, and the results are shown in Table S2.† Fig. 2e and f present the FTIR spectra of LABS and SDBS after the deposition of these surfactants on the KBr-impregnated paper substrate. The characteristic absorption peaks were observed at 1214 and 1226 cm−1 (due to the corresponding SO42− symmetric stretching) for LABS and SDBS, respectively. In addition, the peaks located at 2919 cm−1 and 2853 cm−1 are assigned to the asymmetric stretching and symmetric stretching, respectively, of the alkyl groups in the hydrocarbon chain. The absorption bands at 1616 to 1500 cm−1 and 1466–1400 cm−1 are assigned to the CH2 bending vibration and wagging vibration, respectively.32–34 Fig. 2g shows the FTIR spectrum of Triton X-100 when the impregnated paper substrate was employed as the sample probe. Prominent peaks were observed in the range of 1150–1050 cm−1, corresponding to the stretching vibration of the C–O–C group, which were used to monitor the NS in the sample solution. Strong and sharp absorption bands were observed at around 1457 cm−1 and 1519 cm−1 for the CH2 wagging vibration and Ar-O–CH2 vibration, respectively (Fig. 2g and Table S2†). Two additional weak absorptions bands were also observed at 2954 and 2981 cm−1 for the C–H symmetric stretching, and a small band at about 1361 cm−1 for the C![[double bond, length as m-dash]](https://www.rsc.org/images/entities/char_e001.gif) C ring stretching. AS and NS with the same concentration were mixed in the same volume ratio to observe the characteristic absorption bands in almost the same region of the pure compounds using the KBr-impregnated paper substrate, and the results are displayed in Fig. 2h.
C ring stretching. AS and NS with the same concentration were mixed in the same volume ratio to observe the characteristic absorption bands in almost the same region of the pure compounds using the KBr-impregnated paper substrate, and the results are displayed in Fig. 2h.
 | ||
| Fig. 2 Preliminary spectral analysis of LABS (a and e), SDBS (b and f), alkylphenol ethoxylate (Triton X-100) (c and g) and mixed AS and NS (d and h) without and with the KBr-impregnated paper substrate (CAS,NS (100 μg L−1) = 20 μL; paper diameter = 5 mm; number of scans = 15; and temperature = 65 °C for 2 min). | ||
Physicochemical mechanisms for the determination of AS and NS using KBr-impregnated paper substrate in ATR-FTIR
The selection of the paper substrate is important for the development of paper-based sensors towards the determination of chemical substances from different types of samples. Thus, GFF paper, Whatman filter paper, quartz filter paper, Xerox printing paper, tissue paper and normal filter paper impregnated with KBr were tested for the analysis of AS and NS via FTIR spectroscopy. The lowest background and high signal intensity of the target analytes were obtained with the GFF paper. Thus, the KBr-impregnated paper substrate-based FTIR spectroscopic method was found to be a possible alternative to the KBr substrate/pellet method in analytical laboratories for the determination of AS and NS. The quartz filter paper, xerox printing paper, tissue paper and normal filter paper were found to be unsuitable since the very large pore size on their surface led to incomplete trapping of the analytes within the fibres of the paper due to rapid spreading of the liquid, resulting in broad spectral interference during the FTIR analysis.35–38 The results are shown in Fig. 3A(a–f). All the paper substrates including GFF possess pores with a diameter of 2–20 μm on their surface, which is an important criterion for the adsorption of analytes, resulting in an enhancement in the signal intensity. The fibre surface of GFF impregnated with the KBr matrix remained in the glass transition state even after drying at a temperature of around 65 °C. The major composition of the modified KBr-impregnated paper was still fine glass fibres.39 Consequently, the prepared KBr-impregnated paper maintained the robust properties of the filter paper substrate. It was found that the KBr-impregnated paper also possessed hydrophobic properties. These properties were confirmed by the results from the SEM images (Fig. 3B(a–f)). Therefore, the GFF paper was selected as a modified substrate for the determination of AS and NS using ATR-FTIR analysis. ATR-FTIR is a very useful analytical tool for improved detection efficiency and enhanced signal intensity of target analytes without the requirement of different sample treatments.40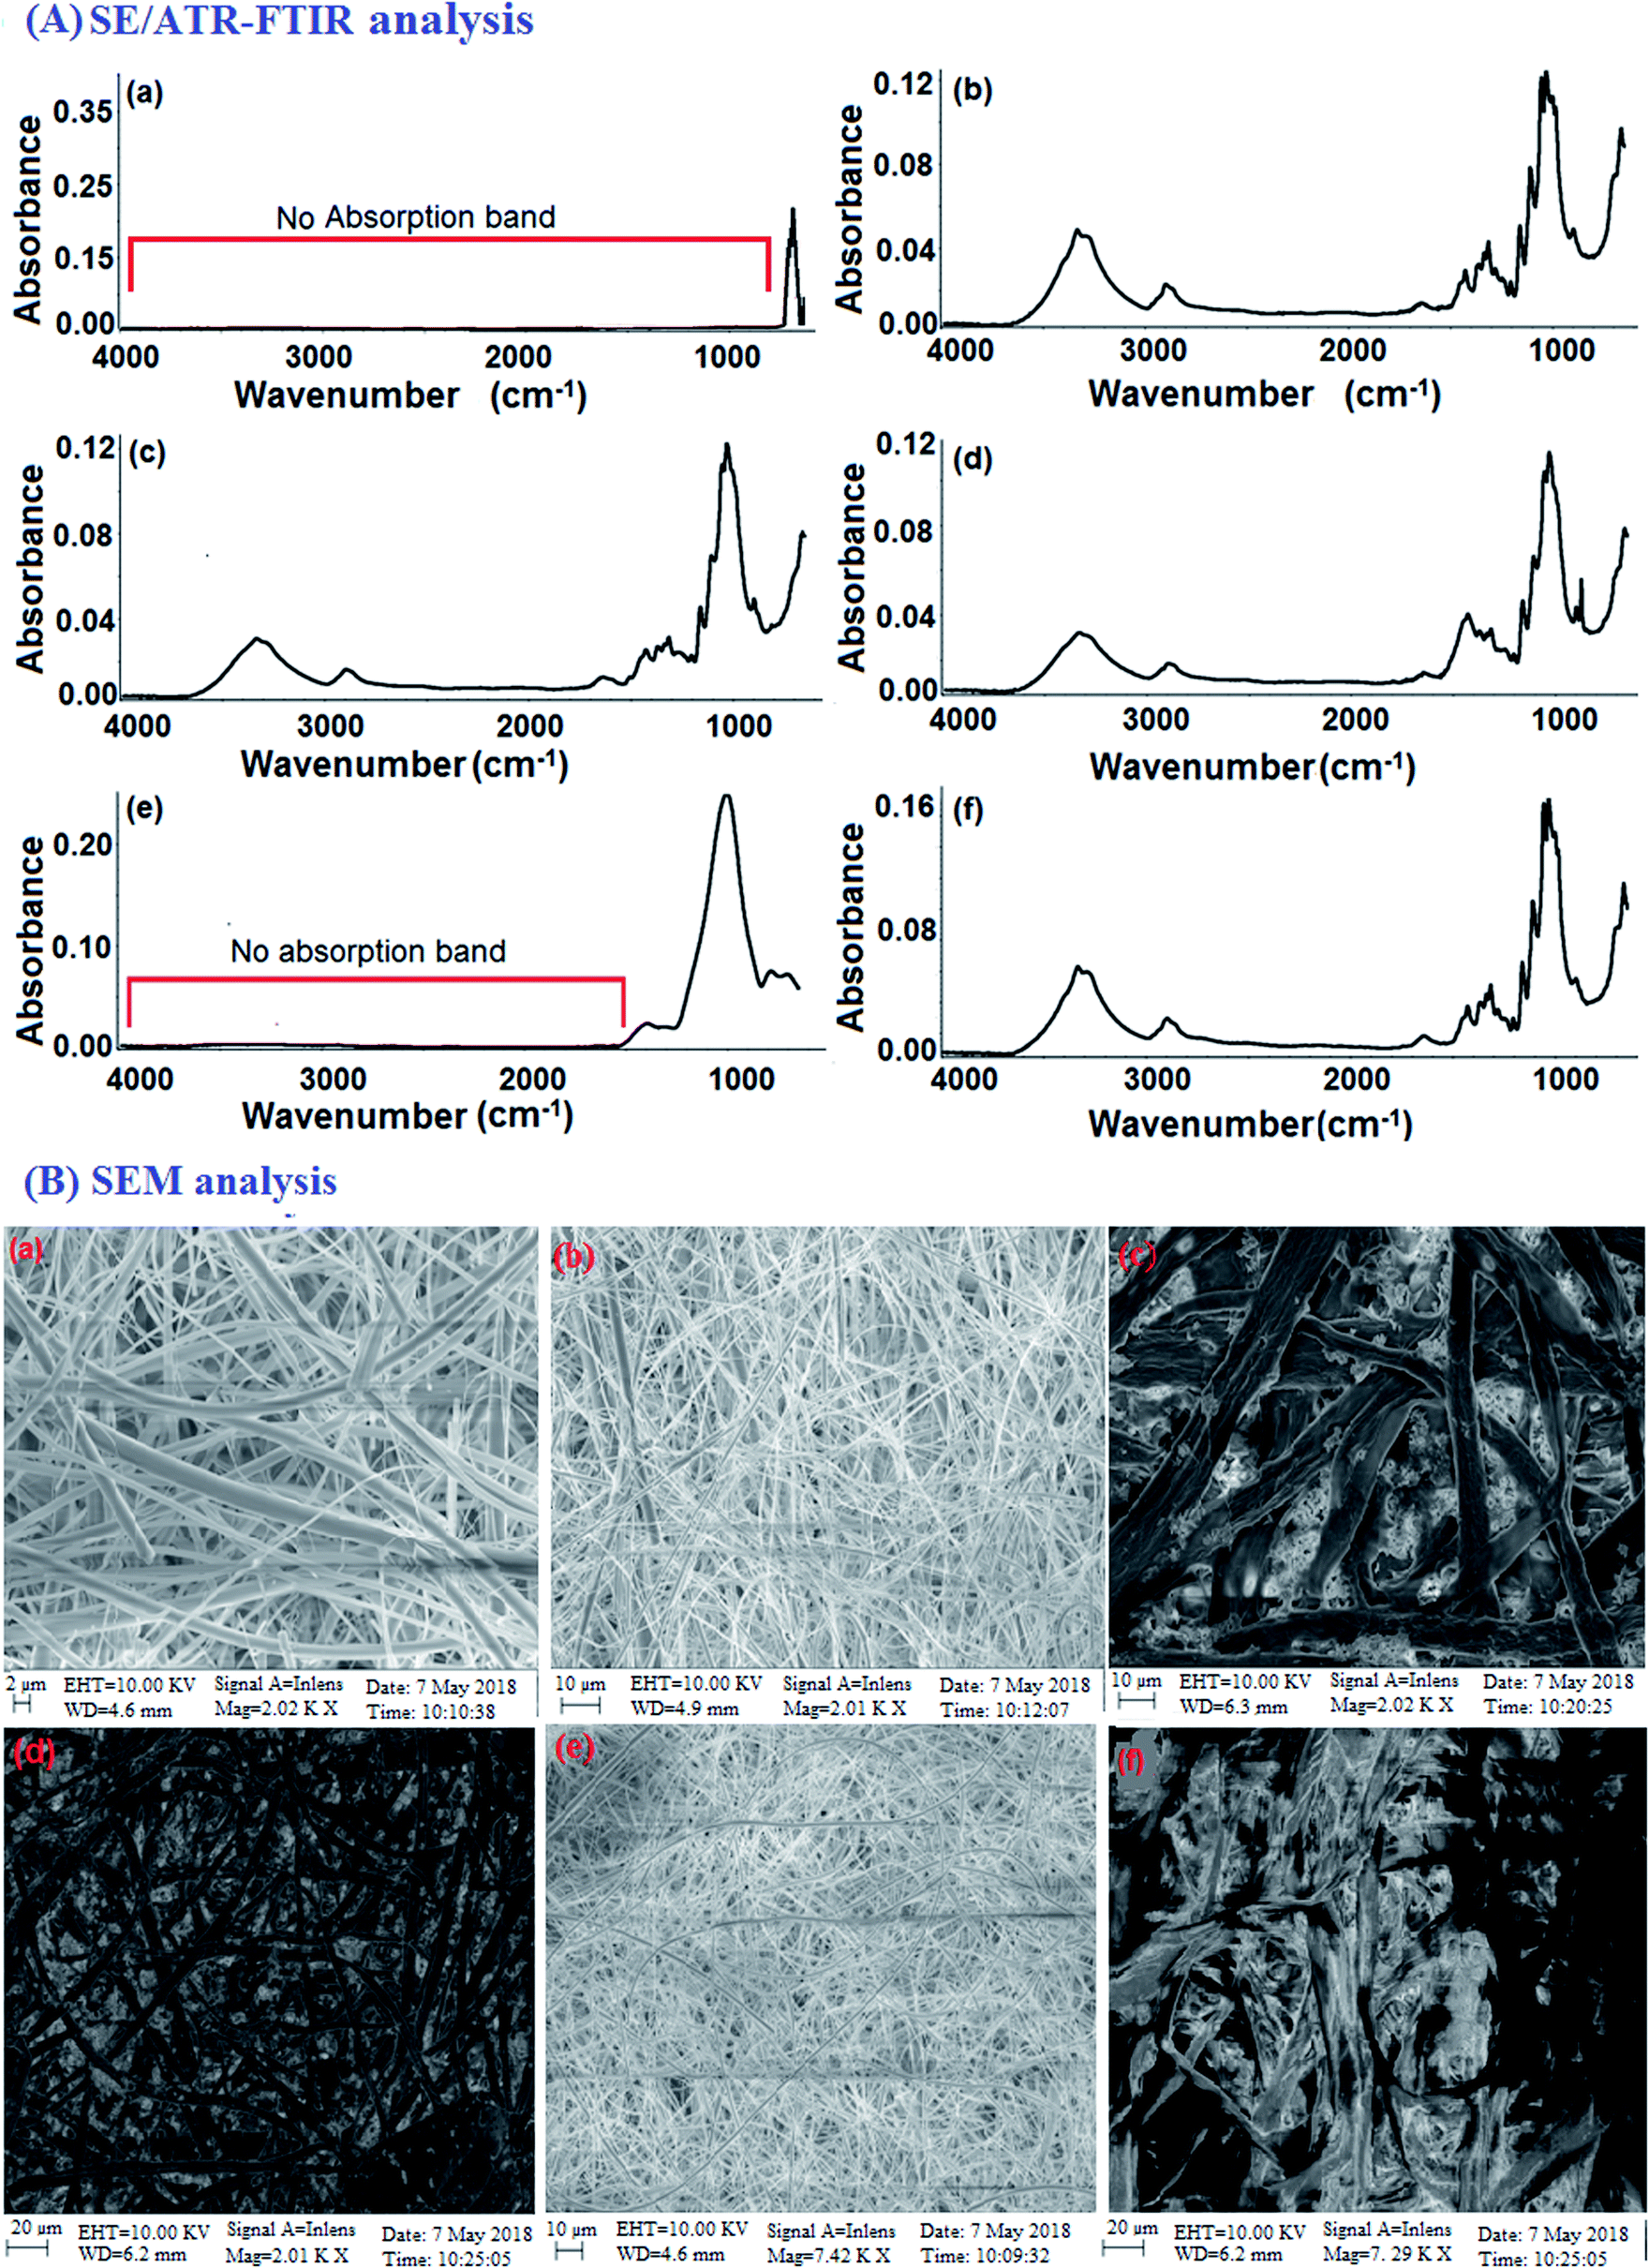 | ||
| Fig. 3 (A) ATR-FTIR spectra and (B) SEM images of different papers including (a) GFF paper, (b) Whatman filter paper, (c) tissue paper, (d) Xerox printing paper, (e) quartz filter paper, and (f) normal filter paper with KBr impregnation. | ||
Here, we report the two main functions of the KBr-impregnated paper substrate that enhanced the signal intensity of AS and NS in FTIR spectroscopy. Firstly, the KBr-impregnated paper substrate was used as a subtracting and adsorbing material based on its suitable spectral characteristics, greater distribution of the sample and removal of some of the interferents such as CO2/H2O vapour during the IR spectroscopic analysis. Adsorption is a physico-chemical phenomenon in which analytes are adsorbed on the surface of an adsorbent, such as the KBr-impregnated paper substrate, due to the rotational and vibrational movement of the molecular groups and formation of chemical bonds.41 The different papers such as glass fibre filter paper, Whatman filter paper, quartz filter paper, printing paper and tissue paper impregnated with KBr were tested as IR subtracting and adsorbing materials for the enhancement of the FTIR signals of the analytes. In the case of GFF, the peak was slightly broadened due to the presence of glass microfibers. A small shift towards a lower wavenumber was also observed, which may be attributed to the presence of other residues. The FTIR signals related to the cellulose fibre filters (Whatman filter paper, printing paper and tissue paper) were located at 1064, 1000 and 800 cm−1 due to the C–O stretching, C–C stretching and C–O–C bending vibrations, respectively. The OH vibrations with hydrogen bonding were observed near 3300 cm−1 for the paper substrates including the Whatman filter paper, printing paper, and tissue paper. The characteristic peaks were observed near 1260, 1100–1000, and 800 cm−1 for the CH2 bending vibration of the paper containing cellulose (Fig. 3A(b–f)). The IR spectrum of the quartz filter paper exhibited a peak at 1109 cm−1 in the double bond region due to the presence of SiO2. However, all these peaks strongly interfere with the identification regions of AS and NS. The absorption peak for GFF was observed in the range of 500–890 cm−1 due to the presence of silicate (SiO44−), while the analyte peaks were observed in the range of 900–3500 cm−1 (Fig. 3A(a)). Spectral comparisons were not provided for the empty paper and KBr-deposited paper because the characteristic infrared absorption bands of both the empty paper and KBr-deposited paper were observed to be the same. The main reason for observing the same characteristic peaks for both papers is that KBr is an IR-inactive substance, and therefore the characteristic peaks of only silicates (SiO44−) were observed with similar intensities. The advantages of using the KBr-impregnated paper substrate include providing a better adsorption surface for enhanced IR signals for the analysis of AS and NS compared to empty paper and the use small amounts of KBr. Ghosale et al. (2016), Alahmad et al. (2018) and Rattanarat et al. (2012) demonstrated the use of photopaper for electronic and electrochemical applications in conductivity measurement due to its wide distribution, flexibility, fine pore size, smooth surface, and moderate absorption of the solvent.42–44 The reasons for the current approach of using GFF as a substrate are its wide distribution, disposability, foldability, global availability and cost-effectiveness. We proposed a simple model to describe the adsorption of surfactants on the surface of the SiO44−-containing paper and analysis by FTIR spectroscopy in the mid infrared region of 400–4000 cm−1. The positive (+ve) and negative (−ve) charges of silicate are based on its basic chemical component of the tetrahedron-shaped anionic SiO44− group. The nature of SiO44− in GFF impregnated with KBr plays an important role in the adsorption of AS and NS at the solid–liquid interface due to the hydrophilic and hydrophobic interactions. AS in the presence of salts such as calcium ion (Ca2+) and potassium ion (K+) are adsorbed on the hydrophilic and hydrophobic sites, while NS are adsorbed on the hydrophobic sites due to the CH2 chain interaction.45 NS may also be adsorbed on charged sites by hydrogen-bonding; however, the extent of adsorption is dependent on the pH of the solution and electrolyte.45 Based on the observations presented earlier, we assumed that the surface of the KBr-impregnated GFF paper is comprised of positive charges for the silicate sites and neutral hydrophobic sites. The positively charged central silicon ion (Si4+) present in the GFF substrate behaves as the hydrophilic site. According to a computational study, the primary reason for the strong surfactant–silicate interactions is their dispersion, while the second reason is the electrostatic and hydrogen-bonding interactions.46 Therefore, it can be concluded that the main reason for the alteration in the surfactants chains at the interface is the strong van der Waals dispersion forces between the surfactants (AS and NS) and glass surface. Fig. 4a–d illustrate the proposed strategy. The micro-structure and elemental composition of the paper before and after the addition of AS and NS were confirmed using SEM-EDX and discussed in the ESI.†47 The results are shown in Fig. S2(a) and (b).† Therefore, the results demonstrated that the GFF paper can act as an IR subtracting and adsorbing material for the analysis of AS and NS in sample solutions.
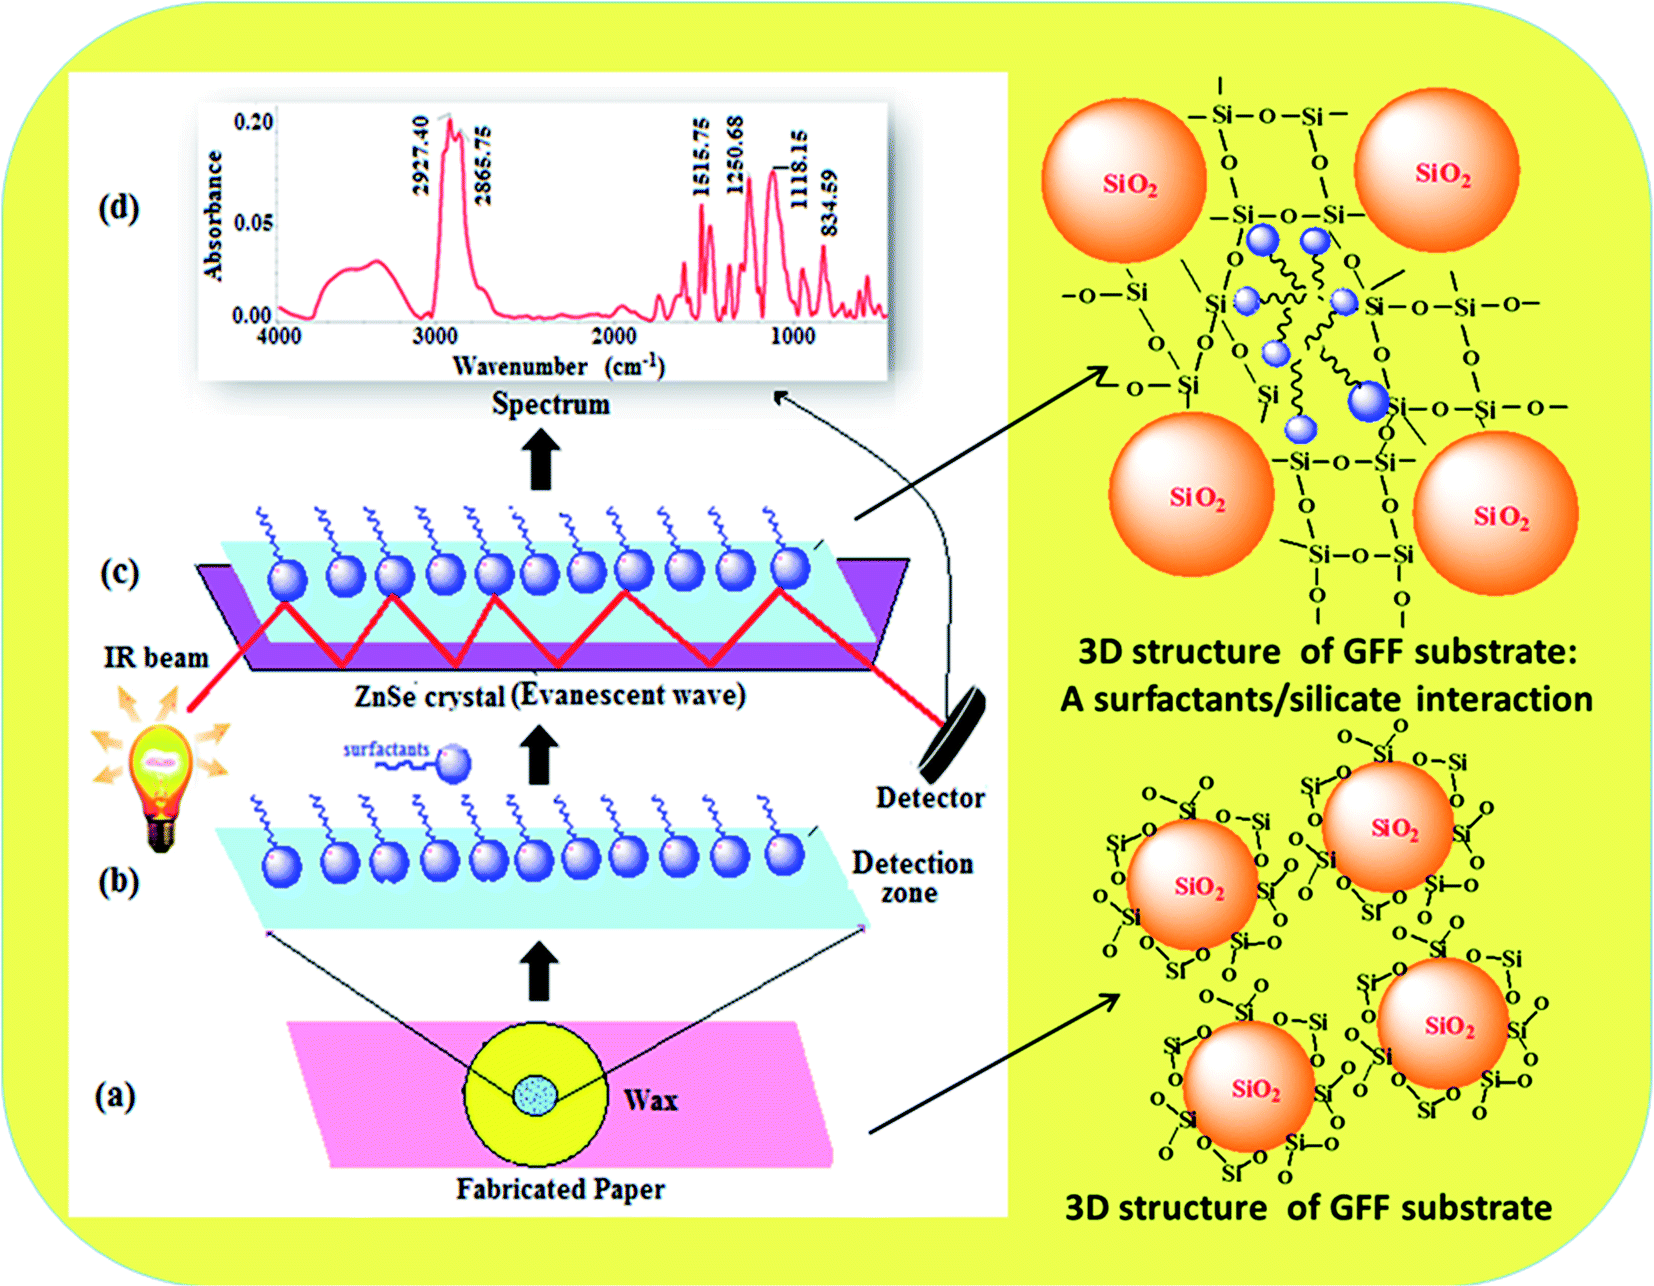 | ||
| Fig. 4 Surfactants/silicate interaction mechanism for the determination of AS and NS using KBr-impregnated paper coupled with FTIR on (a) fabricated GFF, (b) AS and NS adsorbed on paper surface and interaction with silicate containing GFF, (c) interaction of EMV of reflected radiation with analytes containing KBr-impregnated paper and (d) SE/ATR-FTIR spectra of surfactants (CAS,NS (100 μg L−1) = 20 μL; paper diameter = 5 mm; number of scans = 15; and temperature = 65 °C for 2 min). | ||
Enhancement in signal intensity of AS and NS using KBr-impregnated paper substrate
An enhancement in the signal intensity of AS and NS using a KBr-impregnated paper substrate was achieved in the present work. The first function of the KBr-impregnated paper substrate was discussed in the previous section. Secondly, the KBr-impregnated paper substrate was used for absorbing effective electromagnetic radiation in the IR region for the enhancement of the signal intensity of AS and NS. For this, a mixed AS and NS-loaded smooth KBr-impregnated paper substrate was clamped tightly against a ZnSe crystal. An improvement in the infrared signal intensity was obtained after using GFF as the modified subtracting and absorbing material. The absorption bands were observed in the range of 900–3500 cm−1 for the mixed AS and NS, as shown in Fig. 5a and Table S2.† For AS, the CH2 asymmetric and symmetric stretching bands are the two strongest bands in this region, which can be ascribed the packing and conformation of the LABS molecules on the paper substrate.48 The CH2 asymmetric stretching band appeared at 2981 cm−1, suggesting an ordered hydrocarbon chain in an all-trans CH2 conformation. Furthermore, a shift was observed in the CH2 asymmetric stretching band from 2954 to 2981 cm−1 upon the deposition of LABS molecules on the KBr-impregnated paper substrate. The band at 1472 cm−1 is very sensitive, corresponding to the chain interactions and the packing organization of the CH3 chain.49,50 This band had a shoulder at 1466 cm−1, which decreased as the number of LABS molecules deposited on the KBr-impregnated paper substrate decreased. The feature around 1466 cm−1 broadened and decreased in intensity, which are both reasonable signs of a reduction in the chain interactions accompanied with an increase in chain motion.51 As shown in Fig. 5a, the degenerate SO42− asymmetric stretching modes can be observed at 1219 and 1253 cm−1 for the LABS molecules deposited on the KBr-impregnated paper substrate. The SO42− group is very asymmetric because of the two inequivalent SO42− groups that face each other and has a slight dihedral angle between the two pseudo C3v axes.45 The different oxygen atoms in the SO42− group reduce the C3v symmetry to a single mirror plane, resulting in a strongly split band due to the interaction with the positive charges of the central silicon ion (Si4+).45 Similarly, strong bands were observed at 1114 cm−1, which were assigned to the stretching vibration of the C–O–C group for NS, using paper substrate (Fig. 5a and Table S2†). However, a many-fold enhancement in the signal intensity was achieved when the KBr-impregnated paper was used as a modified substrate for the determination of AS and NS. The reason for the enhancement of this signal intensity is due to the electrostatic and hydrophobic interaction between the negative charge of AS and positive charge of the silicon ion (Si4+) present in the GFF substrate. NS also interacts with the charged sites (in the presence of salt and electrolytes) and hydrophobic site of the SiO44−-containing GFF by hydrogen bonding. The cellulose-containing paper substrate also interacts with the hydrocarbon chain of AS and NS due to the hydrophobic interaction force. Furthermore, the results obtained using the KBr-impregnated paper substrate method were compared with that obtained using the conventional KBr substrate/pellet method for the determination of AS and NS. Lower intensity R signals were obtained when KBr was used as the subtracting material as compared with the modified KBr-impregnated paper substrate (Fig. 5a and b, respectively). The disadvantage of the KBr method it is time-consuming experimental process, with the most time spent grinding, mixing, and drying for sample preparation in FTIR analysis.52 Also, the waste of chemicals and sometimes interferences such as from the air and water leading to possible handling and instrumentation errors are additional disadvantages. Therefore, ATR-FTIR using the modified KBr-impregnated paper substrate can afford excellent insight into the structure and conformation of molecular systems and qualitative and quantitative analysis of AS and NS. The effective absorption of electromagnetic waves occurs in the mid-IR region when the paper substrate was used as a subtracting and adsorbing material, and this method is called “signal-enhanced/attenuated total reflection-Fourier transform infrared (SE/ATR-FTIR) spectroscopy”. Next, the improved SE/ATR-FTIR signal intensity for the peaks at 1253 cm−1 (SO42− symmetry stretching) and 1114 cm−1 (C–O–C stretching vibration) was employed for the quantitative analysis of AS and NS, respectively, in commodity and environmental water samples using the linear least squares equation (y = mx + c). The signal intensity was directly proportional to the amount of analytes adsorbed on the surface of the KBr-impregnated paper substrate. The results of a representative experiment are depicted in Fig. 5(c) and (d). | ||
| Fig. 5 FTIR spectra of mixed AS and NS using KBr-impregnated paper substrate method (a), KBr substrate method without paper (b), SE/ATR-FTIR spectra of different concentrations (10–100 μg L−1) of mixed AS and NS (c), and graphical representation of linear least squares (LLS) calibration model with K–M theory using Sigma plot 10 (d) (CAS,NS (10–100 μg L−1) = 20 μL; paper diameter = 5 mm; number of scans = 15; and temperature = 65 °C for 2 min). | ||
Determining factors on the performance of KBr-impregnated paper substrate
The methodology was optimized by investigating the effect of some parameters that can affect the detection efficiency such as number of scans, microzone diameter, temperature and sample volume. AS from the sample solution was monitored by considering the absorption peak located at 1253.49 cm−1 in the FTIR spectrum. AS was selected as a model compound for the optimization of the method, and all the optimized parameters were plotted using the Sigma Plot 10 software.The microzone diameter and sample volume were also optimized using 100 μg L−1 AS and NS standard solution. The microzone diameter ranged from 2 to 8 mm, and the sample volume was varied from 1 to 20 μL. As can be seen in Fig. S3(a) and (b),† the SE/ATR-FTIR signals were enhanced when the sample volume was increased from 1 to 15 μL. For larger volumes, no significant improvements in the infrared signals were observed. Thus, the optimum values for the zone diameter and sample volume were 5.0 mm and 20 μL, respectively.
The effect of number of sample scans using infrared radiation was evaluated in the proposed method. The number of scans of the sample was varied in the ranged of 5 to 32 times. The results obtained in this experiment are shown in Fig. S3c.† As expected, higher intensity SE/ATR-FTIR signals were observed when the samples were scanned 15 times using the ATR-FTIR accessory. Subsequently, with a further increase in the number of scans, no noticeable enhancement in signal intensity was observed for the detection of AS and NS. Thus, based on these results, 15 scans were chosen as the optimum condition for subsequent experiments. The optimised conditions were then used to investigate the analytical performance of the proposed device for the determination of AS and NS in commodity and environmental water samples.
A drop of sample solution was placed on the detection zone of the KBr-impregnated paper surface directly using a microsyringe. Then, the paper was dried in an oven at 40–70 °C for 2 min to remove the water vapour, and analyzed via FTIR using an ATR accessory. The signal intensity of the analyte increased with an increase in temperature up to 50 °C, and then further no improvement in signal intensity was observed, as shown in Fig. S3d.† This step was important for the optimization of the analytical conditions for the FTIR analysis. The drying temperature of the sample is important to monitor since water vapour significantly affects the IR signal intensity. Since a broad absorption band was observed when the water-containing paper substrate was placed on the ZnSe crystal directly, this parameter, i.e., temperature, was used to eliminate water vapour from the system. Upon the complete removal of water via the thermal heating process, a strong enhancement in the IR signal of AS and NS was observed. The maximum and steady signal intensity was obtained when the temperature was around 50–70 °C. Accordingly, in the present work, drying of the sample was performed at 65 °C for the determination of AS and NS using the KBr-impregnated paper substrate coupled with FTIR spectroscopy.
Evaluation of possible interferences for the selective detection of AS and NS
The evaluation of possible interferents was performed for specific interferences due to the presence of anion, cations, polycation and other surfactants, which must be considered in the determination of AS and NS. The effect of various metal ions such as Na+, K+, Mg+, Ca2+, Mg2+, Ni2+, Zn2+, Cu2+, Cd2+, Pb2+, Hg2+, Fe3+, Al3+, Cr3+, Co3+, and As3+, anions such as F−, Cl−, Br−, I−, NO2−, ClO2−, BrO3−, IO3−, NO3−, BrO3−, CH3COO−, MnO4−, CrO42−, MoO42−, WO42−, S2O32−, SO32−, SO42−, CO32−, C2O42−, AsO43−, and EDTA, and polycations such as polydiallyldimethylammonium chloride (PDADMAC), which may be present in water samples, was evaluated for the selective determination of AS and NS with and without the KBr-impregnated paper substrate via ATR-FTIR spectroscopy. For this study, the determination of mixed AS and NS was carried out by introducing water spiked with different concentrations of diverse metal ions, anions and polycation on the detection zone of the paper substrate, which was analyzed via ATR-FTIR. For the developed method, no significant change in the AS and NS signal was observed when the selected ions were added to the solutions containing the analytes, independent of the interferent concentration. The tolerance limit obtained for diverse ions, anions and polycation were found to be higher than their reported levels in water samples. The interferences on mixed AS and NS using the KBr-impregnated paper coupled with ATR-FTIR are shown in Fig. S4A and B.† The same test was performed with the standard method, where the interferences were determined in the presence of cetyltrimethylammonium bromide (CTAB), dodecyltrimethylammonium bromide (DTAB), meristyltrimethylammonium bromide (MTAB), and butanediyl-1,4-bis(dimethyl cetylammonium bromide) (BDAB). In the case of CTAB, DTAB and MTAB, the addition of 100 mg L−1 caused a 5% enhancement in the analyte signal, whereas for BDAB, the addition of 20 mg L−1 caused a reduction in the total intensity by 10%. These results indicate that the method is virtually free from specific interferences due to the presence of anions and cations normally found in environmental water samples.Method validation for the determination of AS and NS using KBr-impregnated paper substrate in ATR-FTIR
Method validation was performed for most of the key parameters such as selectivity, linearity, method detection limit (MDL), method quantification limit (MQL), trueness, precision and matrix effect (Table S3†). The presence of AS and NS was confirmed based on their FTIR absorption spectra. The characteristic absorption bands were observed at 1253 (SO42− symmetry stretching) and 1114 cm−1 (C–O–C stretching vibration) for AS and NS, respectively. The calibration curve was prepared using the peak intensity or peak area in the respective K–M spectrum. The software (Omnic 9) automatically converted the absorbance spectrum into the K–M spectrum for smoothening of the baseline correction for to the quantitative analysis of AS and NS. Employing this model, the optical properties of particular films under internal illumination can be predicted from the effective absorption and molecular extinction coefficients of the material.19 The selectivity describes whether an analytical method can discriminate interferences from a similar group of compounds, as determined by the relative signal intensity. In this study, the linearity range was calculated based on the absorption peak area at 1253 cm−1 (SO42− symmetric stretching) and 1114 cm−1 (C–O–C stretching vibration) and the linearity range was found to be in the range of 10–100 μg L−1 with a correlation of determination (r2) of 0.989, as shown in Fig. 5d. In the development of an analytical method, under a given confidence level, the MDL is the lowest analyte concentration that can likely be differentiated from a blank value. MDL and MQL for FTIR using the KBr-impregnated paper substrate were calculated according to following equations: MDL = A + t × S and MQL = 3 × MDL, where A is the intercept of the calibration curve, S is the standard deviation of 6 replicate measurements of blank sample spiked with a mixed standard solution of AS and NS, and t is obtained from the t-test 95% confidence level.1,53 MDL and MQL were calculated to be 4 and 12 μg L−1, respectively, for the determination of AS and NS in environmental and commodity samples. Trueness and precision are two important characteristics of instrument stability. Trueness is a measure of the closeness of agreement between the average value of test results and an accepted reference value. Trueness can be illustrated using the following equation: trueness (%) = Cs/Cm × 100, where Cs and Cm are the average measured analyte concentration of the sample using the proposed method and certified concentration of the standard material, respectively. The precision was calculated as the relative standard deviation of 6 replicate measurements of the same sample using the KBr-impregnated paper substrate and ATR-FTIR spectroscopy. The trueness and precision results from FTIR spectroscopy using the KBr-impregnated paper substrate method were found to be within the acceptable range of 1.5% to 4.1% and 2.2% to 5.5%, respectively, indicating that the FTIR method is suitable and reliable for the analysis of AS and NS in commodity and environmental water samples. Subsequently, the matrix effect was calculated followed by comparison of the response of standard compounds spiked in blank samples. The matrix effect (ME) can be defined as the average value of the real sample and spiked sample. The ME was estimated to be in the range of 0.05–24.6 and 19.3–75.1 μg L−1 for AS and NS in the environmental water and commodity samples, respectively, and the results are presented in Table S3.† The results obtained with the present method were found to be comparable with that for a multi-walled carbon nanotube (MWCNT) sensor-based potentiometric titration method.54 For the analytical quality assurance, the calculated F value (sd12/sd22) was found to be less than the tabulated F-value, revealing that there is no significant difference between the present method and reference method. Similarly, the student t-value calculated (X1 − X2/νVar12/n + Var22/n) at the 95% confidence level was also found to be less than the tabulated t-value. This again showed the statistical closeness of the present method with the reference standard method.Analysis of AS and NS in commodity and environmental water samples using KBr-impregnated paper substrate in ATR-FTIR
The developed method was applied for the determination of AS and NS in commodity and environmental water samples, which were obtained from sale points and a local market in Raipur City, India (Fig S5†). These samples were prepared using an analytical balance and diluted 50 times with ultra-pure water. Then, 20 μL of sample was placed on the detection zone of the KBr-impregnated paper substrate for FTIR analysis using an ATR accessory. The spectrum of the samples showed only two strong absorptions bands at 1449 and 1253 cm−1 (CH2 bending vibration and SO42− symmetry stretching, respectively) for AS and one prominent peak at 1114 cm−1 for NS, which can be assigned to the C–O–C stretching vibration. The overlap of the spectral peaks for the standard solution of AS and NS and sample peaks confirmed the identification of the compound mixtures. The mixed AS and NS detected in different samples was also compared with a pure standard compound mixture of AS and NS, and the data was interpreted by searching spectral libraries or similarity spectral match in the Omnic 9 TQ analyst software.In the present work, the quality control experiment was carried out for each sample, consisting of a calibration standard matrix, a spiked and a non-spiked sample for all the target compounds. A 20 μL volume of non-spiked and spiked samples with 20 μL (20 and 50 μg L−1) standard solutions of mixed AS and NS were deposited on the detection zone of the KBr-impregnated paper for FTIR analysis with an ATR accessory. The results of the positive samples containing AS and NS are shown in Table 1. The results obtained from the ATR-FTIR analysis of eight commercial product formulations containing AS using the KBr-impregnated paper substrate were compared with that obtained using MWCNTs/potentiometric titration (Table 2).54 Further, the accuracy of the present method was checked by calculating the recovery percentage (%) of AS and NS. The recovery percentage (%) was evaluated by measuring the concentration of AS and NS in the spiked and non-spiked (blank) commodity and environmental water samples. The recovery% obtained with FTIR using the paper substrate method was estimated to be in the range of 97.1–109.5% and 71.4–109.8% for the commodity and environmental water samples (Tables 1 and 2), respectively. Thus, these results suggest that the method is free of matrix interferences in complex sample matrices.
| S. no. | Sample source | Surfactants found (μg L−1) | RSD, % (n = 6) | Standard addition (μg L−1) | Total surfactant found (μg L−1) | Recovery (%) |
|---|---|---|---|---|---|---|
| a CPn (commodity product), WWn (wastewater), and ND (not detected). | ||||||
| (a) Linear alkylbenzene sulfonate (AS) | ||||||
| 1 | CP1 | 0.05 ± 0.0005 | 4.1 | 20, 50 | 19.3, 51.1 | 96.2, 102.0 |
| 2 | CP2 | 2.06 ± 0.0015 | 4.2 | 20, 50 | 19.6, 56.0 | 87.6, 107.8 |
| 3 | CP3 | 0.05 ± 0.0005 | 2.9 | 20, 50 | 23.0, 54.3 | 101.1, 108.5 |
| 4 | CP4 | 3.14 ± 0.0050 | 3.5 | 20, 50 | 19.3, 50.1 | 80.8, 93.9 |
| 5 | CP5 | 1.85 ± 0.0052 | 2.5 | 20, 50 | 19.0, 51.2 | 85.7, 98.6 |
| 6 | CP6 | 0.05 ± 0.0007 | 4.2 | 20, 50 | 22.0, 55.0 | 109.7, 109.8 |
| 7 | CP7 | 0.55 ± 0.0011 | 5.5 | 20, 50 | 21.6, 55.2 | 105.2, 109.3 |
| 8 | CP8 | 0.05 ± 0.0016 | 4.5 | 20, 50 | 20.9, 55.0 | 104.7, 109.8 |
| 9 | CP9 | 0.12 ± 0.0005 | 3.2 | 20, 50 | 21.1, 53.1 | 104.9, 105.9 |
| 10 | CP10 | 0.01 ± 0.0008 | 4.5 | 20, 50 | 21.2, 54.6 | 105.9, 109.1 |
| 11 | CP11 | 2.43 ± 0.0014 | 5.1 | 20, 50 | 20.2, 56.0 | 88.8, 107.1 |
| 12 | CP12 | 2.57 ± 0.0012 | 4.3 | 20, 50 | 19.6, 52.7 | 85.1, 100.2 |
| 13 | CP13 | 8.01 ± 0.0012 | 4.8 | 20, 50 | 22.3, 53.1 | 71.4, 90.1 |
| 14 | CP14 | ND | ND | ND | ND | ND |
| 15 | CP15 | 2.52 ± 0.0021 | 2.2 | 20, 50 | 18.3, 47.83 | 78.8, 90.6 |
| 16 | WW1 | 23.2 ± 0.00519 | 3.9 | 20, 50 | 42.2, 59.3 | 76.0, 72.2 |
| 17 | WW2 | 22.0 ± 0.00271 | 2.0 | 20, 50 | 42.0, 69.7 | 80.0, 95.4 |
| 18 | WW3 | 24.6 ± 0.00175 | 4.7 | 20, 50 | 50.1, 75.1 | 102, 101 |
![[thin space (1/6-em)]](https://www.rsc.org/images/entities/char_2009.gif) |
||||||
| (b) Octylphenol ethoxylate (NS) | ||||||
| 19 | CP6 | 0.05 ± 0.0017 | 3.1 | 20, 50 | 21.0, 54.0 | 104.7, 107.8 |
| 20 | CP16 | 0.81 ± 0.0014 | 4.5 | 20, 50 | 19.3, 57.83 | 92.4, 107.8 |
| 21 | CP3 | 0.04 ± 0.0025 | 3.5 | 20, 50 | 20.0, 51.3 | 99.7, 102.5 |
| 22 | CP2 | ND | ND | ND | ND | ND |
| 23 | CP4 | 3.43 ± 0.0041 | 2.8 | 20, 50 | 19.1, 47.1 | 78.3, 87.3 |
| 24 | CP11 | ND | ND | ND | ND | ND |
| 25 | CP8 | 2.10 ± 0.0005 | 4.2 | 20, 50 | 18.3, 49.1 | 80.9, 93.9 |
| 26 | WW2 | 8.3 ± 0.0017 | 4.2 | 20, 50 | 25.3, 54.7 | 85.0, 92.8 |
| 27 | WW1 | 11.1 ± 0.0027 | 0.5 | 20, 50 | 31.7, 41.9 | 103, 61.6 |
| 28 | WW3 | 5.2 ± 0.0015 | 4.7 | 20, 50 | 15.8, 45.7 | 53.0, 81.0 |
| S. no. | Commodity sample | ATR-FTIRa (present method) | Potentiometric titrationb (reference method) | AQAd 95% confidence limit/tabulated value | |||
|---|---|---|---|---|---|---|---|
| KBr-impregnated paper | NTSSc | F-Teste | t-Testf | ||||
| AS found (μg L−1) | Recovery (%) | AS found (mmol L−1) | Recovery (%) | ||||
| a Attenuated total reflectance-Fourier transform infrared spectroscopy.b Potentiometric titration method.c Nanotube surfactant sensor.d Analytical quality assurance.e Tabulated F6,6-value at 95% confidence limit is 4.28 twelve degrees of freedom at the probability level of 0.05.f Tabulated t-value at 95% confidence level is 2.571 for N1 = 6 (i.e., for ν1 = N1 − 1 = 5, ν2 = N2 − 1 = 5). | |||||||
| 1 | Hand-dishwashing detergent A | 2.06 ± 1.2 | 87.6 | 1.40 ± 0.8 | 102.5 | 2.2 | 2.4 |
| 2 | Hand-dishwashing detergent B | 2.21 ± 2.2 | 102.1 | 2.13 ± 1.8 | 102.0 | 1.5 | 2.4 |
| 3 | Hand-dishwashing detergent C | 2.05 ± 1.4 | 101.5 | 2.98 ± 0.6 | 101.4 | 5.4 | 2.4 |
| 4 | Hand-dishwashing detergent D | 2.01 ± 0.5 | 107.4 | 4.50 ± 0.3 | 101.0 | 2.7 | 2.4 |
| 5 | Heavy duty powder detergent A | 2.41 ± 0.8 | 100.1 | 2.31 ± 0.6 | 99.1 | 1.8 | 2.0 |
| 6 | Heavy duty powder detergent B | 1.95 ± 1.3 | 98.5 | 1.05 ± 0.9 | 102.6 | 2.1 | 2.4 |
| 7 | Gel detergent A | 1.21 ± 0.17 | 100.2 | 0.75 ± 0.08 | 100.7 | 4.5 | 2.4 |
| 8 | Gel detergent B | 0.42 ± 0.06 | 85.9 | 0.89 ± 0.03 | 100.3 | 4.1 | 1.9 |
Comparison of ATR-FTIR with other reported methods for the determination of surfactants
Generally, analytical techniques such as spectrophotometry, fluorimetry, HPLC-MS, MOP-ME/DRS-FTIR, ESI-MS and AP–MALDI-MS are employed for the analysis of different types of surfactants. Table 3 provides a comparison of the different methods used for quantification of surfactants in various water samples. The main drawbacks of the spectrophotometric and fluorimetric methods are the employment of a specific dye or pigment for the formation of a colored complex with the target analyte, and sometimes there is chance of interference with other chemical species present in the sample.9,10 The use of the HPLC-MS, ESI-MS and AP-MALDI-MS techniques may result in improper separation of surfactants due to the formation of micelles in the chromatographic column compared to the KBr-impregnated paper substrate/ATR-FTIR method.4,55,56 Although MOP-ME/DRS-FTIR has the advantages of very high resolution, sensitivity, and rapid analysis, it requires complicated chemical derivatization processes.19 The KBr-impregnated paper based ATR-FTIR method has the advantages of being affordable, abundantly available, disposable, simple fabrication, and easy to handle with high sensitivity compared to other methods. Also, better MDL and RSD values of 4.0 μg L−1 and 2.3%, respectively, were obtained compared to that with other methods employing sophisticated instruments. Furthermore, the recovery% of the present method was found to be higher than that using other reported methods.| S. no. | Technique | Linear range, μg L−1 | MDL, μg L−1 | RSD, % | Recovery, % | Samples | Advantages | Disadvantages | Ref. |
|---|---|---|---|---|---|---|---|---|---|
| 1 | Spectrophotometry | 10–500 | 3.0 | 1.8 | 91.2–94.5 | River, municipal, domestic, tap water | Easy handling, no requirement of tedious sample preparation, and cheap cost of instrument | Low sensitivity, toxic solvent requirement, and time consuming | 10 |
| 2 | Fluorimetry | 250–35500 |
7.0 | 4.0 | 92.9–105.3 | River water | Easy, low cost and there is no need for sophisticated instruments | Selective for particular analytes with color complexes | 9 |
| 3 | HPLC-UV | 0.08–80 | 15.0 | 12.4 | 80.5–115.1 | Waste, lake pond water | Able to determine analytes with high molecular weight and low volatile compounds, and good separation efficiency | Improper separation due to the formation of micelles in chromatographic column | 4 |
| 4 | MOP-ME/DRS-FTIR | 0.150–300 | 0.05 | 3.8 | 97.1–109.5 | Wastewater | Easy to analyze solid and liquid samples, and high sensitivity and sample throughput | Instrument costly, and extraction is necessary for selective determination | 19 |
| 5 | ESI-MS | 0.4–140 | 5.0 | 6.0 | 95.0–97.0 | Sewage, river | Use samples with large masses, and sample structure can be determined fairly easily | Cannot analyze mixtures very well and apparatus is also very difficult to clean | 55 |
| 6 | AP–MALDI–MS | 50–1500 | 10.0 | 9.8 | 91.0–98.7 | River, municipal wastewater | Very high resolution power and sensitivity, rapid analysis, and good recovery | Derivatization required, and expensive and sophisticated | 56 |
| 7 | KBr-impregnated paper/ATR-FTIR | 10–100 | 4.0 | 2.3 | 95.4–109.7 | Domestic wastewater, commodity samples | Simple, rapid, highly sensitive, trace detection efficiency, reduced time, good recovery, and high sample throughput | Costly instrument, time consuming for preparation of KBr pellet, and small spectral interference | Present method |
Conclusions
A fabricated KBr-impregnated paper substrate was successfully applied for the determination of mixed AS and NS in different commodity and environmental water samples using ATR-FTIR spectroscopy. The routine analysis of surfactants is normally performed using sophisticated instruments such as HPLC-MS, ESI-MS, and AP-MALDI-MS, which are generally large in size, need trained personnel, require large amounts of chemical substances, and involve time-consuming sample preparation processes. In contrast, FTIR spectroscopy is a powerful, rapid and non-destructive technique that can be applied at the sample source for the determination of surfactants in commodity and environmental water samples. The currently developed KBr-impregnated paper is a type of substrate that is very cheap, easily foldable, globally available, and provides a large surface area for better adsorption, leading to enhanced IR signals for the analysis of even very small quantities of AS and NS using an ATR-FTIR spectrometer. In comparison to the blank GFF, the analysis sensitivity improved 20-fold using the KBr-impregnated paper as a substrate for the determination of AS and NS in ATR-FTIR spectroscopy. The KBr-impregnated paper-based ATR-FTIR method can be utilized for the detection of all classes of surfactants in samples consisting of complex and heterogeneous matrices in future work.Conflicts of interest
The authors declare that they have no conflict of interest.Acknowledgements
The authors are thankful to UGC-SAP [No. F-540/7/DRS-II/ 2016 (SAP-I)], DST-FIST [No. SR/FST/CSI-259/2014(c)], CCOST [2741/CCOST/MRP/2016] and SERB-DST, [SR/S1/IC-05/2012] for the financial assistance and providing instrumental facilities. The one of author (R. Kurrey) are also thankful to Pt. Ravishankar Shukla University, Raipur, C.G., and India for providing university scholarship under the VR. No. 1413/Fin/2016.References
- R. Kurrey, M. Mahilang, M. K. Deb and K. Shrivas, Trends Environ. Anal. Chem., 2019, 21, e00061 CrossRef CAS.
- P. A. Lara-Martin, A. Gomez-Parra and E. González-Mazo, J. Chromatogr. A, 2006, 1137(2), 188–197 CrossRef CAS.
- L. Ripoll-Seguer, M. Beneito-Cambra, J. M. Herrero-Martinez, E. F. Simo-Alfonso and G. Ramis-Ramos, J. Chromatogr. A, 2013, 1320, 66–71 CrossRef CAS.
- T. Ramcharan and A. Bissessur, J. Surfactants Deterg., 2016, 19, 209–218 CrossRef CAS.
- N. Azum, M. A. Rub and A. M. Asiri, J. Mol. Liq., 2014, 196, 14–20 CrossRef CAS.
- European Committee of Surfactants and their Organic Intermediates (CESIO), Statistics, http://www.cefic.be/cesio, 2017 Search PubMed.
- B. Simoncic and M. Kert, Dyes Pigm., 2002, 54(3), 221–237 CrossRef CAS.
- B. Wyrwas and A. Zgoła-Grzeskowiak, J. Surfactants Deterg., 2014, 17(1), 191–198 CrossRef CAS.
- D. L. Recalde Ruiz, A. L. Carvhalo Torres, E. Andres Garcia and M. E. Díaz Garcia, Analyst, 1998, 123, 2257–2261 RSC.
- M. Kamaya, Y. Kaneko and K. Nagashima, Anal. Chim. Acta, 1999, 384(2), 215–218 CrossRef CAS.
- K. Agrawal, G. Agnihotri, K. Shrivas, G. L. Mundhara, K. S. Patel and P. Hoffmann, Microchim. Acta, 2004, 147(4), 273–278 CrossRef CAS.
- S. D. Scullion, M. R. Clench, M. Cooke and A. E. Ashcroft, J. Chromatogr. A, 1996, 733(1–2), 207–216 CrossRef CAS.
- X. Liu and C. A. Pohl, Am. Lab., 2005, 37, 27–30 CAS.
- S. K. Verma and K. K. Ghosh, J. Chem. Sci., 2013, 125(4), 875–882 CrossRef CAS.
- U. Farooq, A. Ali, R. Patel and N. A. Malik, J. Mol. Liq., 2017, 234, 452–462 CrossRef CAS.
- C. Berthomieu and R. Hienerwadel, Photosynth. Res., 2009, 101(2–3), 157–170 CrossRef CAS.
- P. Seredin, D. Goloshchapov, Y. Ippolitov and J. Vongsvivut, Vib. Spectrosc., 2020, 103058 CrossRef CAS.
- J. Madejova, L. Sekerakova, V. Bizovska, M. Slany and L. Jankovic, Vib. Spectrosc., 2016, 84, 44–52 CrossRef CAS.
- R. Kurrey, M. K. Deb and K. Shrivas, J. Surfactants Deterg., 2018, 21(2), 197–208 CrossRef CAS.
- B. K. Sen, S. Tiwari, M. K. Deb and S. Pervez, Anal. Methods, 2015, 7(22), 9474–9481 RSC.
- S. Chandrawanshi, S. K. Verma and M. K. Deb, J. AOAC Int., 2018, 101(4), 1145–1155 CrossRef CAS.
- S. K. Verma and M. K. Deb, Anal. Chim. Acta, 2007, 582(2), 382–389 CrossRef CAS.
- B. Ninwong, P. Sangkaew, P. Hapa, N. Ratnarathorn, R. F. Menger, C. S. Henry and W. Dungchai, RSC Adv., 2020, 10(17), 9884–9893 RSC.
- M. Kavruk, V. C. Ozalp and H. A. Oktem, J. Anal. Methods Chem., 2013, 2013, 932946 CrossRef.
- B. Li, J. Qi, L. Fu, J. Han, J. Choo, A. J. de Mello, B. Lin and L. Chen, Biosens. Bioelectron., 2020, 165, 112282 CrossRef CAS.
- L. Carolei and I. G. Gutz, Talanta, 2005, 66(1), 118–124 CrossRef CAS.
- G. Rytwo, R. Zakai and B. Wicklein, J. Spectrosc., 2015, 727595 Search PubMed.
- E. Olkowska, M. Ruman and Z. Polkowska, J. Anal. Methods Chem., 2014, 2014, 769708 Search PubMed.
- K. Kargosha, S. H. Ahmadi, M. Mansourian and J. Azad, Talanta, 2008, 75(2), 589–593 CrossRef CAS.
- R. Kurrey, M. Mahilang, M. K. Deb, J. Nirmalkar, K. Shrivas, S. Pervez, M. K. Rai and J. Rai, Food Chem., 2019, 270, 459–466 CrossRef CAS.
- Y. Lu, L. Han, C. J. Brinker, T. M. Niemczyk and G. P. Lopez, Sens. Actuators, B, 1996, 36(1–3), 517–521 CrossRef CAS.
- M. Hus, Croat. Chem. Acta, 1985, 58, 161–168 CAS.
- A. J. Prosser and E. I. Franses, Langmuir, 2002, 18(24), 9234–9242 CrossRef CAS.
- R. B. Viana, A. B. Da Silva and A. S. Pimentel, Int. J. Mol. Sci., 2012, 13(7), 7980–7993 CrossRef CAS.
- M. J. Oliveira, P. Quaresma, M. P. de Almeida, A. Araújo, E. Pereira, E. Fortunato, R. Martins, R. Franco and H. Aguas, Sci. Rep., 2017, 7(1), 1–4 CrossRef CAS.
- P. T. Garcia, E. F. Gabriel, G. S. Pessoa, J. C. Junior, P. C. Mollo Filho, R. B. Guidugli, N. F. Hoehr, M. A. Arruda and W. K. Coltro, Anal. Chim. Acta, 2017, 974, 69–74 CrossRef CAS.
- J. Qi, B. Li, N. Zhou, X. Wang, D. Deng, L. Luoand and L. Chen, Biosens. Bioelectron., 2019, 142, 111533 CrossRef CAS.
- K. L. Peters, I. Corbin, L. M. Kaufman, K. Zreibe, L. Blanes and B. R. McCord, Anal. Methods, 2015, 7(1), 63–70 RSC.
- T. Minamoto, T. Naka, K. Moji and A. Maruyama, Limnology, 2016, 17, 23–32 CrossRef CAS.
- S. M. Eid, M. K. A. El-rahman, M. R. Elghobashy and K. M. Kelani, Anal. Chim. Acta, 2018, 1005, 70–80 CrossRef CAS.
- R. Kurrey, M. K. Deb, K. Shrivas, B. R. Khalkho, J. Nirmalkar, D. Sinha and S. Jha, Anal. Bioanal. Chem., 2019, 411(26), 6943–6957 CrossRef CAS.
- A. Ghosale, K. Shrivas, R. Shankar and V. Ganesan, Anal. Chem., 2017, 89(1), 776–782 CrossRef CAS.
- W. Alahmad, N. Tungkijanansin, T. Kaneta and P. Varanusupakul, Talanta, 2018, 190, 78–84 CrossRef CAS.
- P. Rattanarat, W. Dungchai, W. Siangproh, O. Chailapakul and C. S. Henry, Anal. Chim. Acta, 2012, 26(744), 1–7 CrossRef.
- R. Wagemann and B. Graham, Water Res., 1974, 8(7), 407–412 CrossRef CAS.
- W. Tjandra, J. Yao and K. C. Tam, Langmuir, 2006, 22(4), 1493–1499 CrossRef CAS.
- S. Shrestha, J. Chem. Eng. Process Technol., 2016, 7, 1–11 Search PubMed.
- D. R. Scheuing and J. G. Weers, Langmuir, 1990, 6(3), 665–671 CrossRef CAS.
- J. F. Ventura-Gayete, B. F. Reis, S. Garrigues, A. Morales-Rubio and M. de la Guardia, Microchem. J., 2004, 78(1), 47–54 CrossRef CAS.
- R. Kurrey, K. Thakur, S. Chandrawanshi and M. K. Deb, J. Ravishankar University Part B Science, 2017, 30, 32–40 Search PubMed.
- R. Kurrey, M. K. Deb and K. Shrivas, New J. Chem., 2019, 43(21), 8109–8121 RSC.
- D. Bach and I. R. Miller, Biochim. Biophys. Acta, 2001, 1514, 318–326 CrossRef CAS.
- A. Shrivastava and V. B. Gupta, Chron. Young Sci., 2011, 2(1), 21 CrossRef.
- N. Sakac, M. Karnas, M. Jozanovic, M. Medvidovic-Kosanovic, S. Martinez, J. Macanc and M. Sak-Bosnara, Anal. Methods, 2017, 9(15), 2305–2314 RSC.
- K. Shrivas and H. F. Wu, J. Mass Spectrom., 2007, 42(12), 1637–4416 CrossRef CAS.
- K. Shrivas and H. F. Wu, Anal. Chim. Acta, 2008, 628(2), 198–203 CrossRef CAS.
Footnote |
| † Electronic supplementary information (ESI) available. See DOI: 10.1039/d0ra07286a |
| This journal is © The Royal Society of Chemistry 2020 |