 Open Access Article
Creative Commons Attribution 3.0 Unported Licence
Crystal growth control of rod-shaped ε-Fe2O3 nanocrystals†
Hiroko Tokoro *ab,
Junpei Fukuia,
Koki Watanabea,
Marie Yoshikiyo
 b,
Asuka Namaib and
Shin-ichi Ohkoshi
 *b
*b
aDepartment of Materials Science, Faculty of Pure and Applied Sciences, University of Tsukuba, 1-1-1 Tennodai, Tsukuba, Ibaraki 305-8573, Japan. E-mail: tokoro@ims.tsukuba.ac.jp
bDepartment of Chemistry, School of Science, The University of Tokyo, 7-3-1 Hongo, Bunkyo-ku, Tokyo 113-0033, Japan. E-mail: ohkoshi@chem.s.u-tokyo.ac.jp
First published on 29th October 2020
Abstract
Herein we report crystal growth control of rod-shaped ε-Fe2O3 nanocrystals by developing a synthesis based on the sol–gel technique using β-FeO(OH) as a seed in the presence of a barium cation. ε-Fe2O3 nanocrystals are obtained over a wide calcination temperature range between 800 °C and 1000 °C. A low calcination temperature (800 °C) provides an almost cubic rectangular-shaped ε-Fe2O3 nanocrystal with an aspect ratio of 1.4, whereas a high calcination temperature (1000 °C) provides an elongated rod-shaped ε-Fe2O3 nanocrystal with an aspect ratio of 3.3. Such systematic anisotropic growth of ε-Fe2O3 is achieved due to the wide calcination temperature in the presence of barium cations. The surface energy and the anisotropic adsorption of barium on the surface of ε-Fe2O3 can explain the anisotropic crystal growth of rod-shaped ε-Fe2O3 along the crystallographic a-axis. The present work may provide important knowledge about how to control the anisotropic crystal shape of nanomaterials.
Introduction
Ferrite magnets are ubiquitous functional materials for industry due to their ferromagnetic properties.1–6 Among ferrite magnets, gamma-diiron trioxide (γ-Fe2O3) has been extensively used due to its soft magnetic functionalities and chemical stability.7–10 On the other hand, epsilon-diiron trioxide (ε-Fe2O3) has drawn increasing attention in recent years.11–16 In 2004, a single phase of ε-Fe2O3, which was artificially synthesized via a nanoscale synthesis, displayed a huge magnetic coercive field over 20 kOe at room temperature.11 Since then, various fundamental studies have been reported.17–23 Furthermore, practical applications such as high-density magnetic recordings and high-frequency electromagnetic (EM) wave absorption have been considered.24–27 From a synthetic viewpoint, different methods for ε-Fe2O3 have been reported, including the reverse-micelle and sol–gel combination, mesoporous SiO2 template, pulsed laser deposition (PLD), and chemical vapor deposition (CVD).17,28–34The ε-Fe2O3 phase is only formed in the nanosize region. Typically, ε-Fe2O3 nanoparticles have a spherical shape, but rod-shaped crystals can appear under specific conditions.12 Rod-shaped ε-Fe2O3 has received attention from the viewpoint of applications as oriented fibers and probes for magnetic force microscopy.12,35 For example, small rod-shaped ε-Fe2O3 crystals less than a hundred nanometers are attractive for an oriented optical material because light scattering is eliminated. By contrast, elongated rod-shaped ε-Fe2O3 crystals are desirable as a probe in magnetic force microscopy. Hence, controlling the particle size of rod-shaped ε-Fe2O3 nanocrystals is an important issue. To date, rod-shaped ε-Fe2O3 nanocrystals have only been obtained using a combination of reverse-micelle and sol–gel techniques.12 However, this method produces ε-Fe2O3 in a very limited calcination temperature region (i.e., 960–1040 °C), highlighting the difficulty in controlling the particle size. A method to control the particle size of rod-shaped ε-Fe2O3 has yet to be developed. In this work, we report a synthetic method to prepare rod-shaped ε-Fe2O3 nanocrystals with a wide range of calcination temperatures to control the particle size and investigate a long-standing problem: the mechanism of anisotropic crystal growth of rod-shaped ε-Fe2O3.
Here, we report the synthesis of rod-shaped ε-Fe2O3 nanocrystals based on the sol–gel technique using β-FeO(OH) as a seed with a SiO2 matrix. X-ray powder diffraction (XRPD) and Rietveld analyses indicate that ε-Fe2O3 can be obtained by calcination over a wide temperature range (i.e., 800–1000 °C). Transmission Electron Microscopy (TEM) shows that the size of the rod-shaped crystals is well controlled over a wide range of calcination temperatures. The anisotropic crystal growth of rod-shaped ε-Fe2O3 can be explained using the surface energy and anisotropic adsorption of barium on the crystal surface.
Materials and methods
Materials
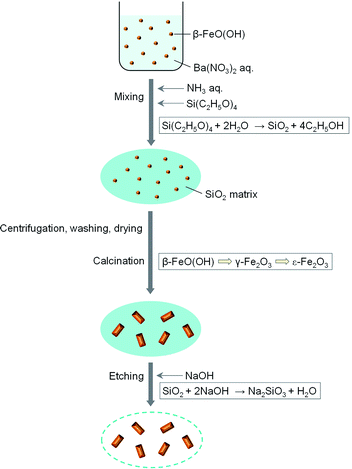
Fig. 1 schematically illustrates the synthesis of rod-shaped ε-Fe2O3 nanocrystals based on the sol–gel technique using β-FeO(OH) as a seed with a SiO2 matrix. Barium nitrate (Ba(NO3)2) (0.5 g) was added to water-dispersible β-FeO(OH) (4 g) solution (420 mL) (Taki Chemical; Fe–C10). An aqueous solution of 25% ammonia (19.2 mL) was added to a β-FeO(OH) dispersed solution. The mixture was stirred at 50 °C for 30 min. Then tetraethoxysilane (TEOS, Si(C2H5O)4) (24 mL) was added, and the solution was stirred at 50 °C for 20 h. The resultant orange gel was collected by centrifugation, washed with water, and dried at 60 °C for 1 day. The obtained orange powder was calcinated at 800–1000 °C for 4 h in air. The calcinated powder was etched with a NaOH aqueous solution at 70 °C to remove the SiO2 matrix that covered the iron oxide nanocrystals. The etched powder was washed with hydrochloric acid. In this work, we prepared 7 samples calcinated at different temperatures: 800 °C (1), 850 °C (2), 875 °C (3), 900 °C (4), 950 °C (5), 975 °C (6), and 1000 °C (7).Physical measurements
XRPD patterns were measured by a Rigaku Ultima IV using Cu Kα (λ = 1.5418 Å). Rietveld analyses for the XRPD patterns were performed using Rigaku PDXL software. TEM images were acquired using a JEOL JEM 2000EX. TEM energy-dispersive X-ray spectroscopy (TEM-EDX) was performed using a JEOL JEM 2010F. Raman spectra were measured by NRS-5500 Laser Raman Spectrometer (JASCO Corporation, Japan). Magnetic measurements were performed using a Quantum Design MPMS superconducting quantum interference device (SQUID) magnetometer.Results and discussion
Crystal structure, morphology, and magnetic properties of the nanocrystals
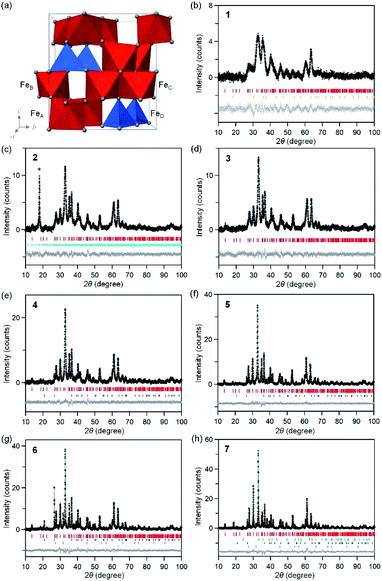
Fig. 2 shows the XRPD patterns with Rietveld analyses of the obtained samples. Sample 1 contains 97.2% of ε-Fe2O3 with an orthorhombic crystal structure in the Pna21 space group and lattice constants of a = 5.064(8) Å, b = 8.729(14) Å, and c = 9.610(9) Å (Fig. 2b and S1, Table S1†). In addition, a slight amount of γ-Fe2O3 with a cubic crystal structure in the Fd![[3 with combining macron]](https://www.rsc.org/images/entities/char_0033_0304.gif) m space group and a lattice constant of a = 8.299(4) Å) is present. Samples 2–6 consist of ε-Fe2O3 as a single phase of iron oxide (Fig. 2c–g). In sample 7, ε-Fe2O3 is the dominant phase but a slight amount of α-Fe2O3 with a hexagonal crystal structure in the R
m space group and a lattice constant of a = 8.299(4) Å) is present. Samples 2–6 consist of ε-Fe2O3 as a single phase of iron oxide (Fig. 2c–g). In sample 7, ε-Fe2O3 is the dominant phase but a slight amount of α-Fe2O3 with a hexagonal crystal structure in the R![[3 with combining macron]](https://www.rsc.org/images/entities/char_0033_0304.gif) c space group and lattice constants of a = 5.0353(9) Å and c = 13.752(3) Å is generated as a nominal phase (Fig. 2h). Fig. S2† shows the phase fraction versus temperature in a phase diagram for iron oxide. A single-phase of ε-Fe2O3 is obtained in a wide calcination temperature range. In the low calcination temperature region, a slight amount of γ-Fe2O3 appears. On the other hand, α-Fe2O3 is generated as a nominal phase in the high calcination temperature region. This phase diagram is consistent with the previous study, which reported that ε-Fe2O3 is generated as a stable intermediate phase between γ-Fe2O3 and α-Fe2O3.29
c space group and lattice constants of a = 5.0353(9) Å and c = 13.752(3) Å is generated as a nominal phase (Fig. 2h). Fig. S2† shows the phase fraction versus temperature in a phase diagram for iron oxide. A single-phase of ε-Fe2O3 is obtained in a wide calcination temperature range. In the low calcination temperature region, a slight amount of γ-Fe2O3 appears. On the other hand, α-Fe2O3 is generated as a nominal phase in the high calcination temperature region. This phase diagram is consistent with the previous study, which reported that ε-Fe2O3 is generated as a stable intermediate phase between γ-Fe2O3 and α-Fe2O3.29
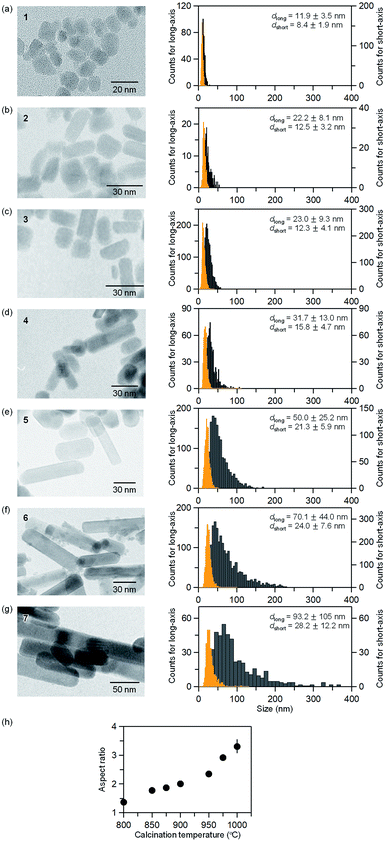
Fig. 3 and Table S2† show the TEM images of the samples and the obtained particle size distributions. In sample 1, the nanoparticles have an almost cubic shape with average sizes of 11.9 ± 3.5 nm for the long axis and 8.4 ± 1.9 nm for the short axis. The particle size distribution follows a log-normal distribution (Fig. S3†). The aspect ratio (the long axis to the short axis) of 1 is 1.4. In sample 2, the average sizes of the long and short axes are 22.2 ± 8.1 nm and 12.5 ± 3.2 nm, respectively. The aspect ratio is 1.8. As the calcination temperature increases, in samples 3–7, the size of the long axis abruptly increases while the size of the short axis gradually increases (i.e., the aspect ratio increases as shown in Fig. 3h). In sample 7, the nanoparticle has an elongated shape, and the average sizes of the long and short axes are 93.2 ± 105 nm and 28.2 ± 12.2 nm, respectively. This gives an aspect ratio of 3.3. As the calcination temperature increases, the long axis grows, leading to an elongated rod-shape. In the case of the reported spherical-shaped particles, changing the calcination temperature controls the size. For example, the diameter is 5.5 ± 1.6 nm at 902 °C, 5.6 ± 1.6 nm at 951 °C, and 7.8 ± 2.7 nm at 1002 °C.32 The particle sizes are considerably smaller than the rod-shaped ε-Fe2O3 synthesized by the present method. This difference indicates that barium promotes crystal growth of ε-Fe2O3.
Fig. S4† shows the magnetic hysteresis loops at room temperature up to 7 Tesla. The magnetic coercive field (Hc) value increases as the calcination temperature increases (i.e., the particle size increases). This observed trend corresponds to the reported trend where Hc increases as the particle size increases because the superparamagnetic effect operates in a small particle region.32,36,37 The magnetization values for 1–5 become higher as the calcination temperature increases. However, in 6 and 7, the magnetization values are low, even though the calcination temperature is high. One possible reason for the low magnetization is the formation of a slight amount of α-Fe2O3 (Fig. S5†), which is not observed in the XRD measurement.38 Another reason, it is speculated that when the particle shape becomes elongated into a rod, the particles are likely to overlap with each other due to the magnetic force. The rod-shaped ε-Fe2O3 particle is confirmed to be a single domain magnet.35 In such a case, the magnetic moments of ε-Fe2O3 particles may cancel each other. Consequently, the net total magnetization becomes smaller.
The mechanism of anisotropic crystal growth
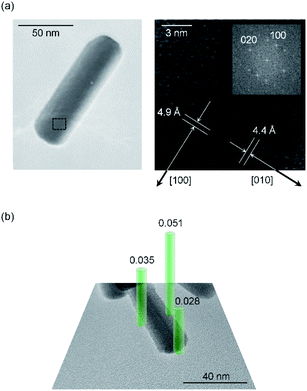
Next, the origin of high anisotropic crystal growth of rod-shaped ε-Fe2O3 is examined. The TEM images show that the ε-Fe2O3 particle is a single crystal and the longitudinal direction of rod-shaped ε-Fe2O3 is the crystallographic a-axis (i.e., the [100] direction) (Fig. 4a).39 Hence, rod-shaped ε-Fe2O3 nanocrystal is a rectangular-type rod with the long axis in the [100] direction (Fig. S6†).To understand the anisotropic crystal growth of the nano-rod along the [100] direction, we calculated the surface energies of the (hkl) planes, αhkl, based on the binding energy of each surface. αhkl is expressed by αhkl = ΣEhkl/Shkl, where ΣEhkl is the sum of the binding energies of the broken bonds at the (hkl) plane and Shkl is the area of the lattice plane.40 Assuming equal binding energies between all Fe and O sites, the magnitude of the surface energies for typical lattice planes are calculated as: 19.2 nm−2 (100), 18.7 nm−2 (010), 13.4 nm−2 (001), 19.0 nm−2 (110), 11.9 nm−2 (011), 19.7 nm−2 (101), and 17.8 nm−2 (111) (Table S3†). The (100), (101), and (111) planes possess high surface energies (Fig. 5), whereas the (001) and (011) planes show low surface energies (Fig. S7†). Hence, the (100), (101), and (111) planes are candidates for the growth crystallographic planes.
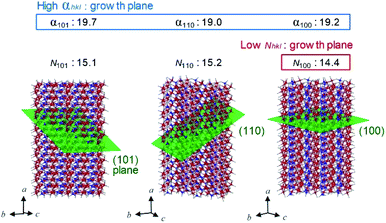 | ||
| Fig. 5 Schematic of the lattice planes (green plane), values of surface energy (αhkl, nm−2), and number of FeO6-broken bond per area (Nhkl, nm−2) for the rod-shaped ε-Fe2O3 nanocrystals (Table S3†). Red, blue, and gray spheres in the crystal structure indicate the Fe at octahedral site, Fe at tetrahedral site, and O, respectively. Large α and small N values indicate the easy-growth plane. | ||
Next, we focused on the barium adsorption effect. Fig. 4b shows the results of EDX measurement in TEM to investigate the distribution of the barium around the particles. The green cylinders indicate the areas of the EDX measurements. The calculated molar ratios of barium for each area with respect to the Fe2O3 formula indicate larger values at the longitudinal side of the rods compared to the edge of the short axis. These results suggest that a larger amount of barium is adsorbed on the longitudinal side of the rod than on the edge surface of the growth direction. We considered the mechanism of anisotropic crystal growth of ε-Fe2O3 from the viewpoint of anisotropic adsorption of barium on the surface of ε-Fe2O3 particles. In the calcination process, melting SiO2 matrix (Si4+ and O2−) and Ba+ ion exist around ε-Fe2O3 particles. Since Ba+ ion takes an octahedral BaO6 coordination geometry with oxygen,41,42 barium should be adsorbed on the surface of ε-Fe2O3 in the form of pseudo-octahedral BaO6. On the other hand, on the surface of ε-Fe2O3 particles, there are two kinds of broken bonds (i.e., broken octahedral FeO6 and broken tetrahedral FeO4). Since BaO6 should be adsorbed at the octahedral FeO6 site rather than at the tetrahedral FeO4 site, a surface containing a large amount of FeO6-broken bonds should be covered with adsorbed barium, suppressing crystal growth (i.e., the growth surface should be the one with a small amount of FeO6-broken bonds). We estimated the number of FeO6-broken bonds per area, Nhkl. Fig. 5 and Table S3† show that the Nhkl values are 14.4 nm−2, 15.2 nm−2, and 15.1 nm−2 for (100), (110), and (101) planes, respectively. N100 shows the lowest value. These values indicate that the [100] direction, along the a-axis, can be the crystal growth direction because barium is less adsorbed on the surface of the (100) plane compared to other planes.
Conclusions
Rod-shaped ε-Fe2O3 nanocrystals are synthesized based on the sol–gel technique using β-FeO(OH) as a seed in the presence of a barium cation. In this method, changing the calcination temperature can control the size of rod-shaped ε-Fe2O3 nanocrystals. A low calcination temperature provides almost cubic rectangular-shaped ε-Fe2O3 nanocrystals, whereas a high calcination temperature provides elongated rod-shaped ε-Fe2O3 nanocrystals. Although the mechanism of anisotropic crystal growth of rod-shaped ε-Fe2O3 has been a long-standing issue, in this work, the surface energy and the anisotropic adsorption of barium on the surface of ε-Fe2O3 can explain the anisotropic crystal growth of the rod-shaped ε-Fe2O3 along the crystallographic a-axis. These findings should realize hard magnetic ferrite ε-Fe2O3 nanocrystals for practical applications and provide important knowledge about how to control the anisotropic crystal shape of the nanomaterials.Conflicts of interest
The authors declare no competing financial interest.Acknowledgements
The present research was supported in part by JSPS KAKENHI (16H06521) Coordination Asymmetry, JSPS Grant-in-Aid for Scientific Research (A) (20H00369), JSPS Grants-in-Aid for specially promoted Research (15H05697), A-STEP from JST, DOWA Technofond, and MEXT Q-LEAP (JPMXS 0118068681). We also acknowledge the Cryogenic Research Center, The University of Tokyo, and Nanotechnology Platform, which are supported by MEXT. We are grateful to Dr K. Imoto (the Univ. Tokyo), Mr Y. Araki (Univ. Tsukuba), and Ms. E. Noda (JASCO Co., Ltd) for the technical supports.Notes and references
- D. J. Craik, Magnetic oxides, Wiley, London, 1975 Search PubMed.
- The Physics of Ul-tra-High Density Magnetic Recording, ed. M. L. Plumer, J. van Ek, and D. Weller, Springer-Verlag, BerlinHei-delberg, 2001 Search PubMed.
- A. Goldman, Modern Ferrite Technology, 2nd edn, Springer, New York, 2006 Search PubMed.
- C. T. Yavuz, J. T. Mayo, W. W. Yu, A. Prakash, J. C. Falkner, S. Yean, L. Cong, H. J. Shipley, A. Kan, M. Tomson, D. Natelson and V. L. Colvin, Low-Field Magnetic Separation of Monodisperse Fe3O4 Nanocrystals, Science, 2006, 314, 964–967 CrossRef.
- Y. Nakamura, Advanced Technologies of Perpendicular Magnetic Recording, CMC Publishing, Tokyo, 2007 Search PubMed.
- S. Laurent, D. Forge, M. Port, A. Roch, C. Robic, L. V. Elst and R. N. Muller, Magnetic Iron Oxide Nanoparticles: Synthesis, Stabilization, Vectorization, Physicochemical Characterizations, and Biological Applications, Chem. Rev., 2008, 108, 2064–2110 CrossRef CAS.
- G. A. Challis, Pyrite–haematite alteration as a source of colour in red beds and regolith, Nature, 1975, 255, 471–472 CrossRef CAS.
- R. F. Ziolo, E. P. Giannelis, B. A. Weinstein, M. P. O'Horo, B. N. Ganguly, V. Mehrotra, M. W. Russell and D. R. Huffman, Matrix-mediated synthesis of nanocrystalline γ-Fe2O3: a new optically transparent magnetic material, Science, 1992, 257, 219–223 CrossRef CAS.
- E. T. Lacheisserie, D. Gignoux and M. Schlenker, Magnetism: II-Materials & Applications, Kluwer, Norwell, 2002 Search PubMed.
- F. X. Redl, K.-S. Cho, C. B. Murray and S. O'Brien, Three-dimensional binary superlattices of magnetic nanocrystals and semiconductor quantum dots, Nature, 2003, 423, 968–971 CrossRef CAS.
- J. Jin, S. Ohkoshi and K. Hashimoto, Giant Coercive Field of Nanometer-Sized Iron Oxide, Adv. Mater., 2004, 16, 48–51 CrossRef CAS.
- S. Ohkoshi and H. Tokoro, Hard Magnetic Ferrite: ε-Fe2O3, Bull. Chem. Soc. Jpn., 2013, 86, 897–907 CrossRef CAS.
- E. Tronc, C. Chanéac and J. P. Jolivet, Structural and magnetic characterization of ε-Fe2O3, J. Solid State Chem., 1998, 139, 93–104 CrossRef CAS.
- M. Kurmoo, J. L. Rehspringer, A. Hutlova, C. D'Orléans, S. Vilminot, C. Estournès and D. Niznansky, Formation of Nanoparticles of ε-Fe2O3 from Yttrium Iron Garnet in a Silica Matrix: An Unusually Hard Magnet with a Morin-Like Transition below 150 K, Chem. Mater., 2005, 17, 1106–1114 CrossRef CAS.
- Y. Kusano, T. Fujii, J. Takada, M. Fukuhara, A. Doi, Y. Ikeda and M. Takano, Epitaxial Growth of ε-Fe2O3 on Mullite Found through Studies on a Traditional Japanese Stoneware, Chem. Mater., 2008, 20, 151–156 CrossRef CAS.
- E. Taboada, M. Gich and A. Roig, Nanospheres of Silica with an ε-Fe2O3 Single Crystal Nucleus, ACS Nano, 2009, 3, 3377–3382 CrossRef CAS.
- J. Jin, K. Hashimoto and S. Ohkoshi, Formation of spherical and rod-shaped ε-Fe2O3nanocrystals with a large coercive field, J. Mater. Chem., 2005, 15, 1067–1071 RSC.
- E. Tronc, C. Chaneac, J. P. Jolivet and J. M. Greneche, Spin collinearity and thermal disorder in ε-Fe2O3, J. Appl. Phys., 2005, 98, 053901 CrossRef.
- M. Gich, C. Frontera, A. Roig, E. Taboada and E. Molins, High- and Low-Temperature Crystal and Magnetic Structures of ε-Fe2O3 and Their Correlation to Its Magnetic Properties, Chem. Mater., 2006, 18, 3889–3897 CrossRef CAS.
- S. Sakurai, K. Tomita, K. Hashimoto, H. Yashiro and S. Ohkoshi, Preparation of the Nanowire Form of ε-Fe2O3 Single Crystal and a Study of the Formation Process, J. Phys. Chem. C, 2008, 112, 20212–20216 CrossRef CAS.
- Y.-C. Tseng, N. M. Souza-Neto, D. Haskel, M. Gich, C. Frontera, A. Roig, M. Veenendaal and J. Nogués, Nonzero orbital moment in high coercivity ε-Fe2O3 and low-temperature collapse of the magnetocrystalline anisotropy, Phys. Rev. B: Condens. Matter Mater. Phys., 2009, 79, 094404 CrossRef.
- A. Namai, S. Sakurai, M. Nakajima, T. Suemoto, K. Matsumoto, M. Goto, S. Sasaki and S. Ohkoshi, Synthesis of an Electromagnetic Wave Absorber for High-Speed Wireless Communication, J. Am. Chem. Soc., 2009, 131, 1170–1173 CrossRef CAS.
- J. Tuček, S. Ohkoshi and R. Zbořil, Room-temperature ground magnetic state of ε-Fe2O3: in-field Mössbauer spectroscopy evidence for collinear ferrimagnet, Appl. Phys. Lett., 2011, 99, 253108 CrossRef.
- S. Ohkoshi, S. Kuroki, S. Sakurai, K. Matsumoto, K. Sato and S. Sasaki, Inside Cover: a Millimeter-Wave Absorber Based on Gallium-Substituted ε-Iron Oxide Nanomagnets, Angew. Chem., Int. Ed., 2007, 46, 8392–8395 CrossRef CAS.
- J. Tuček, R. Zbořil, A. Namai and S. Ohkoshi, ε-Fe2O3: an Advanced Nanomaterial Exhibiting Giant Coercive Field, Millimeter-Wave Ferromagnetic Resonance, and Magnetoelectric Coupling, Chem. Mater., 2010, 22, 6483–6505 CrossRef.
- A. Namai, M. Yoshikiyo, K. Yamada, S. Sakurai, T. Goto, T. Yoshida, T. Miyazaki, M. Nakajima, T. Suemoto, H. Tokoro and S. Ohkoshi, Hard magnetic ferrite with a gigantic coercivity and high frequency millimetre wave rotation, Nat. Commun., 2012, 3, 1035 CrossRef.
- S. Ohkoshi, A. Namai, M. Yoshikiyo, K. Imoto, K. Tamasaki, K. Matsuno, O. Inoue, T. Ide, K. Masada, M. Goto, T. Goto, T. Yoshida and T. Miyazaki, Multimetal-Substituted Epsilon-Iron Oxide ε-Ga0.31Ti0.05Co0.05Fe1.59O3 for Next-Generation Magnetic Recording Tape in the Big-Data Era, Angew. Chem., Int. Ed., 2016, 55, 11403–11406 CrossRef CAS.
- Y. Ding, J. R. Morber, R. L. Snyder and Z. L. Wang, Nanowire Structural Evolution from Fe3O4 to ε-Fe2O3, Adv. Funct. Mater., 2007, 17, 1172–1178 CrossRef CAS.
- S. Sakurai, A. Namai, K. Hashimoto and S. Ohkoshi, First Observation of Phase Transformation of All Four Fe2O3 Phases (γ → ε → β → α-Phase), J. Am. Chem. Soc., 2009, 131, 18299–18303 CrossRef CAS.
- G. Carraro, D. Barreca, C. Maccato, E. Bontempi, L. E. Depero, C. de J. Fernández and A. Caneschi, Supported ε and β iron oxide nanomaterials by chemical vapor deposition: structure, morphology and magnetic properties, CrystEngComm, 2013, 15, 1039 RSC.
- B. David, N. Pizúrová, P. Synek, V. Kudrle, O. Jašek and O. Schneeweiss, -Fe2O3 nanoparticles synthesized in atmospheric-pressure microwave torch, Mater. Lett., 2014, 116, 370–373 CrossRef CAS.
- S. Ohkoshi, A. Namai, K. Imoto, M. Yoshikiyo, W. Tarora, K. Nakagawa, M. Komine, Y. Miyamoto, T. Nasu, S. Oka and H. Tokoro, Nanometer-size hard magnetic ferrite exhibiting high optical-transparency and nonlinear optical-magnetoelectric effect, Sci. Rep., 2015, 5, 14414 CrossRef CAS.
- A. Sivkov, E. Naiden, A. Ivashutenko and I. Shanenkov, Plasma dynamic synthesis and obtaining ultrafine powders of iron oxides with high content of ε-Fe2O3, J. Magn. Magn. Mater., 2016, 405, 158–168 CrossRef CAS.
- H. Tokoro, W. Tarora, A. Namai, M. Yoshikiyo and S. Ohkoshi, Direct Observation of Chemical Conversion from Fe3O4 to ε-Fe2O3 by a Nanosize Wet Process, Chem. Mater., 2018, 30, 2888–2894 CrossRef CAS.
- S. Ohkoshi, A. Namai, T. Yamaoka, M. Yoshikiyo, K. Imoto, T. Nasu, S. Anan, Y. Umeta, K. Nakagawa and H. Tokoro, Mesoscopic bar magnet based on ε-Fe2O3 hard ferrite, Sci. Rep., 2016, 6, 27212 CrossRef CAS.
- In metal alloy systems, the coercive field increases as the rod-shaped particles become longer due to the dipole interaction between the particles.37 In ε-Fe2O3, the magnitude of the coercive field does not change due to the particle shape. That is, spherical- and rod-shaped ε-Fe2O3 exhibit similar coercive fields (∼20 kOe at room temperature).32,35 Hence, the aforementioned dipole interaction is negligible. One possible reason that the dipole interaction is negligible may be the strong crystal magnetic anisotropy in ε-Fe2O3..
- P. G. B. Gueye, J. L. Sánchez, E. Navarro, A. Serrano and P. Marín, Control of the Length of Fe73.5Si13.5Nb3Cu1B9 Microwires to Be Used for Magnetic and Microwave Absorbing Purposes, ACS Appl. Mater. Interfaces, 2020, 12, 15644–15656 CrossRef CAS.
- J. López-Sánchez, A. Serrano, A. del Campo, M. Abuín, E. Salas-Colera, A. Muñoz-Noval, G. R. Castro, J. de la Figuera, J. F. Marco, P. Marín, N. Carmona and O. Rodríguez de la Fuente, Self-assembly of iron oxide precursor micelles driven by magnetic stirring time in sol–gel coatings, RSC Adv., 2019, 9, 17571–17580 RSC.
- The short-axis direction is diverse, i.e., [010], [011], or [013] are observed as the short-axis directions..
- J. Pelleg, L. Z. Zevin, S. Lungo and N. Croitoru, Reactive-sputter-deposited TiN films on glass substrates, Thin Solid Films, 1991, 197, 117–128 CrossRef CAS.
- L. Liu, A Dense Modification of BaO and Its Crystal Structure, J. Appl. Phys., 1971, 42, 3702–3704 CrossRef CAS.
- R. B. Elo, S. P. Murarka and R. A. Swalin, A thermo-chemical study of the defect structure of barium oxide, J. Phys. Chem. Solids, 1973, 34, 97–106 CrossRef CAS.
Footnote |
| † Electronic supplementary information (ESI) available: Results of crystal structural analyses, particle sizes obtained by TEM images, magnetic hysteresis loops, crystal shape and crystallographic direction of ε-Fe2O3 crystal, and surface energy in ε-Fe2O3. See DOI: 10.1039/d0ra07256g |
| This journal is © The Royal Society of Chemistry 2020 |

