 Open Access Article
Highly cost-effective platinum-free anion exchange membrane electrolysis for large scale energy storage and hydrogen production
Immanuel Vincent ,
Eun-Chong Lee and
Hyung-Man Kim
 *
*
Power System and Sustainable Energy Laboratory, High Safety Vehicle Core Technology Research Center, Department of Nanoscience and Engineering, INJE University, 607 Eobang-Dong, Gimhae-si, Gyongsangnam-do 621-749, Republic of Korea. E-mail: mechkhm@inje.ac.kr; Fax: +82 55 324 1723; Tel: +82 55 320 3666
First published on 9th October 2020
Abstract
Anion exchange membrane (AEM) electrolysis eradicates platinum group metal electrocatalysts and diaphragms and is used in conventional proton exchange membrane (PEM) electrolysis and alkaline electrolysis. It can produce pressurised hydrogen by using low cost non-noble metal catalysts. However, the performances are still lower than that of the conventional PEM electrolysis technology. In this study, we addressed the performance issue by using a novel combination of Ni–Fe–Ox for oxygen evolution reaction (OER) and Ni–Fe–Co hydrogen evolution reaction (HER) electrodes with a PBI anion exchange membrane. The Ni–Fe–Ox and Ni–Fe–Co electrodes exhibit exceptionally high catalytic activity, requiring over potentials that are as low as 236 and 84 mV dec−1, respectively, for OER and HER to occur. These electrocatalysts exhibits excellent durability which can be used as oxygen evolution and hydrogen evolution catalysts for long term electrolysis. The high rate capability of 1000 mA cm−2 at 1.9 V and 60 °C demonstrates the potential of the combined membrane electrode assembly. The best performance, which is comparable to those of commercial PEM electrolysis systems, is thus an affordable alternative to this technology. In addition to that, the AEM electrolysis is promising on a multi-scale level for long-term hydrogen production.
1. Introduction
Sustainable and renewable energy is the ultimate solution for the current global energy demand. The focus of sustainable and renewable energy sources, such as solar and wind energy, has intensified worldwide owing to greenhouse gas emission and depletion of fossil fuels.1 The amount of achievable energy, such as solar and wind energy, varies because of the climatic conditions throughout the year.2 The electricity produced from solar, wind, etc. leads to a discontinuity from supply to demand, which increases when there is a high electricity demand. To overcome this inconsistency, it is important to store the energy generated during peak production days and use it when demand exceeds production.3 To provide an uninterrupted power supply, low-temperature electrolysis is a promising solution for the storage of excess and intermittent electric energy into chemical energy and for converting it back from chemical energy carriers.4 The electricity is stored as hydrogen by low-temperature water electrolysis technology and then converted back to electricity by using fuel cells on demand. This helps to overcome the disadvantages of the intermittency of solar and wind energy.5 However, hydrogen has been discussed as a promising energy carrier for a long time owing to its specific energy, renewability, and capability to release energy without the emission of CO2.6The hydrogen production via low-temperature electrolysis is benefited from unlimited water resources, stable output, high product purity, feasibility of large-scale production, and the capability of integrating renewable energy as power sources.7,8 There are two main water electrolysis technologies that produce H2 at low temperatures, which can be distinguished by the electrolyte used in the electrolysis cell: alkaline electrolysis (AE) and proton exchange membrane (PEM) electrolysis.7 The commercially available low-temperature technologies are AE and PEM electrolysis technologies, which are already commercially available, reaching an energy conversion efficiency of approximately 80%.9 PEM electrolysis demands expensive noble metal electro-catalysts, such as Pt and IrO2, owing to the limitations of a harsh acidic environment.10 Nafion-based PEM and titanium stack components directly increase the capital cost of the electrolysis process.11 This hinders the usage of this technology on a large-scale level. Another conventional technology is AE technology, which is a mature technology; however, it cannot be linked with the renewable energies of solar, wind, etc. for power generation owing to its inability to maintain high-pressure hydrogen because of the use of a porous diaphragm and liquid electrolyte.12
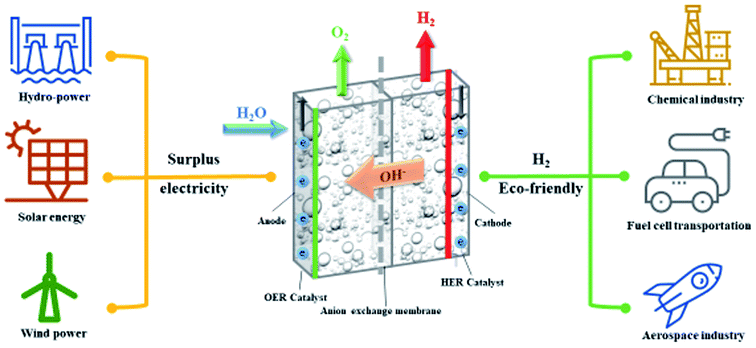
Anion exchange membrane (AEM) electrolysis technology is an emerging new technology, which is at its early stage of development, and it is shown in Fig. 1. The first research article was published in 2012 by Leng et al.13 This technology was developed by merging the merits of both conventional alkaline and PEM electrolysis technologies. In AEM electrolysis, low-cost catalytic materials were adopted from alkaline electrolysis and the solid polymer electrolyte architecture, which was adopted from PEM electrolysis technology.14 Thus, it is expected to produce pressured hydrogen using low cost catalysts by solid polymer electrolyte technology. The membrane electrode assembly (MEA) of an AEM electrolyser was constructed by using a low-cost transient metal compound catalyst and anion exchange membrane.
Overall, water electrolysis technology comprises two simultaneous half-cell reactions, which are the oxygen evolution reaction (OER) and hydrogen evolution reaction (HER). The thermodynamic onset potential of the water splitting reaction by water electrolysis techniques is 1.23 V at room temperature. However, in reality, the voltage requirement increases owing to the many resistances involved in the kinetics of the electrochemical reaction, the design of the cell, and the components of the electrolyser, e.g., resistances such as ohmic potential, activation over potential, and mass transport limitation. An electro-catalyst should decrease the over potential and enhance the performance of the electrolyser. Selection of the electrocatalyst is the bottleneck to the process of AEM electrolysis. Conventional noble metal electrocatalysts, such as Ir, Pt, Ru, and their oxides, have been used in AEM electrolysis by some researchers.13,15 However, these catalysts are extremely expensive, which directly increases the capital cost of this electrolysis process. The main advantage of this AEM electrolysis is that it uses an inexpensive, abundant, and non-platinum group metals. In AEM electrolysis, thus far, Ni, Ni–Fe alloys, graphene, Pb2Ru2O6.5, and Cu0.7CO2.3O4 have been used as OER catalysts, whereas CuCoOx, Ni–Mo, Ni/CeO2–La2O3/C, Ni, and graphene have been used as HER catalysts.16 The electrocatalyst should be stable in oxidative and reductive environments. Another important aspect of AEM electrolysis is the AEM. The AEM plays vital role on the electrolyser's performance by its ion conductivity, chemical stability and mechanical stability. The commercially available A201 (Tokuyama Corp., Japan), Fumatech FAA-series (Fumatech Corp., Germany) and Sustainion membrane (Dioxide Material Corp., USA) are the most investigated AEM for electrolysis.17
The performance of an electrolyser is mainly dependent on MEA components, such as the AEM, electrocatalyst, gas diffusion layer (GDL), and structure of the flow field.18 These are the main parameters that determine the performance of an AEM electrolyser. In the early stage of its development, few combinations of MEA components were selected based on activity of the catalyst and ionic conductivity of AEM. Leng et al.13 fabricated MEA by A-201, AEM with conventional OER and HER noble metal catalysts such as IrO2 and Pt black, which showed the performance of 399 mA cm−2 at 1.80 V. Faraj et al.19 fabricated a MEA using the LDPE-g-VBC-Dabco (synthesized) AEM and Acta 3030 (CuCoOx) and Acta 4030 (Ni/(CeO2–La2O3)/C) (Acta Spa, Italy) as OER and HER catalysts. The electrolyzer performance was 460 mA cm−2 at 2.1–2.2 V. Pavel et al.20 fabricated the MEA by using A-201, AEM, with Acta 3030 (CuCoOx) and Acta 4030 (Ni/(CeO2–La2O3)/C) OER and HER catalysts, respectively. The maximum performance achieved by the electrolyzer was 470 mA cm−2 at 1.9–2.01 V. Parrondo et al.15 fabricated their MEA with an inexpensive polysulfone (PSF) AEM with Ru perchlorate and Pt as OER and HER catalysts. The achieved electrolyzer performance was 400 mA cm−2 at 1.8 V.
The selection of the electrocatalyst and AEM is key to the success of an AEM electrolyser. The recent literatures show Ni, Fe and Co alloy catalyst shown higher activities in alkaline media.21–24 However, these combinations have not tried in the AEM electrolysis extensively. So, in this work we have chosen the Ni–Fe–Ox as OER catalyst. Because, Ni–Fe-based density functional theory (DFT) studies have shown that Ni–Fe–Ox modifies the bridge of the Ni–γ-Fe2O3 Gibbs energy of the adsorption of the intermediate H atom (VGH*), which increases the catalytic activity, and the activity of this alloy is comparable to that of conventional Pt group-based catalysts.25 The Ni–Fe–Ox catalyst coated in the form of an anode has not been studied owing to the contamination of Ni and Co in alkaline media. Pyrochlores have shown good activity towards oxidation for the OER.26 On the other hand, the Ni, Fe, and Co alloy showed good electrochemical activity for the HER.27 Thus, in this study, we used Ni–Fe–Ox and N–Fe–Co alloy electrocatalysts for the OER and HER, respectively. Catalysts coated on the GDL were used to evaluate their electrochemical activities.
Recently, PBI-based anion exchange membranes received much attention, which were used as AEM for AEM electrolysis.28 The PBI based anion exchange membrane shows high thermal (Tg = 425–436 °C), mechanical and chemical stability. Also, it exhibits rendered anion conducting when doping with KOH. The major advantage of this PBI based AEMs is, it does not show cationic degradation due to hydroxyl ion attack from nucleophilic displacement and Hofmann-elimination reactions.29 The performance and stability in the alkaline environment were satisfactory. So, we adopt the PBI based AEM for this study as a solid polymer electrolyte. However, fabrication and characterisation of these MEAs by using this membrane (PBI) and this novel electrocatalyst combination were performed. Although, the performance of the AEM electrolysis was previously studied by a few researchers, the literature is still limited, and there is a lack of information on the electrochemical characterisations of the components of the MEA. To find the electrochemical suitability of the long-term electrolysis, complete electrochemical characterisations of the OER and HER catalysts and the impedance studies are still lacking, which necessary to further development of this technology.
Thus, in this study, we electrochemically characterised both the OER and HER electrodes by cyclic voltammetry (CV), linear sweep voltammetry (LSV), and chronoamperometry (CA) experiments. Additionally, we attempted to determine the resistances involved in the electrolysis by electrochemical impedance spectroscopy (EIS). We also report the performance and stability of the AEM electrolysis. In addition, we determined the efficiency of this technology and the cost reduction associated with this novel technology compared to that of conventional PEM electrolysis.
2. Experimental
2.1. Electrode fabrication, membrane electrode assembly and electrolysis cell set-up
The electrolysis reaction was carried out using a specially designed 5 cm2 AEM electrolyser, and the configuration is shown in Fig. 1. The PBI membrane was used as an anion exchange membrane in the MEA architecture. The MEA was prepared using the catalyst coated on substrate (CCS) method, and the OER and HER catalysts were coated on the Ni foam by spray coating. The AEM was soaked in a 1 M KOH before the reaction to convert it function group into OH− groups and to increase the ionic conductivity of the AEM.The homogenous catalyst ink solution was prepared by adding de-ionized water, ionomer (Sustainion® XB-7, Dioxide Material, USA), and catalyst powder (particle diameter of the Ni–Fe–Ox and Ni–Fe–Co were 0.5–1.7 mm), which was sonicated with ice for 15 min. Then the isopropyl alcohol added and sonicated for 10 min with ice. Then the slurry was ultra-sonicated for 10 min by the ultrasonic probe (the ultrasonic probe is Branson Digital Sonifier Model 102C) with ice. It is ensured that, there were no agglomeration found on the homogeneous ink. The uniformity of ink composition is very important to ensure concordant results. The well dispersed anode and cathode catalyst ink was brushed onto the surface of the Ni foam (80–110 ppi); American Elements, USA. Both the gas diffusion electrodes (GDEs) were dried at 80 °C for 2 h. The anode GDE was sintered at 340 °C for 30 min and the cathode GDE was sintered at 300 °C for 2 h, simultaneously. The loadings of the OER and HER catalysts were ∼5 mgcat cm−2, respectively. The Ni–Fe–Ox and Ni–Fe–Co coated on the Ni foam were used as the anode and cathode. The loading of the catalyst was 5 mgcat cm−2. The MEA was housed between Ti and graphite flow fields. A pair of Teflon gaskets was employed as a seal to avoid gas and liquid leakage. Stainless steel bars were used as end plates, and the anode and cathode electrical supply probes connected outside of the endplate. A 500 mL glass tank with circulated water was used as a reservoir. A double-headed peristaltic pump (model: BT 300 FJ CR pump, China) circulated the feedstock from the reservoir. The preheated 1 M KOH water circulated through the anode side using a peristaltic pump continuously. The electricity for the electrolysis experiments was supplied through a potentiostat VSP Biologic (Bio-Logic Science Instruments, Seyssinet-Pariset, France). The temperature was maintained at 60 °C using a water heating system (F12-ED; Julabo, Germany). The entire operation was controlled by EC Lab® software. The voltage and current data were recorded automatically by a computer.
2.2. Electrochemical characterisation of electrodes
The electrodes for the OER and HER were studied using a conventional three-electrode electrochemical glass cell. The working, counter, and reference electrodes were inserted in each compartment. The fabricated anodes or cathodes were the working electrodes directly for the OER and HER. The surface areas both electrodes were 1 cm2. The counter and reference electrodes were a platinum wire and mercury (Hg)/mercury oxide (Hg/HgO), respectively. However, it was converted back to Ag/AgCl for the convenience of comparing the results with those reported in the literature. The over potential mentioned for these experiments is based on the Ag/AgCl electrode. The working electrode surface was wiped with ethanol and ultra-pure water prior to the experiments. The experiments were carried out using 1 M KOH at 40 °C.2.3. Electrochemical characterisation of the OER and HER
Electrochemical experiments were conducted using a Bio-Logic potentiostat/galvanostat model VSP with a booster (Bio-Logic Science Instruments, Seyssinet-Pariset, France). All experiments were controlled, and data were collected by the EC Lab. Cyclic voltammetry experiments were run between 0.2 and 0.57 V vs. Ag/AgCl for five cycles at a scan rate of 5 mV s−1. Then, linear sweep voltammetry experiments were conducted for the following ranges: 0 to 1.2 V for the OER and −0.6 V to 0 V vs. Ag/AgCl for the HER. Prior to performing experiments on the working electrode, which was polarised at 1.3 V for 5 min and at 0.8 V for 10 min to remove oxides from the surface of the electrode, we reported the fourth cycle of the CV from the total of five cycles in the CV. The oxygen was saturated with a 1 M KOH solution for the OER experiments. Similarly, for the HER reaction, the hydrogen was saturated with a 1 M KOH solution.2.4. Electrochemical impedance spectroscopy (EIS)
EIS experiments were conducted at a constant voltage (potentiostat/galvanostat impedance). A small perturbation voltage in the frequency range of 100 kHz to 50 mHz superimposed on the DC polarisation current. The amplitude of the AC signal was maintained at less than 10% of the applied DC current. We developed an equivalent circuit model and fitted it using the EC software.3. Results and discussion
3.1. Electrochemical characterisation of electrodes
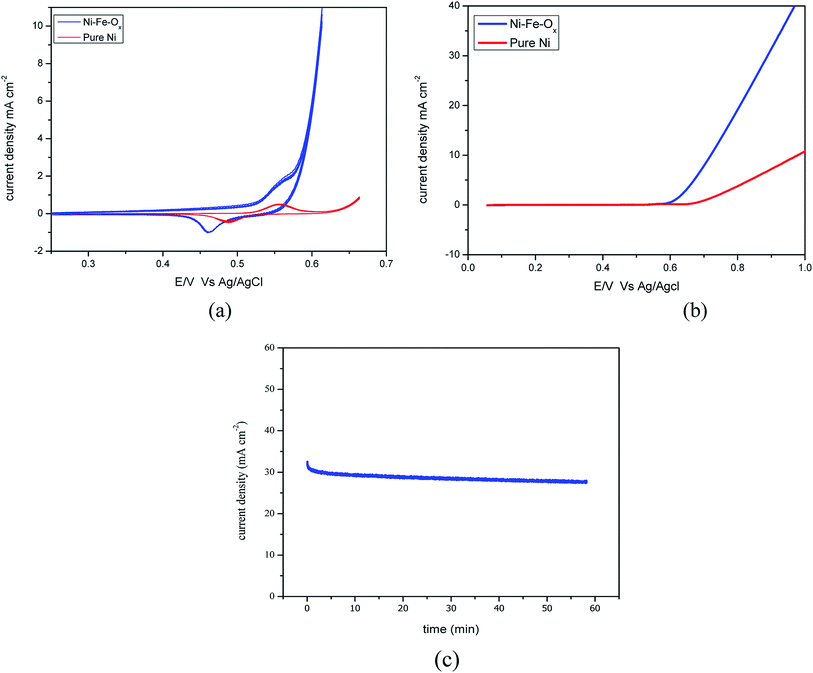
The responses of the cyclic voltammetry experiments are shown in Fig. 2(a), which shows the obtained voltages for Ni–Fe–Ox and pure Ni. The onset potential was 0.085 V for this reaction, and the lowest onset potential is favourable for any electrocatalyst. However, here, the obtained onset potential is higher than for the conventional Pt and Ir electrode. Fig. 2(a) shows the oxidation and reduction characteristics, oxidation occurs at 0.56 V for Ni–Fe–Ox and reduction occurs at 0.45 V. Likewise, oxidation occurs at 0.57 V and reduction occurs at 0.48 V for pure Ni. The maximum absorption of ions showed a high current density at an over potential of 0.56 V was 6 mA cm−2 for Ni–Fe–Ox. However, the pure Ni showed the current density at the potential of 0.57 V was 0.5 mA cm−2. The difference in the absorbed current density was ten times lower than the Ni–Fe–Ox.
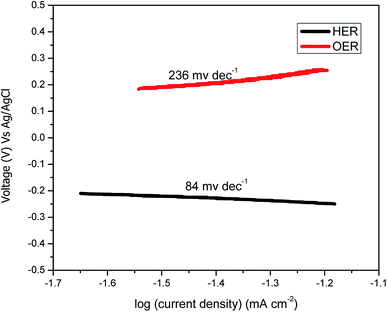
Fig. 2(b) shows the LSV for the scan rate of 5 mV s−1 from 0 to 1 V for Ni–Fe–Ox and pure Ni. The OER began at approximately 0.6 V, and then, the current density sharply increased until 1 V whereas for pure Ni the OER begin at 0.7 V then sharply increased. The achieved current density at 0.8 V was 21 mA cm−2, which showed a higher performance than the non-noble metal electrocatalyst. However, the pure Ni showed the current density at the potential of 0.8 V was 4.1 mA cm−2. The performance of Ni–Fe–Ox, three times higher than the pure Ni. The slopes were delineated and calculated between the obtained cell voltages and logarithmic current density. The Tafel slopes, including the values for both the OER and HER electrodes, are shown in Fig. 4. The calculated Tafel slope for the Ni–Fe–Ox electrode was 236 mV dec−1, and a similar value was reported in the literature previously.33 The OER exhibited two different Tafel regions. The first Tafel slope is relevant to the OER, and the second slope may be related to the state of the oxide surface. However, the Tafel slopes are higher than for the conventional Ir and Pt catalysts which are 55 and 60 mV dec−1.34
Fig. 2(c) shows the chronoamperometric (CA) tests for determining the OER catalyst stability. The short-term stability of the OER (Ni–Fe–Ox) electrode was evaluated via CA tests for 1 h at 0.6 V. During the test, the current responses were observed for 0.6 V. The current density was insignificantly varied from the beginning to the end for 1 h. EIS was performed before and after the stability test, and the resistance was the same before and after the experiment. Both results suggest that the catalyst is highly stable under alkaline condition. This was due to the smaller the smaller onset potential with a high current density. The current produced by the electrode was higher than that for the pure Ni. However, the electrode showed good performance and stability in the alkaline environment. Thus, the OER (Ni–Fe–Ox) catalyst is suitable for long-term hydrogen production via the AEM electrolysis.
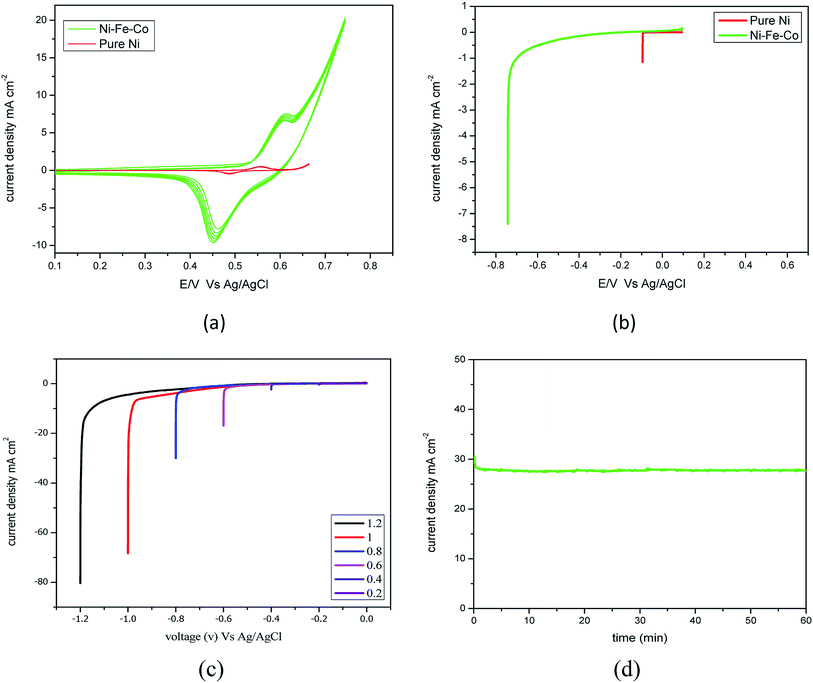
Fig. 3(a) shows the oxidation and reduction characteristics, and oxidation and reduction occurs at −0.6 V and −0.45 V for Ni–Fe–Co. The maximum desorption of ions showed a high current density at an over potential of −0.45 V at 10 mA cm−2 for Ni–Fe–Co. However, the pure Ni showed the current density at the potential of 0.48 V was 0.5 mA cm−2. The difference in the current was 20 times lower than the Ni–Fe–Co. Fig. 3(b) shows the HER activity for the scan rate of 5 mV s−1 at −0.6 V for Ni–Fe–Co and pure Ni. The achieved current density was 7.5 mA cm−2 by Ni–Fe–Co, however, the pure Ni showed the current density at the potential of −0.6 V was 1.5 mA cm−2.
Fig. 3(c) shows polarisation curves for Ni–Fe–Co for voltages from −0.2 to −1.2 V. The curve shows the onset potential is −0.05 V for the over potential, and the obtained current densities were 26 and 80 mA cm−2 for −0.6 and −1.2 V, respectively. As expected, a higher set voltage increased the current density. At −0.6 V, the obtained current density was 10 mA cm−2. The catalytic activity of this catalyst was compared with the currently available state-of-the-art HER catalyst. Additionally, the Tafel slope of the Ni–Fe–Co for the HER reaction was ∼84 mV dec−1. Additionally, we assessed the durability of the Ni–Fe–Co catalyst. The Fig. 3(d), chronoamperometry measurement performed for 60 min at −0.7 V revealed that the obtained current density insignificantly decreased with time. The activity and stability were comparable to other non-porous catalysts, such as CuMoS, NiMo, NiCo and conventional noble metal catalyst.35 Additionally, the resistance from the EIS experiments was found to be same before and after the stability evaluation.
The degradation showed an insignificant increase in the voltage; thus, it is stable in a strong alkaline environment and is a suitable HER catalyst for long-term water electrolysis. However, detachment of catalyst particles was observed, and after detachment, the performance of the HER electrode decreased. This requires further action to improve the binding properties of suitable binders.
We measured the overall resistance under suitable conditions for a running AEM water electrolyser at 1.5 V. The gas production of H2 and O2 occurs at the backside of GDLs; hence, the mass transport limitation can be considered negligent. The Nyquist plot (a parametric plot of the frequency response, which is commonly used to assess the stability of a system) is commonly depicted as a semicircle. It involves a semicircle loop at high frequency and a straight line at low frequency. The semicircle loop at high frequency is attributed to the charge transfer resistance, and the slope at low frequency is related to diffusion. Fig. 5 shows a typical Nyquist plot obtained for the AEM electrolysis at 1.5 V at 60 °C with a fit obtained by the model described (see Experimental). The resistances involved in the operations were found using an equivalent circuit model, which is shown in Fig. 5, showing the experimental AC impedance data and related curve fitting in both Nyquist plots. Fig. 6 shows the effect of temperature variation on the Nyquist plot.
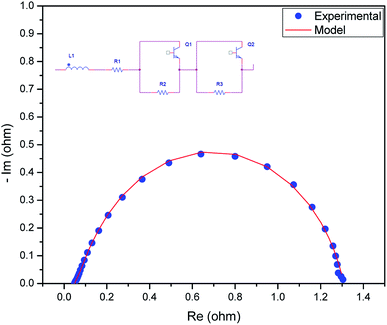 | ||
| Fig. 5 Nyquist plot obtained for the AEM electrolyser with the MEA and mathematical model fitted to experimental data to obtain the resistance values. | ||
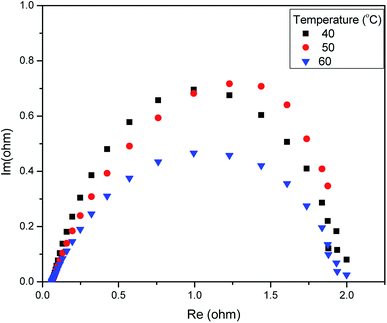 | ||
| Fig. 6 Electrochemical impedance spectroscopy (EIS) analysis of the AEM electrolyser at 1.5 V in 1 M KOH. | ||
The equivalent circuit was composed of various components, such as an inductor, resistor, and constant phase elements. The components were arranged in series and parallel. The series resistance reflects ohmic phenomena, whereas the R and Q components are associated with the electrode–electrolyte interfacial properties. The inductor indicates the cable connection, and the resistance contributes to the interfacial contact resistance between the ohmic resistance of the membrane, catalyst layer GDLs, and the flow fields of the bipolar plates. The time constants represent the roughness of the electrode surface and indicate the two OER anodic charge transfer and HER cathodic charge transfer processes, including the mass transfer processes.
After fitting R1, R2, R3, Q1, and Q2, they were separated with values of 46.5 mΩ, 1194 mΩ, 67 mΩ, and the constant phase elements were at 0.180 and 1.197 F cm−2 sn−1, respectively. This indicated that the cell had an ohmic resistance of 46.5 mΩ and the surface roughness of the electrodes contributed a resistance of 35.55 mΩ. The resistances of 67 mΩ and 1194 mΩ were assigned to the HER process on the cathode and to the OER process on the anode, respectively, which is consistent with studies in that the HER in alkaline medium is a relatively sluggish process but is still more rapid than the OER.39 This also indicates that the OER process is still one of the main barriers for the AEM electrolyser to achieve a higher performance. The negligible resistance is caused by the mass transport issues because of the thick active layer, which limits both water distribution and gas bubbles from H2 and O2 detachment.
3.2. AEM electrolysis
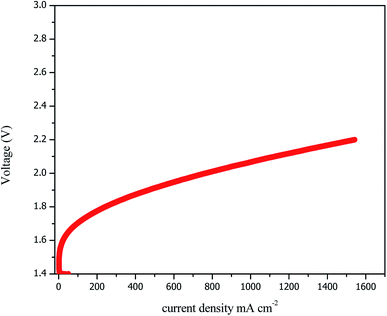
The performances of the AEM electrolysis are shown as polarisation current–voltage (I–V) curves in Fig. 7. The polarisation curves were plotted from 0 to 1600 mA cm−2 with intervals of 0.05 mA cm−2. As previously explained, the earlier performances were based on the Ni–Fe–Ox anode and the Ni–Fe–Co cathode with the PBI membrane from sustaining ions, and 1 M KOH was used as the feedstock at 60 °C.
The AEM electrolyser achieved the maximum performance of 1600 A cm−2 at 2.2 V, which is comparable with the performance of a conventional PEM electrolyser. The acceptable performance achieved due to the higher activity of catalyst and hydroxyl ion conductivity of AEM. However, the higher over-potential was due to the OER because it showed sluggish kinetics for overcoming the resistance, but the HER requires less current density. Overall, the best performance was found for the Ni–Fe–Ox anode and Ni–Fe–Co cathode with the PBI membrane from sustaining ions, and 1 M KOH was used as the feedstock at 1000 mA cm−2 and 1.9 V at 60 °C. This is a significant achievement compared to results currently available in the literature. However, our electrolyser performance was slightly lower than that reported by M. R. Kraglund et al. The performance reported by M. R. Kraglund et al.40 was higher; however, they used an ion solvating membrane that has not yet been confirmed to be stable.
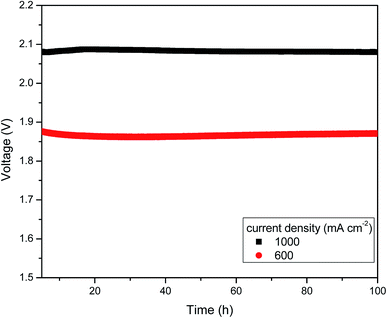
Additionally, we evaluated the cell performance of the electrolyser before and after the stability experiments. The voltage decreased slightly from 2.09 to 2.08 V for 1000 mA cm−2 and from 1.89 to 1.88 V for 600 mA cm−2. The chronoamperometry results are shown in Fig. 8 as a horizontal line, which indicates the firmness and durability of the anion exchange membrane and catalyst even at high temperature. EIS experiments were also conducted before and after the stability test. Increase in cell voltage might be attributed to the insignificant increase in ohmic resistance, which was measured by AC impedance spectroscopy at high frequencies. This indicated that the membrane resistance and catalytic resistance were slightly higher than at the starting condition. However, the onset potential did not change after or before the test. Thus, there was no permanent damage of the AEM electrolyser components. This is due to the rendered anion conducting when doping with KOH. This is the major advantage of this PBI based AEMs is, it does not show cationic degradation due to hydroxyl ion attack from nucleophilic displacement and Hofmann-elimination reactions.29
4. Efficiency of the AEM electrolyser
An electrolyser is an energy conversion equipment, which converts electrical energy into chemical energy (hydrogen). It works based on the first law of thermodynamics in which the energy consumed and transformed as hydrogen. The heat is considered a loss of energy, which is useful. The electrolysis of the system was calculated by the amount of hydrogen produced divided by the amount of electrical energy supplied.| Electrical efficiency (HHV) = HHV of H2 produced/electricity supplied |
 | (1) |
The change in Gibbs free energy was ΔG = 237.22 kJ mol−1, and the change in enthalpy was ΔH = 285.84 kJ mol−1 at STP. This is the required energy to split the water into oxygen and hydrogen. The thermoneutral energy voltage was 1.48 V, which is defined as E0 = ΔHd(H2O)/2F = 1.48 V per cell. The thermoneutral voltage is the minimum required voltage to split water into hydrogen and oxygen at 25 °C without providing excess heat. However, practically, the operating cell voltage is higher than the thermoneutral voltage and produces excess heat.
The equation for calculating the overall voltage efficiency of the electrolysis cell is:
| Voltage efficiency = thermo-nature voltage (E0)/operating cell voltage |
In this study, the cell voltage was calculated at 1000 mA cm−2. The voltage efficiency of this AEM electrolyser was found to be ∼74%. The efficiency of an electrolyser using a conventional Pt electrode was approximately 85%. Currently, 1 N m3 H2 per h in conjunction with the use of a non-platinum group metal catalyst provides an efficiently of approximately 80%.
5. Conclusion
In this study, we demonstrated a novel combined MEA consisting of a PBI anion exchange membrane and Ni–Fe–Ox (OER) and Ni–Fe–Co (HER). The electrochemical characterisation showed the suitability of these transition metal catalysts, which are thus suitable for long-term water electrolysis. The CV, LSV and CA experimental results suggested that both non-PGM catalyst performances were higher to that of a conventional pure Ni. Additionally, these catalysts are highly stable in strong alkaline conditions. The different resistances involved in the electrolysis operation were found via EIS. The resistance from the anode cathode layer was responsible for the higher over potential.The best performance was obtained at 1000 mA cm−2 at 1.9 V and 60 °C, and the efficiency of the AEM electrolysis was 74%. Additionally, short-term stability measurements indicated that the MEA combination of the anion exchange membrane and Ni–Fe–Ox (OER) and Ni–Fe–Co (HER) catalysts was stable during approximately 100 h of operation with a current density of 1000 mA cm−2. Both the OER and HER electrodes showed excellent electrochemical performances and stability. Thus, a highly efficient and robust water electrolyser employing low-cost Ni–Fe–Ox and Ni–Fe–Co electrodes can be used for long-term water electrolysis that is a cost-effective alternative for large-scale energy storage and pressurised H2 production.
Overall, for AEM electrolysis, there are still many steps that need to be optimised and improved in future work. Research and development should also focus on bi-polar GDL, 3D electrodes, two-step electrolysis, and the introduction of pulsed current for AEM electrolyser.41,42 These improvements would have the potential to be “game changers” for the technology in the future and will be a path to cost-effective green hydrogen production.
Conflicts of interest
There are no conflicts to declare.Acknowledgements
This research was supported by the Brain Pool Fellowship (2019H1D3A2A02102994), a human resources development programme initiated by the Koren Government, and was supported by a Basic Science Research Program through the National Research Foundation of Korea (NRF) funded by the Ministry of Education (2019R1I1A3A0305044112).References
- S. Chu and A. Majumdar, Nature, 2012, 488, 294–303 CrossRef CAS.
- V. Khare, S. Nema and P. Baredar, Renewable Sustainable Energy Rev., 2016, 58, 23–33 CrossRef.
- M. Z. Jacobson and M. A. Delucchi, Energy Policy, 2011, 39, 1154–1169 CrossRef CAS.
- S. R. Foit, I. C. Vinke, L. G. J. de Haart and R. A. Eichel, Angew. Chem., Int. Ed., 2017, 56, 5402–5411 CrossRef CAS.
- J. Koponen, A. Kosonen and J. Ahola, Neo-Carbon Energy, 2015, 1–22 Search PubMed.
- G. W. Crabtree and M. S. Dresselhaus, MRS Bull., 2008, 33, 421–428 CrossRef CAS.
- M. M. Rashid, M. K. Al Mesfer, H. Naseem and M. Danish, Int. J. Eng. Adv. Technol., 2015, 2249–8958 Search PubMed.
- M. David, C. Ocampo-Martínez and R. Sánchez-Peña, J. Energy Storage, 2019, 23, 392–403 CrossRef.
- S. Shiva Kumar and V. Himabindu, Mater. Sci. Energy Technol., 2019, 2, 442–454 Search PubMed.
- M. Carmo, D. L. Fritz, J. Mergel and D. Stolten, Int. J. Hydrogen Energy, 2013, 38, 4901–4934 CrossRef CAS.
- P. Millet, R. Ngameni, S. A. Grigoriev, N. Mbemba, F. Brisset, A. Ranjbari and C. Etiévant, Int. J. Hydrogen Energy, 2010, 35, 5043–5052 CrossRef CAS.
- R. Bhattacharyya, A. Misra and K. C. Sandeep, Energy Convers. Manage., 2017, 133, 1–13 CrossRef CAS.
- Y. Leng, G. Chen, A. J. Mendoza, T. B. Tighe, M. a. Hickner and C.-Y. Wang, J. Am. Chem. Soc., 2012, 134, 9054–9057 CrossRef CAS.
- I. Vincent, A. Kruger and D. Bessarabov, Int. J. Hydrogen Energy, 2017, 42, 10752–10761 CrossRef CAS.
- J. Parrondo, C. G. Arges, M. Niedzwiecki, E. B. Anderson, K. E. Ayers and V. Ramani, RSC Adv., 2014, 4, 9875 RSC.
- I. Vincent and D. Bessarabov, Renewable Sustainable Energy Rev., 2018, 81, 1690–1704 CrossRef CAS.
- I. Vincent, A. Kruger and D. Bessarabov, Int. J. Electrochem. Sci., 2018, 13, 11347–11358 CrossRef CAS.
- J. E. Park, S. Y. Kang, S. H. Oh, J. K. Kim, M. S. Lim, C. Y. Ahn, Y. H. Cho and Y. E. Sung, Electrochim. Acta, 2019, 295, 99–106 CrossRef CAS.
- M. Faraj, M. Boccia, H. Miller, F. Martini, S. Borsacchi, M. Geppi and A. Pucci, Int. J. Hydrogen Energy, 2012, 37, 14992–15002 CrossRef CAS.
- C. C. Pavel, F. Cecconi, C. Emiliani, S. Santiccioli, A. Scaffidi, S. Catanorchi and M. Comotti, Angew. Chem., Int. Ed., 2014, 53, 1378–1381 CrossRef CAS.
- V. Bachvarov, E. Lefterova and R. Rashkov, Int. J. Hydrogen Energy, 2016, 41, 12762–12771 CrossRef CAS.
- M. K. Bates, Q. Jia, H. Doan, W. Liang and S. Mukerjee, ACS Catal., 2016, 6, 155–161 CrossRef CAS.
- H. Osgood, S. V. Devaguptapu, H. Xu, J. Cho and G. Wu, Nano Today, 2016, 11, 601–625 CrossRef CAS.
- C. Zhou, J. Mu, Y. F. Qi, Q. Wang, X. J. Zhao and E. C. Yang, Int. J. Hydrogen Energy, 2019, 44, 8156–8165 CrossRef CAS.
- B. H. R. Suryanto, Y. Wang, R. K. Hocking, W. Adamson and C. Zhao, Nat. Commun., 2019, 10, 5599 CrossRef CAS.
- E. Cossar, A. O. Barnett, F. Seland and E. A. Baranova, Catalysts, 2019, 9, 1–10, DOI:10.3390/catal9100814.
- A. Y. Faid, A. O. Barnett, F. Seland and S. Sunde, J. Electrochem. Soc., 2019, 166, F519–F533 CrossRef CAS.
- M. K. Cho, A. Lim, S. Y. Lee, H. J. Kim, S. J. Yoo, Y. E. Sung, H. S. Park and J. H. Jang, J. Electrochem. Sci. Technol., 2017, 8, 183–196 CrossRef CAS.
- Y. S. Li and T. S. Zhao, Int. J. Hydrogen Energy, 2012, 37, 4413–4421 CrossRef CAS.
- H. Bode, K. Dehmelt and J. Witte, J. Inorg. Gen. Chem., 1969, 366, 1–21 CAS.
- E. Fabbri, A. Habereder, K. Waltar, R. Kötz and T. J. Schmidt, Catal. Sci. Technol., 2014, 4, 3800–3821 RSC.
- O. Diaz-Morales, D. Ferrus-Suspedra and M. T. M. Koper, Chem. Sci., 2016, 7, 2639–2645 RSC.
- B. Zhang, Y. H. Lui, H. Ni and S. Hu, Nano Energy, 2017, 38, 553–560 CrossRef CAS.
- T. Shinagawa, A. T. Garcia-Esparza and K. Takanabe, Sci. Rep., 2015, 5, 13801 CrossRef.
- X. Lu, Q. Zhang, Y. H. Ng and C. Zhao, EcoMat, 2020, 2(1), 1–12 Search PubMed.
- X. Yuan, H. Wang, J. Colin Sun and J. Zhang, Int. J. Hydrogen Energy, 2007, 32, 4365–4380 CrossRef CAS.
- C. Rozain and P. Millet, Electrochim. Acta, 2014, 131, 160–167 CrossRef CAS.
- I. Dedigama, P. Angeli, K. Ayers, J. B. Robinson, P. R. Shearing, D. Tsaoulidis and D. J. L. Brett, Int. J. Hydrogen Energy, 2014, 39, 4468–4482 CrossRef CAS.
- G. Schiller, R. Henne and V. Borck, J. Therm. Spray Technol., 1995, 4, 185–194 CrossRef CAS.
- M. R. Kraglund, M. Carmo, G. Schiller, S. A. Ansar, D. Aili, E. Christensen and J. O. Jensen, Energy Environ. Sci., 2019, 12, 3313–3318 RSC.
- I. Vincent, B. Choi, M. Nakoji, M. Ishizuka, K. Tsutsumi and A. Tsutsumi, Int. J. Hydrogen Energy, 2018, 43, 10240–10248 CrossRef CAS.
- H. Dotan, A. Landman, S. W. Sheehan, K. D. Malviya, G. E. Shter, D. A. Grave, Z. Arzi, N. Yehudai, M. Halabi, N. Gal, N. Hadari, C. Cohen, A. Rothschild and G. S. Grader, Nat. Energy, 2019, 4, 786–795 CrossRef CAS.
| This journal is © The Royal Society of Chemistry 2020 |

