 Open Access Article
Creative Commons Attribution 3.0 Unported Licence
Production of pyrolytic oil from ULDP plastics using silica-alumina catalyst and used as fuel for DI diesel engine
Soundararajan Gopinath *a,
P. K. Devan
 a and
K. Pitchandi
 b
b
aDepartment of Mechanical Engineering, RMK College of Engineering and Technology, Puduvoyal – 601 206, Tamil Nadu, India. E-mail: gp.nath4@gmail.com
bDepartment of Mechanical Engineering, Sri Venkateswara College of Engineering, Sriperumbudur – 602 117, Tamil Nadu, India
First published on 12th October 2020
Abstract
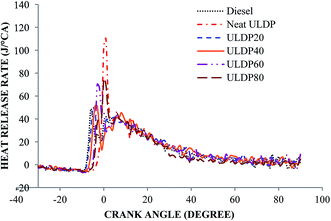
A rapid increase in the use of non-biodegradable plastics and their disposal after use has had a detrimental impact on the environment. Used plastics (used low-density polyethylene – ULDP) were selected as feedstock for the extraction of pyrolytic oil. The pyrolysis process was carried out in a semi-batch reactor with a silica alumina catalyst in the existence of fluidizing gas N2 in a reactor at 500 °C for 60 min. The maximum liquid, gas, and char yields were 93.5 wt%, 5.4 wt%, and 1.1 wt%, respectively. Experimental analysis was carried out to obtain their functional and structural groups by FT-IR and the carbon distribution was identified by GC-MS analysis. The blends of 20%, 40%, 60%, 80%, and 100% on a volume basis were chosen for the detailed study. For the pyrolytic blends, the combustion, performance, and emission characteristics were tested at different engine loads. During combustion, the heat release rate was extremely high for neat ULDP oil because of the high energy content and a higher cetane index. The efficiency of ULDP20 was higher than in other blends, whereas NOx and smoke emissions of ULDP20 were lower among the blends but higher than diesel. ULDP20 performed similarly as diesel. Hence, ULDP20 is recommended as a fuel for the diesel engine.
1. Introduction
The tremendous use of different types of non-biodegradable plastics like low-density polyethylene (LDPE), high-density polyethylene (HDPE), polystyrene (PS), polypropylene (PP) and polyvinyl chloride (PVC) in various applications results in 5.56 million tons of plastic waste every year. In addition, fossil fuel demand and prices are increasing. To balance the demand, research is focused on developing alternative fuels.1,2 Experimental investigation has been performed on HDPE oil derived from waste plastic grocery bags. The chemical structure of HDPE pyrolysis oil contains 94.0% aliphatic, paraffinic hydrogens, and a smaller amount of olefinic hydrogen. Based on the property analysis, it is observed that all the chemical properties except lubricity are similar to those of diesel. 3 Experimental analysis was carried out on plastic oil blends (25%, 50%, 75%) in a DI diesel engine without any modification. It was found that the brake thermal efficiency was improved in lower plastic oil blends compared to 100% neat plastic oil and higher blends due to low viscosity and density. Emissions such as smoke and nitrogen oxides (NOx) were considerably lower by 22% and 17% respectively for P25 4.The combustion and emission characteristics of pyrolysis oil with the addition of 5% and 10% diethyl ether (DEE) in a water-cooled DI diesel engine were examined. The brake thermal efficiency (BTE) was improved compared to that of plastic oil, whereas the peak pressure was reduced by the addition of DEE.5 Due to the addition of DEE to plastic oil, the cetane number was increased, thereby, a reduction in NOx and carbon monoxide (CO) emissions along with an increase in hydrocarbon emission (HC) were observed. The addition of DEE improved the oxygen content in the blends of plastic pyrolytic oil, resulting in excellent combustion. An engine fueled with plastic oil with an additive of di-ethyl ether demonstrated a significant rise in BTE, exhaust gas temperature (EGT), and reduced CO emissions.6,7
An experiment was conducted on the CI engine with waste plastic oil to ensure its engine characteristics. It was observed that while using 100% waste plastic oil in the diesel engine, emissions from NOx, CO, hydrocarbons, and smoke increased by 25%, 5%, 15% and 40%, respectively, compared to diesel fuel.8 However, a higher brake thermal efficiency was observed when compared to diesel fuel.
Researchers investigated the combustion and output characteristics of rice bran methyl ester (RBME) and plastic oil (PO) in a CI engine compared with regular diesel fuel.9 They reported that with 100% neat plastic oil, the engine was able to run, but the performance and combustion characteristics were inferior due to its longer ignition delay and prolonged combustion duration.10 The NOx emissions were increased with neat (100%) plastic oil due to its higher heat release rate compared with diesel. The selective catalytic reduction technique was adopted to reduce the nitrogen oxides using a rhodium catalyst, resulting in an optimum temperature range of 240 °C to 280 °C and a reduction of NOx up to 30%.11 Higher blends of recycled waste plastic oil exhibit higher emissions from NOx and smoke. Supporting experiments were performed with the addition of pentanol to waste plastic oil with a retarded injection timing of 21 °CA BTDC and the adoption of 10% exhaust gas recirculation (EGR) reduced the smoke emission by 74.2% with a significant increase in NOx emission. The brake specific fuel consumption (BSFC) also improved by 3.2% at higher loads.12,13
The pyrolysis process was conducted with waste tyres at a maximum temperature of 500 °C in the presence of nitrogen gas (carrier gas) in the pyrolysis reactor to obtain the waste tyre pyrolysis oil. Experimental investigations were carried out at various loads with a 10% blend of waste tyre oil.14 The combustion duration was increased by up to 1.16% with a reduction in CO emissions and the brake thermal efficiency increased by 3.2% for a 10% blend.15 The plastic pyrolysis oils from mixed plastic wastes were obtained by the thermal depolymerization method.16 The performance, combustion, and emission characteristics were much closer to diesel fuel at lower (below 25%) loads. However, a higher load increase in the NOx and CO emission was abnormal due to the presence of the unsaturated double bonds in plastic oils.
The injection timing was increased up to 25 °CA bTDC, which reduced the smoke and NOx by 38% and 46%.17. Continuous tests on the DI engine fueled with neat (100%) plastic oil were conducted to evaluate the performance, combustion, and emission.18 The experimental results revealed that the engine performance was reduced due to wear on the piston. To improve the efficiency, the addition of standard diesel was required for a longer run of the diesel engine.
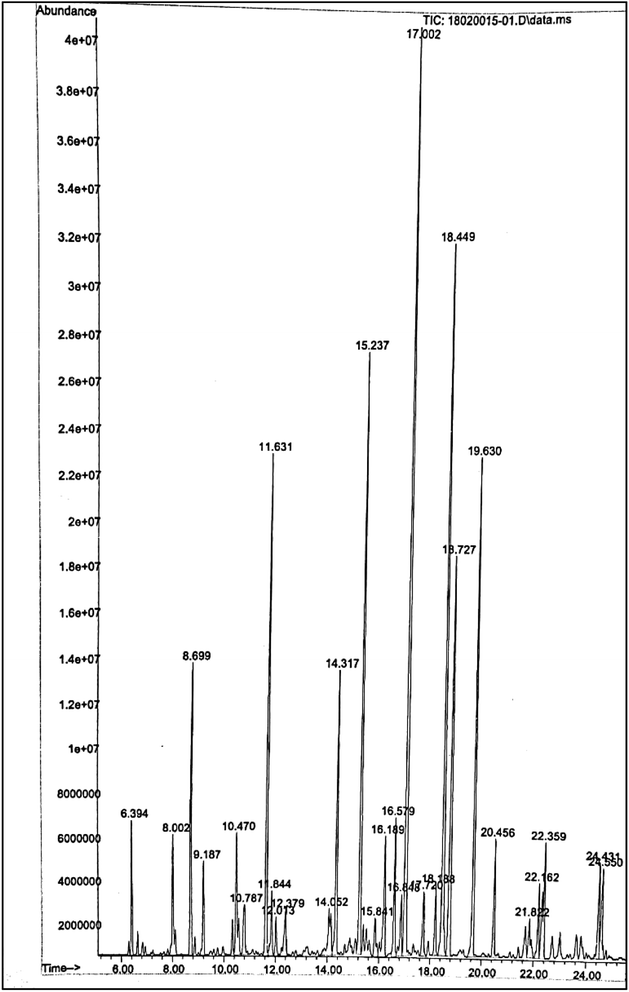
Many researchers have reported the conversion of used plastics into oil by the pyrolysis method and then used the oil as a fuel. However, the type of plastic being used was not discussed. In the current investigation, used low-density polyethylene (ULDP) was selected as a feedstock for oil extraction because of its abundant availability. Silica alumina (SA) was used as a catalyst for the production of pyrolytic ULDP oil in a semi-batch reactor. Then, ULDP oil was mixed with diesel in different proportions and also neat. Researchers have reported that a lower acidity ratio of the silica alumina catalyst leads to a higher liquid yield in the pyrolysis process. The physiochemical properties and fuel injection characteristics of blends, and neat ULDP oil were measured and compared with diesel. The types of functional groups were identified by Fourier transform infrared spectroscopy (FTIR), and gas chromatography-mass spectrometry (GC-MS) was conducted to investigate the presence of saturated and unsaturated compounds. To examine the suitability of the blended ULDP fuels, combustion tests were carried out on the DI diesel engine at different operating points. Further, the thermodynamic performance and exhaust emissions of the ULDP oil and its blends were found and compared with diesel. Since minimal research work has been carried out with 100% plastic oil, in the present investigation, an attempt was made and the results are compared between blends and diesel with neat ULDP oil. The main objective is to characterize and convert waste plastic to pyrolysis oil, which can provide an environmentally friendly diesel fuel.
2. Materials
2.1 Selection of feedstock
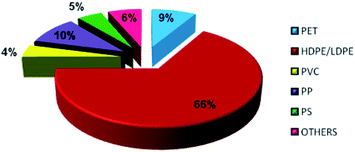
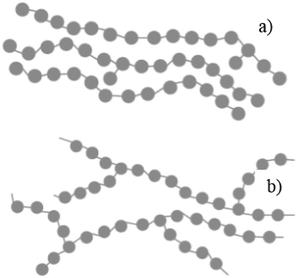
In general, plastics are classified based on their polymers namely polyethylene terephthalate (PET), high-density polyethylene (HDPE), polyvinyl chloride (PVC), low-density polyethylene (LDPE), polypropylene (PP) and polystyrene (PS). The recent survey report of the Ministry of Human Resources and Development of India reveals that 94% of plastic wastes are thermoplastics and the remaining 6% of plastic wastes are thermoset plastics. The detailed analysis of plastic waste in India is shown in Fig. 1 and the percentages are described here: polyethylene terephthalate (PET) is 8.66% (5.69 kg perMetric Ton (MT)), high density polyethylene and low density polyethylene (HDPE and LDPE) is 66.91% (43.94 kg MT−1), polyvinyl chloride (PVC) is 4.14% (2.72 kg MT−1), polypropylene (PP) is 9.90% (6.50 kg MT−1), polystyrene (PS) is 4.77% (3.13 kg MT−1), and others are 6.43% (4.22 kg MT−1).19 This clearly shows that LDPE and HDPE are a major proportion of the waste plastic composition of about 66%.LDPE has a branched structure, less dense and is flexible. In contrast, high-density polyethylene has a linear structure with high density chains, as shown in Fig. 2. LDPE has a very high impact strength compared to high-density polyethylene. Hence, the breaking of the HDPE chain is difficult when compared to LDPE. The catalytic cracking of low-density polyethylene chain is more feasible than HDPE because LDPE possesses a branched structure with lower density molecules in the chain. The pyrolysis process is carried out with low-density polyethylene as a feedstock and the maximum liquid yield is 85 wt% in the presence of a ZSM-5 catalyst at 500 °C with the reaction time of 60 min.20 Whereas, the HDPE feedstock provides a liquid yield of 80 wt% with the same catalyst and operating parameters.21 Considering the maximum pyrolytic liquid yield and its characteristics, LDPE was selected as a feedstock in this research work.
2.2 Selection of catalyst
Zeolite-based heterogeneous catalysts HZSM-5, HUSY, HMOR, and Hβ are preferred for the pyrolysis process because of their useful ion exchange characteristics. A non-zeolite heterogeneous catalyst, such as silica alumina and silicalite which have more electron-accepting aspects, is also used for the pyrolysis process. A fluid catalytic cracking (FCC) catalyst is composed of a non-zeolite and zeolite, such as a binder with silica-alumina (SA).22 This FCC catalyst is widely used in petroleum refinery to break the heavier chain in crude oils. The FCC silica alumina catalyst increases the rate of breaking chains to produce a high liquid and gas yield. A higher strength of acidity is determined by a higher ratio like 4.99, referred to as SA-1, whereas 0.27 is referred to as SA-2. A lower acidity silica alumina catalyst produces a higher liquid yield of 74.3 wt% for HDPE whereas for the SA-1 catalyst, the liquid yield is 67.8 wt% and for the ZSM-5 catalyst, the liquid yield is 49.8 wt%.23 Hence, in this research, FCC catalyst silica alumina is selected for the pyrolysis process.2.3 Selection of fluidizing gas
Mostly inert gases such as hydrogen, helium, nitrogen, ethylene, propylene, and argon are used as fluidizing gases. The differences in molecular weight and molecular size of the inert gases impact the reactivity in the pyrolysis. The carrier gas, which has a lower molecular weight produces a higher liquid yield. With the feedstock of polypropylene, the yield (wt%) using an FCC catalyst at a reaction temperature of 450 °C was analyzed while varying the carrier gases. The molecular weights of hydrogen, helium, nitrogen, ethylene, propylene and argon are 2, 4, 28, 28, 42 and 37, which correspond to the liquid yields of 96.7%, 94.7%, 92.3%, 93.8%, 87.8% and 84.8%, respectively.24 H2 gas leads to a higher liquid yield compared to other gases, but in practice, the storage of hydrogen is a tedious process and also not cost-effective. When N2 is used as a carrier gas, only a 0.9% liquid yield difference between the H2 and N2 gases is observed. Hence, nitrogen was selected as the fluidizing gas in this research work.3. Production and properties
3.1 Pyrolysis process
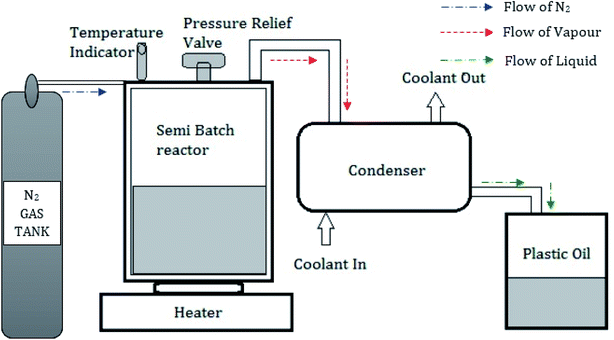
Used low-density polyethylene was chosen as the feedstock for oil extraction by the pyrolysis process among the various forms of plastic polymers. A semi-batch pyrolysis reactor with a 1500 mm diameter and 1200 mm height with a pressure relief valve was used in this investigation. A condenser with 1200 mm height and 1000 mm diameter consisting of 8 mm copper tubes was placed vertically through the series connection from the reactor.25 Water was used as a coolant through the outer shells of the condenser with the aid of a pump. An electric furnace was used to maintain the reactor at a constant temperature.26 Fig. 3 shows the schematic representation of the pyrolysis setup. Used plastics collected from the dumped yards were dried in sunlight, cut into small pieces (10–20 mm2), and used to fill the reactor. Nitrogen gas was filled in the semi-batch reactor to ensure there was no oxygen inside the reactor. The reactor was placed on the electrical furnace, which is capable of varying temperatures from 100 °C to 600 °C. The silica alumina catalyst was added as 5 wt%, and the optimum temperature of 500 °C was maintained for 60 min. The gas, which comes out from the reactor, is sent to the condenser where gases are cooled, and liquid oil is collected in the tank. During this process, the liquid yield of 93.5 wt%, the gas yield of 5.4 wt%, and a char yield of 1.1 wt% were obtained. From 1 kg of used LDPE plastics feedstock, 0.9 liters of pyrolytic oil was extracted.3.2 Physio-chemical properties
CCI = 454.74 − 1641.416D + 774.74D2 − 0.554B + 97.803![[thin space (1/6-em)]](https://www.rsc.org/images/entities/char_2009.gif) log2 log2 |
| Physical properties | Method | Diesel | Neat ULDP oil | ULDP20 | ULDP40 | ULDP60 | ULDP80 |
|---|---|---|---|---|---|---|---|
| Calorific value (mJ kg−1) | ASTM D 240 | 42.5 | 42.9 | 42.58 | 42.66 | 42.74 | 42.82 |
| Density @ 15 °C (kg m−3) | ASTM D4052 | 807 | 784 | 802.4 | 797.8 | 793.2 | 788.6 |
| Ash content (wt%) | ASTM D482 | 0.01 | 0.02 | 0.012 | 0.014 | 0.016 | 0.018 |
| Flashpoint (°C) | ASTM D93 | 52 | 6 | 42.8 | 33.6 | 24.4 | 15.2 |
| Kinematic viscosity (mm2 s−1) @ 40 °C | ASTM D 445 | 2.14 | 0.82 | 1.876 | 1.612 | 1.348 | 1.084 |
| CCI (calculated cetane index) | ASTM D976 | 46 | 49 | 46.6 | 47.2 | 47.8 | 48.4 |
| Wavenumber | Functional group |
|---|---|
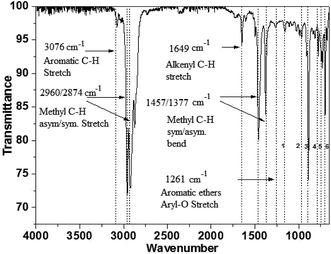
| 1155 cm−1 | Alkyl-substituted ether, C–O stretch |
| 965 cm−1 | Trans C–H out-of-plane bend |
| 887 cm−1 | Vinylidene C–H out-of-plane bend |
| 775 cm−1 | Aromatic C–H out-of-plane bend |
| 728 & 697 cm−1 | Cis C–H out-of-plane bend |
| Composition | Percentage (%) |
|---|---|
| C6–C9 | 20.74 |
| C10–C15 | 64.69 |
| C16–C19 | 12.18 |
| >C20 | 2.37 |
4. Experimental setup
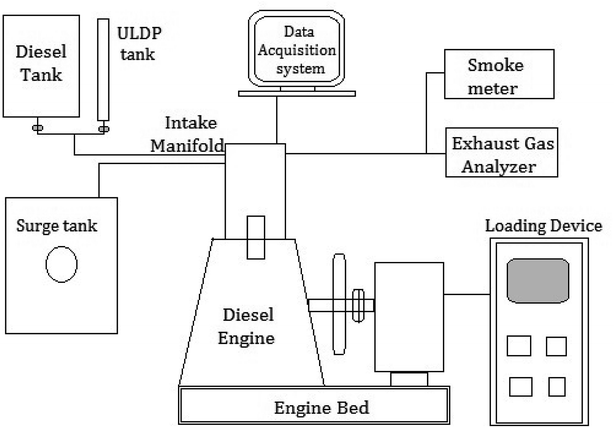
The blends of ULDP oil such as ULDP20 (20% of ULDP + 80% of diesel), ULDP40 (40% of ULDP + 60% of diesel), ULDP60 (60% of ULDP + 40% of diesel), and ULDP80 (80% of ULDP + 20% of diesel) were prepared with diesel on a volume basis. The engine trials were conducted on a four-stroke single-cylinder DI diesel engine fueled with diesel, neat ULDP oil and its blends. The schematic layout of the DI diesel engine setup is shown in Fig. 6 and its detailed specifications are listed in Table 5. An experimental test was carried out in a single-cylinder four-stroke compression engine with a rated speed of 1500 rpm. It was coupled with an electrical dynamometer for loading. Several operating conditions of the engine are unchanged, with an intake air temperature of 27 °C and injection pressure 200 bar.32 However, thermocouples were placed at different positions to measure the intake air temperature, exhaust gas temperature, and fuel inlet temperature. The smoke density was measured using an AVL smoke meter, and the exhaust gas analyzer measured the amount of CO, CO2, NOx, and HC in ppm.33 An experimental investigation was carried out in an air-cooled single-cylinder four-stroke diesel engine with a data acquisition system at different loading conditions. Performance and emission characteristics were observed on varying loads from 0 to 100% for ULDP20, ULDP40, ULDP60, ULDP80, and neat ULDP oil. The trials were repeated twice to obtain optimum readings.| Make & model | Kirloskar, TAF1 |
| Engine type | CI, four stroke, direct injection, vertical air-cooled diesel engine |
| Bore (mm) | 87.5 |
| Stroke (mm) | 110 |
| Compression ratio | 17.5 |
| Rated power @ 1500 rpm (kW) | 4.4 |
| Nozzle operating pressure (bar) | 200 |
| Injection timing (CA) | 23 °bTDC |
5. Result and discussion
5.1 Combustion analysis
5.2 Performance characteristics
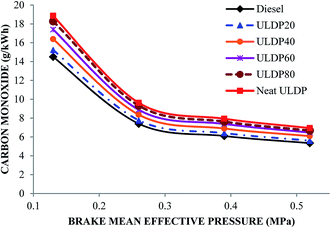
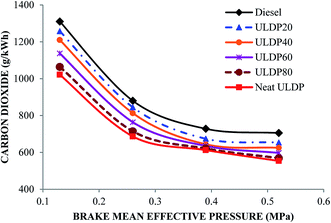
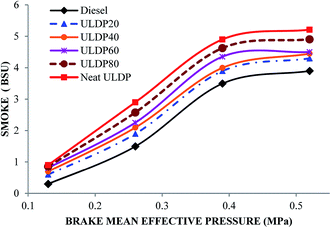
5.3 Emission characteristics
6.0 Uncertainty and error analysis
Uncertainty analysis is critical to prove the accuracy of the experiment. During experimental analysis, ambiguities and uncertainties were found. However, this may occur due to calibration error, human error, environmental conditions, and instrument components.42 The estimated uncertainty values, range, and accuracy of the instruments are shown in Table 6. The root sum square method was used to estimate the accurate uncertainty limits.where U is the total percentage uncertainty, Yi are the individual uncertainties of parameters, Y1 is the brake power uncertainty percentage, Y2 is the total fuel consumption uncertainty percentage, Y3 is the exhaust gas temperature uncertainty percentage, Y4 is the nitrogen oxides emission uncertainty percentage, Y5 is the carbon monoxide emission uncertainty percentage, Y6 is the unburned hydrocarbon emission uncertainty percentage, and Y7 is the smoke uncertainty percentage.
| U = ±1.89% |
| Instruments | Range | Accuracy | Percentage uncertainties |
|---|---|---|---|
| Burette for fuel measurement | — | +0.1 cc to −0.1 cc | +1 to −1 |
| Digital stop watch | — | +0.5 s to −0.5 s | +0.2 to −0.2 |
| Manometer | — | +1 mm to −1mm | +1 to −1 |
| Crank angle encoder | 0–100 bar | +1° to −1° | +0.1 to −0.1 |
| Load indicator | 0–100 kg | +0.1 kg to −0.1 kg | +0.15 to −0.15 |
| Speed measuring unit | 0–1000 rpm | +10 rpm to −10 rpm | +0.15 to −0.15 |
| Exhaust gas temperature indicator | 0–1000 °C | +1 °C to −1 °C | +0.1 °C to −0.1 °C |
| Smoke level measuring instrument – AVL 415 | BSU 0–10 | +0.15 to −0.15 | +1 to −1 |
| Gas analyser – AVL DI GAS 444 | CO 0–10% | +0.02% to −0.02% | +0.2 to −0.2 |
| CO2 0–20% | +0.03% to −0.03% | +0.15 to −0.15 | |
HC 0–20![[thin space (1/6-em)]](https://www.rsc.org/images/entities/char_2009.gif) 000 ppm 000 ppm |
+10 ppm to −10 ppm | +0.2 to −0.2 | |
| NOx 0–5000 ppm | +10 ppm to −10 ppm | +0.2 to −0.2 |
6. Conclusion
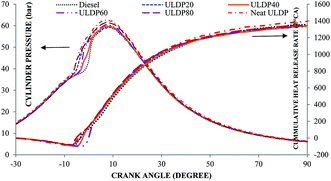
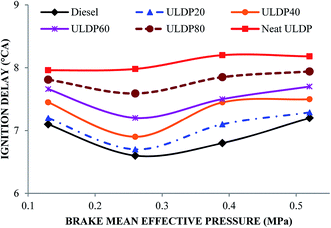
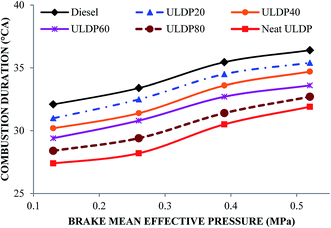
Without any diesel engine modifications, the following conclusions were derived from the experimental work conducted with standard diesel, neat (100%) plastic oil and its blends.• The compression ignition (CI) engine was run on neat plastic oil without any engine modification. The longer ignition delay and very high premixed combustion restricted the usage of neat ULDP oil in diesel engines for prolonged run usage. The unusual trend of uncontrolled combustion, longer combustion duration, and poor performance limited further analysis.
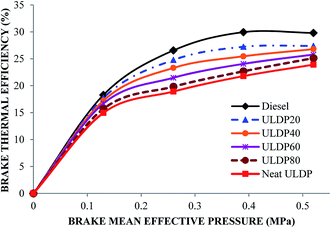
• ULDP20 performed very closely to that of diesel in the case of brake thermal efficiency, and it varied from 17.75% to 27.39%.
• The marginal increase in heat release rate was observed for ULDP20 at the normal operating condition. However, the ignition delay period was very close to that of diesel in the case of ULDP20, and it varied from 7.2 °CA to 7.29 °CA.
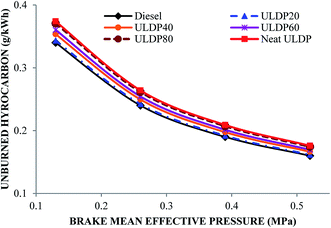
• In the case of ULDP 20, unburned hydrocarbon, NOx and CO emissions were marginally higher by 1%, 3.11%, and 5%, respectively, at full load compared with diesel fuel.
• The smoke emission of ULDP20 was very similar to standard diesel fuel operation. For ULDP20, the smoke emissions varied from 0.60 BSU to 4.30 BSU.
Based on the above conclusions, ULDP20 can be used as fuel for DI diesel engines without any engine modifications.
Conflicts of interest
There are no conflicts to declare.Acknowledgements
The authors are thankful to “The Institution of Engineers India” for their partial funding (ID: UG2019005) of this research. The authors would like to acknowledge RMK College of Engineering and Technology, Puduvoyal for the support of this research work through FUELS Lab. The authors would like to acknowledge the Chennai Petroleum Corporation Limited (CPCL) for the characterization of Plastic Pyrolysis oil. The authors are also thankful to Sri Venkateswara College of Engineering, Sriperumbudur, where the experimental research on the engine was performed.References
- S. D. A. Sharuddin, F. Abnisa, W. M. A. Wan Daud and M. Kheireddine Aroua, Energy Convers. Manage., 2016, 115, 308–326 CrossRef.
- I. Kalargaris, G. Tian and S. Gu, Fuel Process. Technol., 2017, 157, 108–115 CrossRef CAS.
- B. K. Sharma, B. R. Moser, K. E. Vermillion, K. M. Doll and N. Rajagopalan, Fuel Process. Technol., 2014, 122, 79–90 CrossRef CAS.
- V. K. Kaimal and P. Vijayabalan, J. Waste Manag., 2016, 51, 91–96 CrossRef CAS.
- J. Devaraj, Y. Robinson and P. Ganapathi, Energy, 2015, 85, 304–309 CrossRef CAS.
- S. Uslu and M. B. Celik, Int. J. Eng. Sci. Technol., 2018, 21, 1194–1201 Search PubMed.
- P. Bridjesh, P. Periyasamy, A. V. Krishna Chaitanya and N. K. Geetha, Sustainable Environ. Res., 2018, 28, 142–147 CrossRef CAS.
- M. Mani, G. Nagarajan and S. Sampath, Energy, 2011, 36, 212–219 CrossRef CAS.
- V. K. Kaimal and P. Vijayabalan, J. Energy Inst., 2017, 90, 324–330 CrossRef CAS.
- H. Venkatesan, S. Sivamani, K. Bhutoria and H. H. Vora, Alexandria Eng. J., 2018, 57, 2257–2263 CrossRef.
- A. S. Ayodhya, V. T. Lamani, M. Thirumoorthy and G. N. Kumar, J. Energy Inst., 2019, 92, 341–350 CrossRef CAS.
- D. Damodharan, A. P. Sathiyagnanam, D. Rana, S. Saravanan, B. Rajesh Kumar and B. Sethuramasamyraja, Energy Convers. Manage., 2018, 166, 81–97 CrossRef CAS.
- D. Damodharan, A. P. Sathiyagnanam, D. Rana, B. Rajesh Kumar and S. Saravanan, Energy Convers. Manage., 2017, 131, 117–126 CrossRef CAS.
- A. Uyumaz, B. Aydoğan, H. Solmaz, E. Yılmaz, D. Yeşim Hopa, T. Aksoy Bahtli, Ö. Solmaz and F. Aksoy, J. Energy Inst., 2018, 1–13 Search PubMed.
- E. Hürdoğan, C. Ozalp, O. Kara and M. Ozcanli, Int. J. Hydrogen Energy, 2017, 42, 23373–23378 CrossRef.
- V. Chintala, P. Godkhe, S. Phadtare, M. Tadpatrikar, J. K. Pandey and S. Kumar, Energy Convers. Manage., 2018, 166, 579–589 CrossRef CAS.
- I. Kalargaris, G. Tian and S. Gu, Energy Procedia, 2017, 142, 49–54 CrossRef CAS.
- D. Damodharan, A. P. Sathiyagnanam, D. Rana, B. R. Kumar and S. Saravanan, Energy Convers. Manage., 2018, 161, 294–305 CrossRef CAS.
- S. Sharma and S. Mallubhotla, Zero Waste, 2019, 105–113 Search PubMed.
- R. Bagri and P. T. Williams, J. Anal. Appl. Pyrolysis, 2002, 63, 29–41 CrossRef CAS.
- I. Ahmad, M. Ismail Khan, H. Khan, M. Ishaq, R. Tariq, K. Gul and W. Ahmad, Int. J. Green Energy, 2015, 12, 663–671 CrossRef CAS.
- S. Gopinath and P. K. Devan, Iran. J. Chem. Chem. Eng., 2020, 39, 91–103 Search PubMed.
- Y. Sakata, M. A. Uddin and A. Muto, J. Anal. Appl. Pyrolysis, 1997, 43, 15–25 CrossRef CAS.
- H. Hamid and Y. Armando, J. Anal. Appl. Pyrolysis, 2014, 109, 272–277 CrossRef.
- R. Miandad, M. A. Barakat, A. S. Aburiazaiza, M. Rehan and A. S. Nizami, Process Saf. Environ. Prot., 2016, 102, 822–838 CrossRef CAS.
- S. L. Wong, N. Ngadi, T. A. T. Abdullah and I. M. Inuwa, Renewable Sustainable Energy Rev., 2015, 50, 1167–1180 CrossRef CAS.
- A. Drews, Man. Hydrocarb. Anal., 6th edn, 2008, vol. 91, p. 190 Search PubMed.
- R. Lyer, Biofuels, 2014, 5, 565–568 CrossRef CAS.
- G. R. Strobl, M. J. Schneider and I. G. Voigt-Martin, J. Polym. Sci., Polym. Phys. Ed., 1980, 18, 1361–1381 CrossRef CAS.
- X. Kai, T. Yang, S. Shen and R. Li, Energy Convers. Manage., 2019, 181, 202–213 CrossRef CAS.
- R. K. Singh, B. Ruj, A. K. Sadhukhan, P. Gupta and V. P. Tigga, Fuel, 2019, 116539 Search PubMed.
- C. Bibin, P. Seenikannan and P. K. Devan, J. Therm. Sci., 2020, 24, 13–25 CrossRef.
- C. Bibin and P. Seenikannan, Adv. Mater. Res., 2013, 768, 158–163 CAS.
- S. Kumar, R. Prakash, S. Murugan and R. K. Singh, Energy Convers. Manage., 2013, 74, 323–331 CrossRef CAS.
- V. L. Mangesh, S. Padmanabhan, P. Tamizhdurai, S. Narayanan and A. Ramesh, J. Hazard. Mater., 2019, 121453 Search PubMed.
- J. Heywood, Internal Combustion Engine Fundamentals 2E, Tata McGraw Hill, 2nd edn, 2018 Search PubMed.
- V. L. Mangesh, S. Padmanabhan, P. Tamizhdurai and A. Ramesh, J. Cleaner Prod., 2019, 119066 Search PubMed.
- S. Ramalingam and N. V. Mahalakshmi, RSC Adv., 2020, 10, 4274–4285 RSC.
- M. Z. H. Khan, M. Sultana, M. R. Al-Mamun and M. R. Hasan, J. Environ. Public Health, 2016, 7869080 CAS.
- R. Kumar, M. K. Mishra, S. K. Singh and A. Kumar, J. Mech. Sci. Technol., 2016, 30, 4781–4789 CrossRef.
- M. Mani, G. Nagarajan and S. Sampath, Fuel, 2010, 89, 1826–1832 CrossRef CAS.
- J. Holman, Experimental Methods for Engineers, Tata McGraw Hill, 2011 Search PubMed.
| This journal is © The Royal Society of Chemistry 2020 |

