
 Open Access Article
 This Open Access Article is licensed under a Creative Commons Attribution-Non Commercial 3.0 Unported Licence
Micron-sized SiOx/N-doped carbon composite spheres fabricated with biomass chitosan for high-performance lithium-ion battery anodes†
Dajin Liuab,
Zhipeng Jiangab,
Wei Zhanga,
Jingqi Maab and
Jia Xie *a
*a
aState Key Laboratory of Advanced Electromagnetic Engineering and Technology, School of Electrical and Electronic Engineering, Huazhong University of Science and Technology, Wuhan 430074, China. E-mail: xiejia@hust.edu.cn
bState Key Laboratory of Materials Processing and Die & Mould Technology, School of Materials Science and Engineering, Huazhong University of Science and Technology, Wuhan 430074, China
First published on 20th October 2020
Abstract
To achieve superior lithium storage performance, SiOx is usually designed into nanostructured SiOx/C composites by complex or expensive methods. Here, micron-sized interconnected SiOx/N-doped carbon (NC) microspheres composed of evenly dispersed SiOx nano-domains and NC have been fabricated by a scalable microemulsion method and following pyrolysis, using vinyltriethoxysilane and chitosan as precursors. The unique structure of the micron-sized SiOx/NC spheres leads to enhanced structural integrity and enables stable long-term cycling (800 cycles at 2 A g−1). Benefiting from the enhanced electron/Li+ diffusion kinetics originated from the unique structure and N-doping, SiOx/NC-2 presents considerable capacitive-controlled Li storage capacity, which leads to outstanding rate capability. Consequently, the assembled SiOx/NC-2//LiFePO4 full cell exhibits superior rate capability (106 mA h g−1 at 4C) and stable long-term cycling at 2C (102 mA h g−1 after 350 cycles). This work opens a new door for the application of chitosan in building micron-sized high-performance SiOx/C anode materials, and to some extent facilitates the recycling of waste seafood shells.
Introduction
With high energy density and long cycle life, rechargeable Li-ion batteries (LIBs) have been widely used as a power source for smartphones and electronic vehicles (EVs), and greatly fueled their development in the past two decades.1–5 However, traditional LIBs with graphite as anodes cannot satisfy the rapidly growing need for high energy density. Aiming at improving the energy and power density of LIBs, a series of high-capacity new anode materials have been explored. Among them, Si-based materials are considered as the most promising ones for industrial application, because of their super-high theoretical capacity, appropriate working voltage and natural abundance.6–8 Unfortunately, the Si anode suffers from huge volume change during cycling and poor conductivity, both of which lead to poor cycling stability.9,10 Benefiting from the reduced volume variation during cycling and the buffering effect of in situ generated lithium silicates and Li2O,11,12 SiOx anodes generally maintain better cycling stability than the Si anodes.12–14 However, SiOx also needs to be combined with other conductive buffer materials at the nano-scale because of its poor electron/Li+ conductivity and non-negligible volume change during charge/discharge processes.It has been reported that carbon can effectively improve the conductivity and structural integrity of SiOx.15–17 In order to enhance cycling stability, coulombic efficiency, and rate capability, SiOx is usually designed as nanostructured SiOx/C composites.15–32 Stöber method is one of the most commonly used methods for constructing SiOx/C nanocomposites. But the extensive requirement of solvents lowers its availability. Moreover, to substantially enhance conductivity and mechanical property, graphene (oxides) and carbon nanotubes are massively used in some SiOx/C composite materials, which inevitably increases the cost of the prepared SiOx/C composites and hinders their mass production.20,31,33,34 Thus it is desirable to prepare SiOx/C anode materials by using more available methods, low-cost and renewable carbon precursors, and achieve superior lithium storage performance.
Chitosan (CS), extracted from waste crab and shrimp shells, is one of the most abundant and least expensive natural polymers on earth.35,36 Every year, 6–8 million tons of such waste shells are generated from the seafood industry globally, and many of them are directly dumped in landfills or the sea.37 The industrial application of chitin and CS can not only realize the recycling of waste, but also ease the pressure on the environment.38,39 Recently, CS has been used to develop CS-based binders and gel polymer electrolytes for LIBs and Li-ion capacitors (LICs).40–45 Because of its high nitrogen content, CS is also a favored precursor for electrode materials such as N-doped activated carbon or nano-composites composed of metal oxides and N-doped carbon (NC).46–48 N-doping can effectively enhance electronic conductivity and contributes extra pseudocapacitive capacity, thus improving electrochemical performance.49 Although CS is favored in constructing metal oxides/NC composites, so far, the preparation of SiOx/NC composite anode materials by CS has not been reported.
In this work, for the first time, chitosan was used as a carbon precursor to fabricate micron-sized spherical SiOx/NC composites. The strong hydrogen bonding effect between chitosan molecules and the hydrolyzed organosilica nanoparticles facilitates the uniform dispersion of the organosilica nanoparticles, consuming much less solvents than traditional Stöber method and finally ensuring the homogeneous distribution of SiOx and NC. SiOx/NC microspheres with average diameters less than 3 μm and controllable carbon content were synthesized with a scalable microemulsion method followed by carbonization. The uniform distribution of SiOx nano-domains in NC can effectively enhance the structural integrity of SiOx, leading to excellent long-term cycling performance. Due to the unique structural features and N-doping, the SiOx/NC composite exhibited considerable capacitive-controlled Li storage capacity, which contributes to superior rate capability. Such electrochemical performances enabled stable full-cell operations when coupled with LiFePO4. Consequently, after 350 cycles at 2C, the assembled SiOx/NC-2//LiFePO4 full cell maintains a capacity retention of 89%.
Experimental section
Sample preparation
To prepare the SiOx/NC microspheres, 1 g of chitosan (CS, 200–400 mPa s, deacetylation degree ≥80%, Aladdin Chemistry Co.) and certain amounts of vinyltriethoxysilane (VTES, Aladdin Chemistry Co.) were used as the precursors of NC and SiOx, respectively. The organosilica/chitosan (organosilica/CS) composites synthesized by adding 2, 2.5 and 3 g of VTES were designated as organosilica/CS-1, organosilica/CS-2, and organosilica/CS-3, respectively, and the corresponding carbonization products were labelled as SiOx/NC-1, SiOx/NC-2, and SiOx/NC-3, respectively.To synthesize SiOx/NC-2, 1 g of chitosan was dispersed in 25 ml 1.5% acetic solution to form a transparent solution. After slowly adding 2.5 g of VTES, the solution was continuously stirred overnight at room temperature to obtain viscous organosilica/CS-2 solution. A well-mixed suspension containing 120 ml of liquid paraffin and 5.5 g of sorbitan trioleate (Span 85) was dispersed in a reactor and stirred at 1000 rpm for 0.5 h. Then the organosilica/CS-2 solution was added into the reactor and stirred at 1400 rpm for 1 h. Then, 3 g polyoxyethylene sorbitan trioleate (Tween 85) was added into the suspension and kept stirring at 1400 rpm for another 1 h. Subsequently, a solution containing 3 ml ammonia (28%) in 10 ml isopropanol was added dropwise into the vessel and stirred at 1400 rpm for 1 h to coagulate the organosilica/CS droplets. After vacuum filtration and washing with petroleum ether, ethanol, and deionized water (DW), the sample was dried in a freeze-dryer at −60 °C for 24 h. To obtain the black SiOx/NC-2 powder, the freeze-dried white organosilica/CS-2 powders were carbonized at 1000 °C in a tube furnace for 3 h, in Ar/H2 (95/5) atmosphere.
The synthesis of SiOx/NC-1 and SiOx/NC-3 were similar to that of SiOx/NC-2, except the weight of VTES was 2 g and 3 g, respectively. Bare NC sample was prepared by etching SiOx/NC-2 microspheres with 10% HF solution for 6 h.
Materials characterization
The Brunauer–Emmett–Teller (BET) specific surface area measurements of the SiOx/NC composites were performed on a Micromeritics ASAP 2020 analyzer. To investigate the phase composition of the SiOx/NC composites, a PANalytical X'Pert X-ray diffractometer was used to measure the X-ray diffraction (XRD) patterns. Thermo gravimetric analysis (TGA) data were collected by a STA-449C thermogravimetric apparatus in air atmosphere. X-ray photoelectron spectrum (XPS) data of the samples were obtained on a VG Multi Lab 2000 apparatus. Transmission-electron-microscopy (TEM) and scanning electron microscopy (SEM) images of the SiOx/NC samples were taken by using a Tenia G200 FEI STEM/EDS microscope and a Nova NanoSEM 450 scanning electron microscope, respectively.Measurements of electrochemical performances
The electrochemical performances of the SiOx/NC composites and NC were tested by using CR2032 coin cells. The SiOx/NC composite or bare NC, Super-P, and sodium alginate (75![[thin space (1/6-em)]](https://www.rsc.org/images/entities/char_2009.gif) :10:15, by weight) were mixed in DW to form a slurry. Then the formed slurry was casted to a Cu foil. The mass loading of the active material was controlled at 0.9–1.2 mg cm−2. The foil was dried at 100 °C in a vacuum oven over night. The electrolyte was 1.3 M lithium hexafluorophosphate (LiPF6) in a mixed solution of ethylene carbonate/diethylene carbonate/fluoroethylene carbonate (EC/DEC/FEC, 30:60:10, by volume). The rate capability and cycling performance of the assembled half and full cells were tested galvanostatically on a Neware battery testing system. Cyclic voltammetry (CV) at various sweep rates was tested by using a Solartron 1470E electrochemical workstation. Electrochemical impedance spectroscopy (EIS) of the SiOx/NC composites was tested by using a CHI600E electrochemical workstation. The N/P ratio of the SiOx/NC-2//LiPFeO4 (LFP) full cells was about 1.2. The weight ratio of LFP:Super-P:PVDF in the cathode was 80:10:10. The SiOx/NC-2 anodes were pre-lithiated in half cells to contemplate the lithium loss of the initial lithiation process. The galvanostatical charge/discharge test of SiOx/NC-2//LFP full cells were performed at 0.2–4C in a voltage range of 2.2–3.8 V. The capacities of the full cells are calculated based on the weight of LFP (1C = 170 mA h g−1).
:10:15, by weight) were mixed in DW to form a slurry. Then the formed slurry was casted to a Cu foil. The mass loading of the active material was controlled at 0.9–1.2 mg cm−2. The foil was dried at 100 °C in a vacuum oven over night. The electrolyte was 1.3 M lithium hexafluorophosphate (LiPF6) in a mixed solution of ethylene carbonate/diethylene carbonate/fluoroethylene carbonate (EC/DEC/FEC, 30:60:10, by volume). The rate capability and cycling performance of the assembled half and full cells were tested galvanostatically on a Neware battery testing system. Cyclic voltammetry (CV) at various sweep rates was tested by using a Solartron 1470E electrochemical workstation. Electrochemical impedance spectroscopy (EIS) of the SiOx/NC composites was tested by using a CHI600E electrochemical workstation. The N/P ratio of the SiOx/NC-2//LiPFeO4 (LFP) full cells was about 1.2. The weight ratio of LFP:Super-P:PVDF in the cathode was 80:10:10. The SiOx/NC-2 anodes were pre-lithiated in half cells to contemplate the lithium loss of the initial lithiation process. The galvanostatical charge/discharge test of SiOx/NC-2//LFP full cells were performed at 0.2–4C in a voltage range of 2.2–3.8 V. The capacities of the full cells are calculated based on the weight of LFP (1C = 170 mA h g−1).
Results and discussion
The micron-sized SiOx/NC microspheres were fabricated by a simple and scalable microemulsion method followed by high-temperature carbonization, as illustrated in Fig. 1a. The microemulsion used in this work can be classified as water-in-oil (W/O) system. Before emulsification, VTES was slowly hydrolyzed and condensed in an acetic acid solution of CS to form organosilica nanoparticles. As shown in Fig. S1,† compared with raw CS, the obvious redshift of the vibration peaks of –NH2 and –OH in organosilica/CS composite demonstrates the strong hydrogen binding effect between CS and the formed organosilica nanoparticles. In addition, with the hydrolysis and condensation of VTES, the CS solution gradually becomes more and more viscous, further confirming the strong hydrogen binding effect. Such strong hydrogen binding effect is beneficial for the uniform dispersion of the organosilica nanoparticles in the water phase. The water phase droplets were coagulated when ammonia was dropped into the emulsion system. After freeze-drying, the white organosilica/CS powder with homogeneous distribution of the organosilica nanoparticles in the CS matrix was obtained. The SiOx/NC microspheres can be readily fabricated by pyrolysis of the organosilica/CS powder in Ar/H2 atmosphere.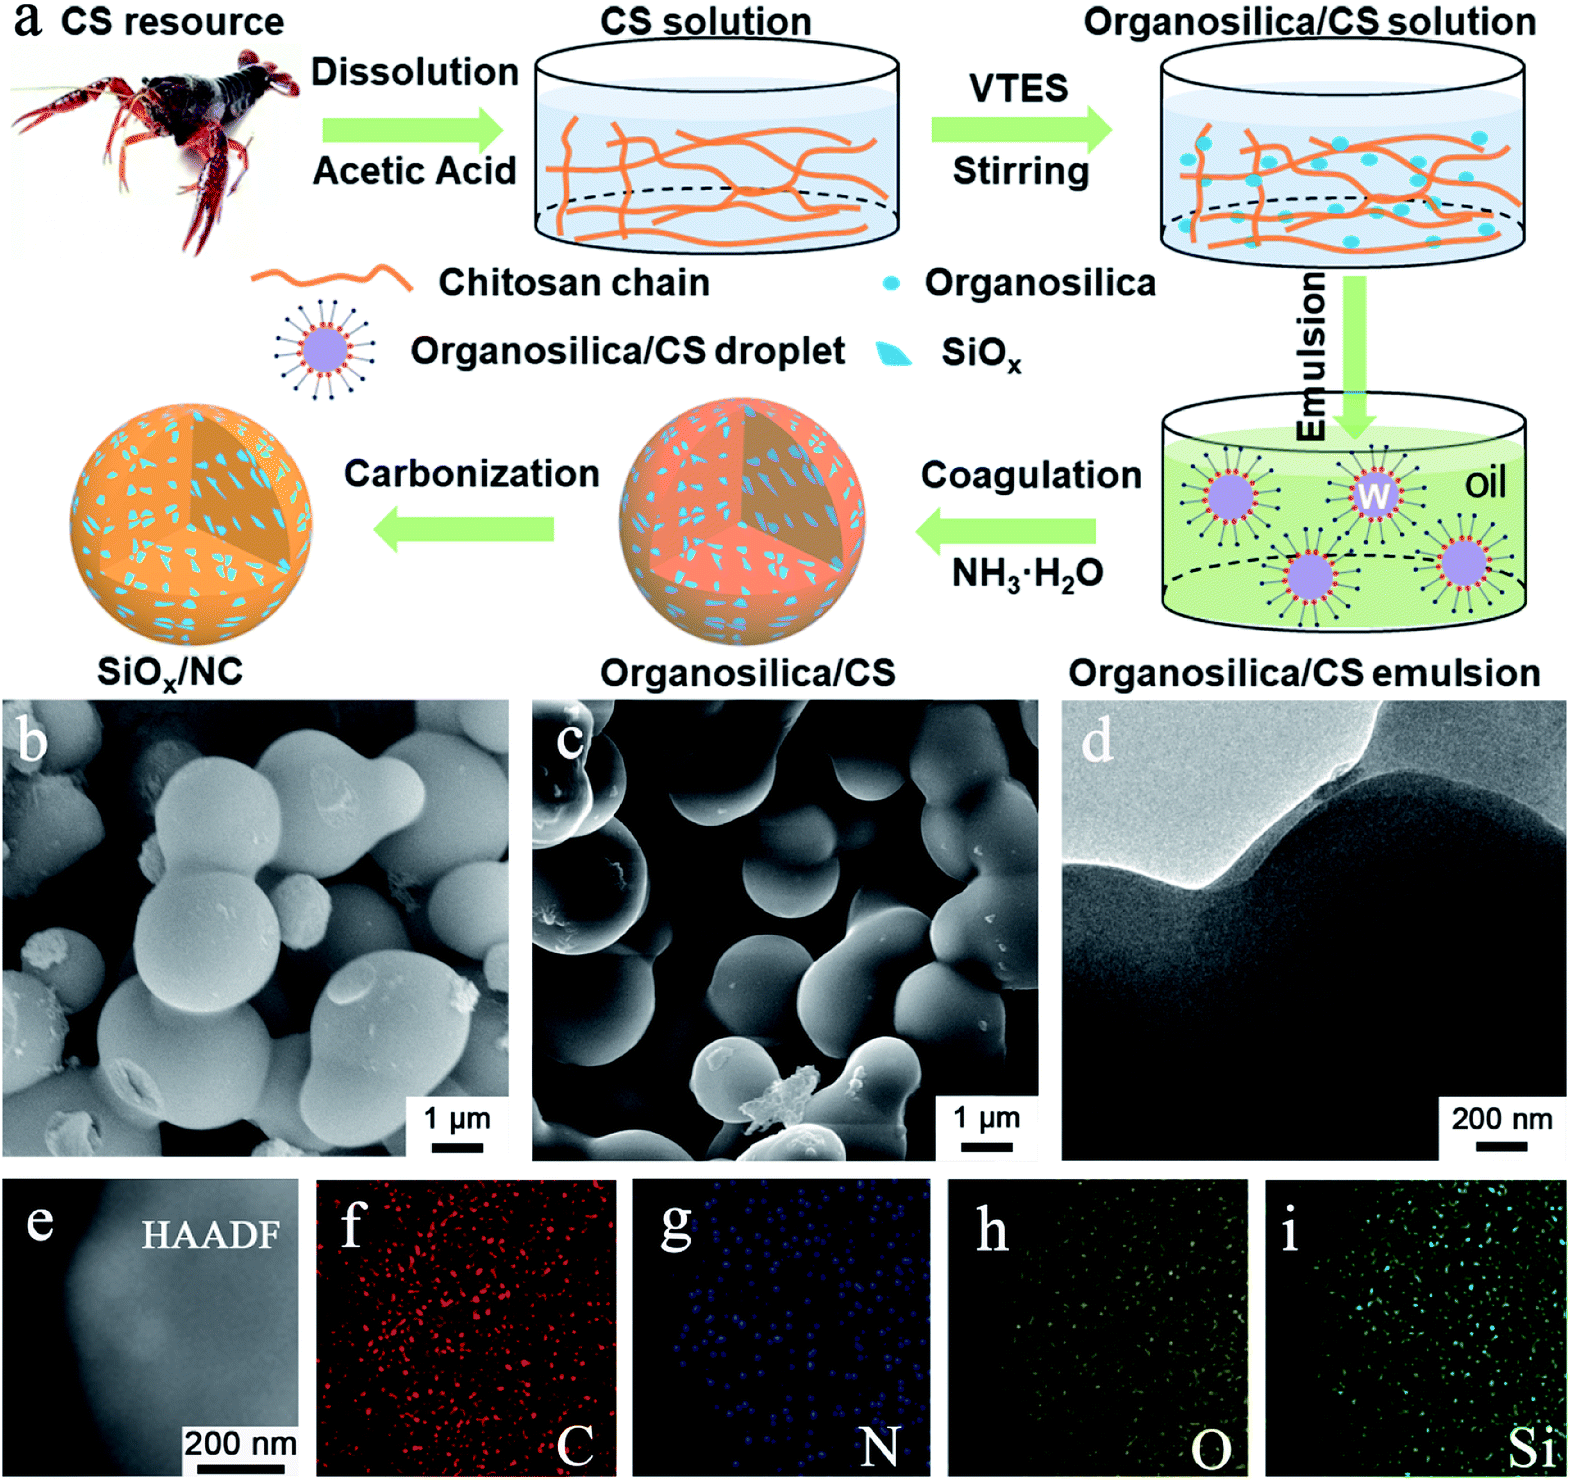 | ||
| Fig. 1 (a) Fabrication process of SiOx/NC microspheres, (b) SEM image of organosilica/CS-2, (c) SEM image of SiOx/NC-2, (d) TEM and (e) HAADF-STEM images of SiOx/NC-2, (f–i) EDS elemental mapping images corresponding to (e). | ||
It is noteworthy that most of the SiOx and nano-Si anode materials prepared by Stöber method consume extensive solvent (Table S1†). Consequently, the reported materials cannot be produced in a large scale. As shown in Table S1,† the solvent consumption in the hydrolysis process in this work is greatly reduced compared with the literature, which enables the large-scale synthesis of the SiOx/NC composites. It is believed that the organosilica/CS solution can also be applied in the spray-drying method, which will facilitate more efficient preparation of micron-sized SiOx/NC spheres.
The organosilica/CS samples are interconnected microspheres with smooth surface and compact structure (Fig. 1b, S2a and S3a†). As the organosilica content increases, the average diameter of the microspheres increases. After calcination, the SiOx/NC samples inherited the smooth spherical morphology and compact structure of the organosilica/CS spheres (Fig. 1b, c, S2b and S3b†). According to the SEM and TEM observation, the average diameter of the SiOx/NC microspheres also increases slightly with the increase of SiOx content. According to the SEM and TEM (Fig. 1d) observation, the average particle sizes of SiOx/NC-1, SiOx/NC-2, and SiOx/NC-3 are estimated to be ∼0.8, 1.5, and 2.5 μm, respectively. Compared with nanomaterials, such micron-sized SiOx/NC composites possess lower specific surface and higher tap density, which is favorable for less side reaction and higher volumetric capacity.50 The elemental mapping results (Fig. 1e–i) demonstrate that C, N, O, and Si distribute evenly in micron-sized SiOx/NC spheres, indicating that the SiOx nano-domains are also uniformly dispersed in NC matrix. The XRD patterns (Fig. S4†) of the SiOx/NC composites are almost identical. Only some broad diffraction peaks can be identified, indicating that both the SiOx and NC are amorphous. The broad diffraction peaks centered at ∼23° and ∼43° belong to SiOx and NC, respectively. The Raman spectra of the SiOx/NC composites are presented in Fig. S5.† The intense peaks located at approximately 1330 and 1600 cm−1 are corresponding to the D-band and G-band of NC, respectively. The ID/IG ratio for SiOx/NC-1, SiOx/NC-2, and SiOx/NC-3 are estimated to be 1.12, 1.14, and 1.05, respectively, suggesting that a large number of defects have been introduced by N-doping. Two bumps of the 2D-band also appear at around 2650 and 2900 cm−1, indicating the existence of graphitized carbon.32
The specific surface areas as well as pore size distribution of the SiOx/NC composites are analyzed via nitrogen adsorption method (Fig. S6†). The obtained specific surface areas of the SiOx/NC-1, SiOx/NC-2, and SiOx/NC-3 micron-sized spheres are 17.4, 10.5, and 6.0 m2 g−1, respectively. The pore volumes of SiOx/NC-1, SiOx/NC-2, and SiOx/NC-3 are 0.07, 0.04, and 0.03 cm3 g−1, respectively. Such a micron-sized moderate porous spherical structure of SiOx/NC is very favorable for obtaining high tap density, minimizing side effect as well as achieving high volumetric energy density. Thermogravimetric analysis (TGA) was performed in the air to estimate the SiOx content of the SiOx/NC composites. Based on the TGA results (Fig. S7†), the SiOx contents of SiOx/NC-1, SiOx/NC-2, and SiOx/NC-3 are calculated to be about 65%, 59%, and 51%, respectively. The actual SiOx content of the SiOx/NC composites should be slightly lower than the calculated results, because SiOx domains are oxidized to SiO2 during TGA testing.
Consistent with the EDS results, the XPS survey spectrum (Fig. 2a) reveals that the SiOx/NC-2 sample is composed of Si, O, C, and N. After calcination at 1000 °C, the N 1s signal is very weak, and the N content of NC is determined to be 0.76 wt% by XPS elemental analysis. As shown in Fig. 2b, the broad high-resolution Si 2p peak are divided into three peaks, corresponding to Si2+, Si3+, and Si4+ respectively. The Si2+:Si3+:Si24+ ratio is calculated to be 21.36%:33.62%:45.02%, and an average valence state of 3.24 is determined (corresponding to an x value of 1.62). The calculated average valence state value is very close to the theoretical one (3.0). The C 1s spectrum (Fig. 2c) can be divided into three peaks, locating at 284.9, 286.2, and 289.4 eV, corresponding to C–C/C![[double bond, length as m-dash]](https://www.rsc.org/images/entities/char_e001.gif) C, C–N/C–O, and CO bonds, respectively.51,52 Fig. 2d presents the high resolution N 1s spectrum. The peak located at 401.1 eV is attributed to graphitic-N, and the one centered at 398.9 eV corresponds to pyridinic-N.25 It has been reported that N-doping is beneficial to improve the electron/ion conductivity of the carbon matrix.53
C, C–N/C–O, and CO bonds, respectively.51,52 Fig. 2d presents the high resolution N 1s spectrum. The peak located at 401.1 eV is attributed to graphitic-N, and the one centered at 398.9 eV corresponds to pyridinic-N.25 It has been reported that N-doping is beneficial to improve the electron/ion conductivity of the carbon matrix.53
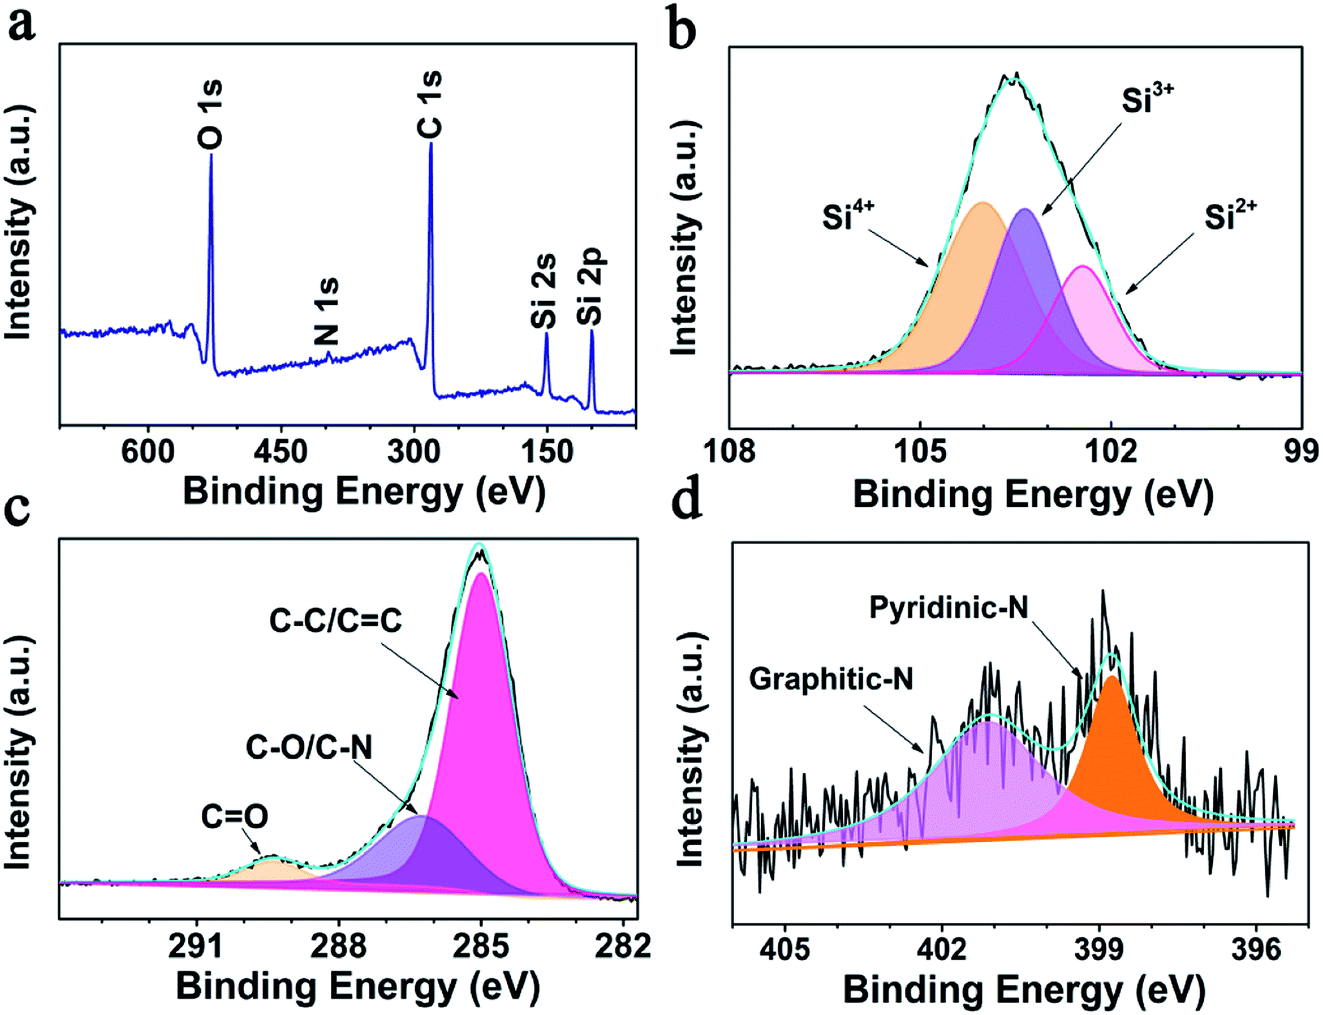 | ||
| Fig. 2 XPS analysis of SiOx/NC-2 (a) survey spectrum, (b–d) Si 2p, N 1s, and C 1s high-resolution spectra, respectively. | ||
As shown in Fig. 3a and S8,† the initial CV curves of the SiOx/NC electrodes scanned at 0.1 mV s−1 are similar in shape. In the first cathodic process, the peak at ∼1.2 V corresponds to the formation of the solid electrolyte interface (SEI) layer.19 The peak located at ∼0.75 V cannot be observed in the following cycles. This peak relates to the irreversible reaction between Li and SiOx, and the formation of Si, Li2O, and various lithium silicates.19 The sharp cathodic peak close to 0.01 V is ascribed to lithiation of the in situ formed Si. The broad anodic peak below 1.2 V is associated with the delithiation of LixSi alloy and the formation of amorphous Si.19 A reduction peak at ∼0.22 V appeared in the subsequent cycles, corresponding to the lithiation of the amorphous Si. The perfect overlap of the second and third curves indicates that the lithiation/delithiation reaction is highly reversible.
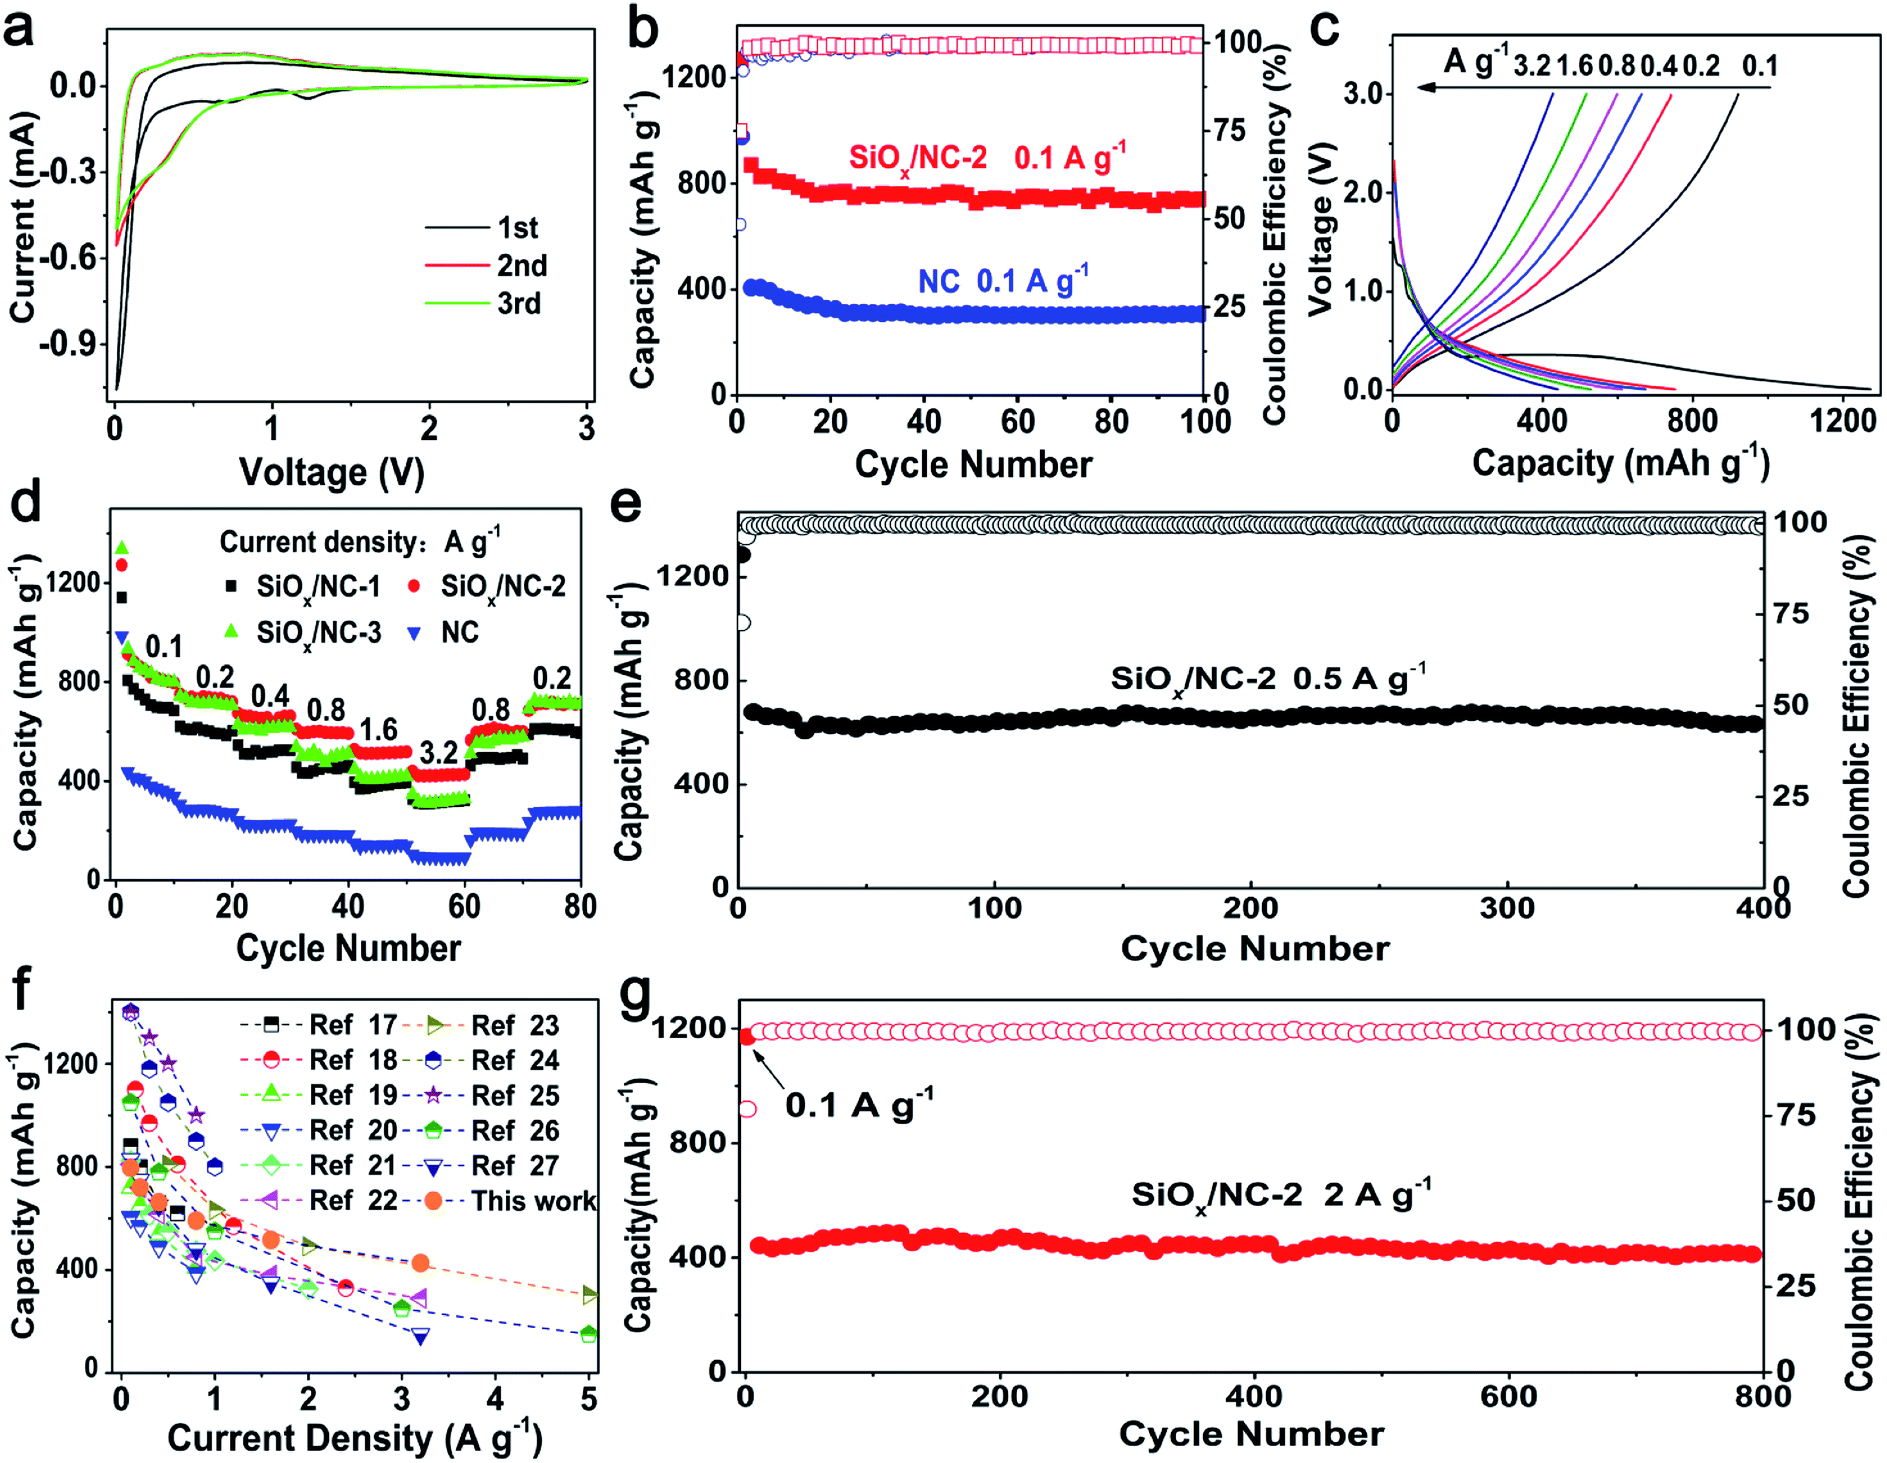 | ||
| Fig. 3 (a) CV curves of SiOx/NC-2, (b) cycling performance of SiOx/NC-2 and NC at 0.1 A g−1, (c) galvanostatic charge–discharge curves of SiOx/NC-2 and NC at 0.1–3.2 A g−1, (d) rate performance of the NC and SiOx/NC electrodes, (e) cycling performance of SiOx/NC-2 at 0.5 A g−1, (f) comparison of the rate performance of SiOx/NC-2 and literature, (g) long-term cycling performance of SiOx/NC-2 at 2 A g−1. | ||
The cycling performance of SiOx/NC-2 and bare NC at 0.1 A g−1 are shown in Fig. 3b. SiOx/NC-2 maintains a discharge capacity of 742 mA h g−1 after 100 cycles, corresponding to a capacity retention of 81.1% to the 2nd capacity. On the contrast, the bare NC electrode only maintains a specific capacity of 307 mA h g−1, demonstrating that SiOx contributes most of the capacity of the SiOx/NC composites. The selected charge–discharge profiles of SiOx/NC-2 at 0.1 A g−1 are presented in Fig. S10.† SiOx/NC-2 manifests an initial discharge capacity of 1270 mA h g−1 as well as an initial coulombic efficiency (ICE) of 74.9%. Such ICE is higher than many recently reported SiOx anodes.17,19,20,22,23,28
Fig. 3c displays the typical charge–discharge curves of SiOx/NC-2 at 0.1–3.2 A g−1 and Fig. 3d reveals the rate capability of bare NC and the SiOx/NC electrodes. The corresponding discharge specific capacity data are listed in Table S2.† These samples exhibit a stable cycling even at 3.2 A g−1. The electrodes can recover nearly 100% of the initial capacities, when the current density decreases to 0.2 A g−1, demonstrating the structural integrity of bare NC and the SiOx/NC microspheres. The capacity difference between SiOx/NC-2 and SiOx/NC-3 is negligible at 0.1 and 0.2 A g−1. While at 0.8, 1.6, and 3.2 A g−1, SiOx/NC-2 achieves discharge capacities of 592, 518, and 427 mA h g−1, respectively, evidently higher than the corresponding ones of SiOx/NC-3, although SiOx/NC-3 has a higher content of SiOx. The lower capacities of SiOx/NC-3 at high current densities can be explained by its higher charge-transfer resistance, which can be confirmed by the EIS spectra (Fig. S9†). At 0.2 and 3.2 A g−1, the bare NC electrode only delivers a capacity of 271 and 92 mA h g−1, respectively, confirming that SiOx is the primary active material. Fig. 3f compares the rate performance of SiOx/NC-2 and many reported SiOx/C composites with x values close to 1.5.17–27 For some reported SiOx/C composites, the rate performance are tested at current densities lower than 2 A g−1, and their capacities decrease sharply with the increase of current density. Some SiOx/C composites deliver much higher capacities than SiOx/NC-2 at 0.1 and 0.2 A g−1, but at about 3.2 A g−1, their discharge capacities are lower than that of SiOx/NC-2. At 3.2 A g−1, SiOx/NC-2 exhibits a discharge capacity of 427 mA h g−1, which is quite competitive among the recently reported SiOx-based composite electrodes. The superior rate capability of SiOx/NC-2 may be derived from the uniform dispersion of SiOx as well as N-doping.17,32,46
As shown in Fig. 3e and g, the SiOx/NC-2 also shows excellent long-term cycling performance at both 0.5 and 2 A g−1. After 400 deep charge–discharge cycling at 0.5 A g−1, SiOx/NC-2 maintains a discharge capacity of 637 mA h g−1, slightly lower than the capacity of the SiOx/C microspheres prepared with resorcinol/formaldehyde and VTES by Liu et al.17 However, the SiOx/NC-2 displays outstanding long-term cycling capability at a high current density of 2 A g−1, and retains a discharge capacity of 416 mA h g−1 after 800 cycles, corresponding to a capacity retention of 81% from the 4th cycle. The excellent cycling stability of SiOx/NC-2 benefits from its outstanding structural integrity. As shown in Fig. S11,† after 100 cycles, the SiOx/NC-2 preserves the micron-sized spherical geometry, demonstrating its structural integrity. The structural integrity originates from the unique structural features of SiOx/NC-2: (a) the SiOx species are divided into ultrafine nano-domains by the 3D NC matrix, thus the pulverization of SiOx can be effectively inhibited. (b) The NC matrix ensures the structural integrity of the micron-sized composite spheres by buffering the volume change of the SiOx nano-domains and preventing their aggregation.
According to previous reports, the outstanding rate performance may be related with the capacitive-controlled Li storage mechanism.54,55 Here, CV measurements at sweep rates of 0.2–2.0 mV s−1 were performed, to explore the Li storage mechanism of SiOx/NC-2. The obtained CV curves showed similar shapes with broad peaks (Fig. 4a). Generally, the capacitive behavior can be judged based on eqn (1).54
| ip = avb | (1) |
(v) − log(ip) plots. It is commonly accepted that a b-value of 0.5 and 1 indicates a diffusion-controlled and a capacitive-controlled Li storage mechanism, respectively. As displayed in Fig. 4b, the determined b-value of the anodic peak is 0.71, and the one of the cathodic peak is 0.65. These b-values suggest that both the capacitive-controlled and diffusion-controlled Li storage mechanisms contribute to the SiOx/NC-2 electrode. At a specific scan rate (v) and voltage (V), based on the relationship between current (i(V)), capacitive-controlled contribution (k1v), and diffusion-controlled contribution (k2v1/2): i(V) = k1v + k2v1/2, the ratio of capacitive-controlled capacity to the total Li storage capacity can be calculated quantitatively.54,55 Typically, at 1 mV s−1 (Fig. 4c), capacitive-controlled capacity accounts for about 41.1% of the total Li storage capacity. The ratio of capacitive-controlled capacity to the total capacity increases with the sweep rate (Fig. 4d), demonstrating that the capacitive-controlled mechanism facilitates more efficient Li+ insertion/extraction at higher scan rate. As a result, the SiOx/NC-2 electrode exhibits high rate capability and stable cycling at 2 A g−1. The pseudocapacitive effect of SiOx/NC-2 can be attributed to three factors: (a) the huge interfaces between SiOx nano-domains and NC matrix provide numerous active sites for Li storage; (b) N doping causes sufficient defects in the carbon matrix, thus enhances electron/ion transfer kinetics; (c) the uniform distribution of SiOx in NC matrix reduces the diffusion distance of electron and Li+, leading to further improved electrochemical kinetics.
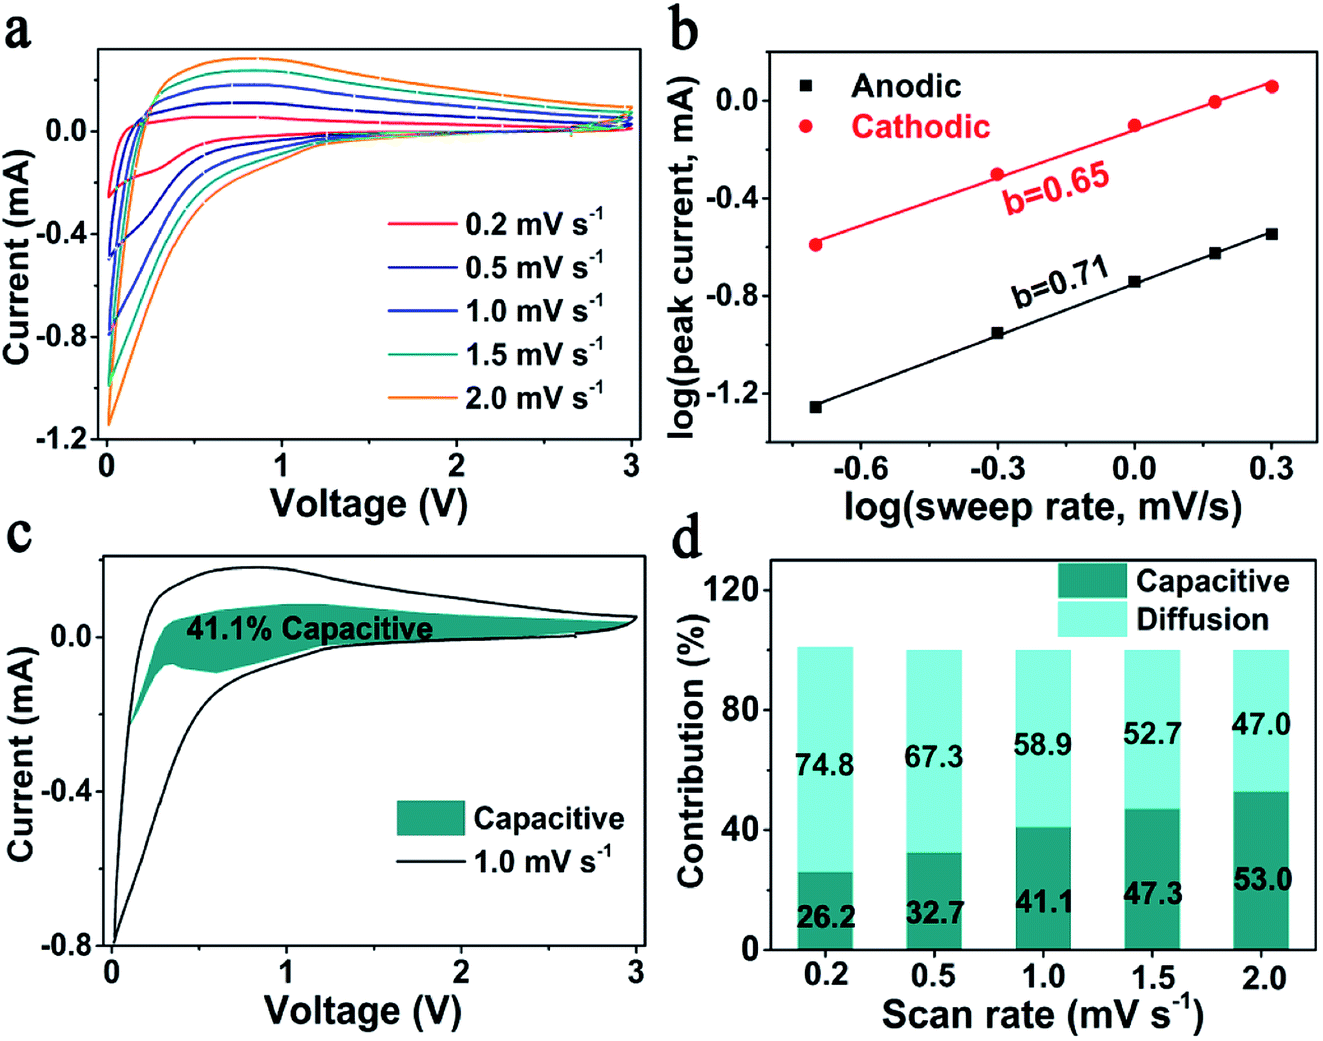 | ||
| Fig. 4 (a) CV curves of SiOx/NC-2 at 0.2–2.0 mV s−1, (b) plots of log(ip) vs. log(v), (c) capacitive-controlled contribution at 1 mV s−1, (d) capacitive-controlled contribution at 0.2–2.0 mV s−1. | ||
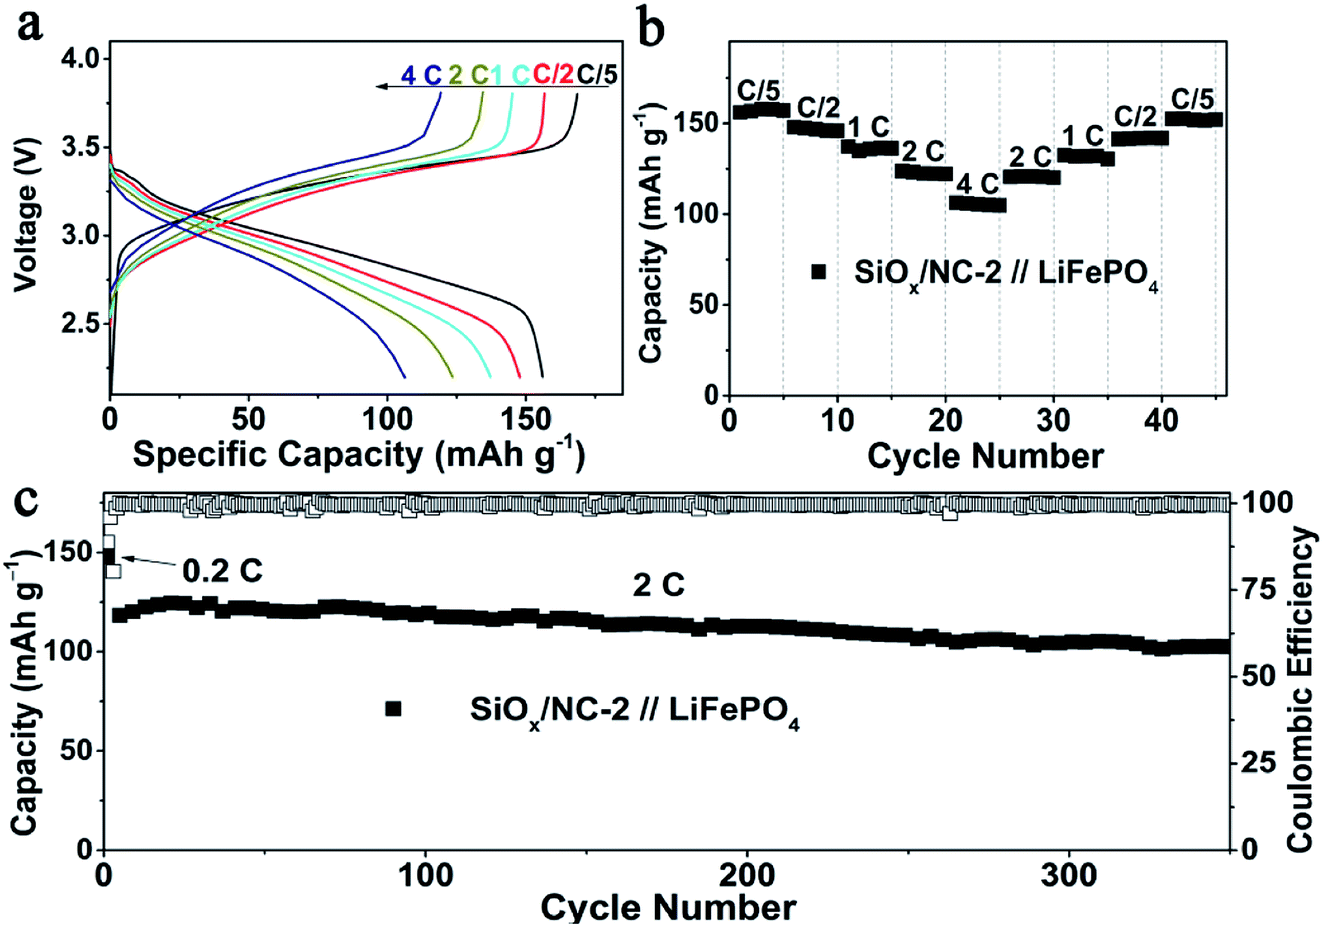
To evaluate the validity of the SiOx/NC-2 in LIBs, SiOx/NC-2//LFP full cells were assembled by using commercial LFP and SiOx/NC-2 as a cathode and anode, respectively. The N/P ratio of the full cell is controlled at around 1.2. Before the full cell assembly, the SiOx/NC-2 electrodes were pre-lithiated in a half cell to obtain a stable SEI layer. Base on the weight of LFP, at 0.2, 0.5, 1, 2 and 4C, the SiOx/NC-2//LFP full cell manifests specific capacities of 156, 148, 137, 123 and 106 mA h g−1, respectively (Fig. 5a). Due to the excellent rate capability of SiOx/NC-2, the assembled SiOx/NC-2//LFP full cell displays stable cycling at 4C (Fig. 5b). A specific capacity of 152 mA h g−1 is achieved, when the C-rate gradually decreases to 0.2C, demonstrating superior rate capability. The superior rate capability of the SiOx/NC-2//LFP full cell can be attributed to the enhanced structural integrity and the dual-model (battery-capacitive) Li storage mechanism of SiOx/NC-2. Consequently, the as assembled SiOx/NC-2//LFP full cell achieves a stable long-term cycling at a relatively high rate of 2C (Fig. 5c). After 350 cycles, the SiOx/NC-2//LFP full cell maintains a specific capacity of 103 mA h g−1, retaining 89% of the 3rd capacity. The superior rate capability and outstanding cycling stability demonstrate that the SiOx/NC-2//LFP full cell can serve as a potential high energy density power source with a certain quick-charge capability.
 | ||
| Fig. 5 Electrochemical performance of the SiOx/NC-2//LFP full cell, (a) galvanostatic charge/discharge profiles at 0.2–4C, (b) rate capability at 0.2–4C, (c) galvanostatic long cycling performance at 2C. | ||
The superior rate capability and excellent cycling stability of SiOx/NC-2 can be ascribed to the following points: (a) the electron and Li+ diffusion kinetics of active SiOx is significantly enhanced by its even distribution in the NC matrix. (b) The NC matrix ensures the structural integrity by alleviating the volume change and preventing the pulverization of SiOx. (c) The capacitive-controlled Li storage mechanism enables the high rate capability.
Conclusions
In summary, micron-sized SiOx/NC interconnected microspheres with tunable SiOx content (51–65 wt%) have been produced via a scalable microemulsion method with chitosan and VETS as the NC and SiOx precursor, respectively. With the uniform distribution of ultra-small SiOx domains in amorphous NC matrix, the SiOx/NC-2 microspheres exhibit considerable capacitive-controlled Li storage capacity and outstanding structural integrity, which contribute to the superior rate capability and excellent cycling stability. After 350 cycles at 2C, the assembled SiOx/NC-2//LFP full cell can maintain a specific capacity of 103 mA h g−1. This work provides an effective approach for constructing micron-sized high-performance SiOx/C anode materials by using chitosan as N-doped carbon precursor, and to some extent facilitates the recycling of waste seafood shells.Conflicts of interest
There are no conflicts to declare.Acknowledgements
This work was supported by the National Natural Science Foundation of China (No. 51821005, 21975087, U1966214, 51902116). We gratefully acknowledge the Analytical and Testing Center of HUST for allowing us to use its facilities.References
- M. N. Obrovac and V. L. Chevrier, Chem. Rev., 2014, 114, 11444–11502 CrossRef CAS.
- Y.-M. Chiang, Science, 2010, 330, 1485 CrossRef CAS.
- S. Choi, T. W. Kwon, A. Coskun and J. W. Choi, Science, 2017, 357, 279–283 CrossRef CAS.
- J. B. Goodenough and K. S. Park, J. Am. Chem. Soc., 2013, 135, 1167–1176 CrossRef CAS.
- Y. Sun, N. Liu and Y. Cui, Nat. Energy, 2016, 1, 16071 CrossRef CAS.
- X. Zuo, J. Zhu, P. Müller-Buschbaum and Y. J. Cheng, Nano Energy, 2017, 31, 113–143 CrossRef CAS.
- J. Yang, Y. Wang, W. Li, L. Wang, Y. Fan, W. Jiang, W. Luo, Y. Wang, B. Kong, C. Selomulya, H. K. Liu, S. X. Dou and D. Zhao, Adv. Mater., 2017, 29, 1700523 CrossRef.
- H. Shang, Z. Zuo, L. Yu, F. Wang, F. He and Y. Li, Adv. Mater., 2018, 30, 1801459 CrossRef.
- X. Hui, R. Zhao, P. Zhang, C. Li, C. Wang and L. Yin, Adv. Energy Mater., 2019, 9, 1901065 CrossRef.
- J. Sung, J. Ma, S.-H. Choi, J. Hong, N. Kim, S. Chae, Y. Son, S. Y. Kim and J. Cho, Adv. Mater., 2019, 31, 1900970 CrossRef.
- L. Zhang, J. Deng, L. Liu, W. Si, S. Oswald, L. Xi, M. Kundu, G. Ma, T. Gemming, S. Baunack, F. Ding, C. Yan and O. G. Schmidt, Adv. Mater., 2014, 26, 4527–4532 CrossRef CAS.
- Z. Li, H. Zhao, P. Lv, Z. Zhang, Y. Zhang, Z. Du, Y. Teng, L. Zhao and Z. Zhu, Adv. Funct. Mater., 2018, 28, 1605711 CrossRef.
- Z. Liu, Q. Yu, Y. Zhao, R. He, M. Xu, S. Feng, S. Li, L. Zhou and L. Mai, Chem. Soc. Rev., 2019, 48, 285–309 RSC.
- J. Lee, J. Moon, S. A. Han, J. Kim, V. Malgras, Y.-U. Heo, H. Kim, S.-M. Lee, H. K. Liu, S. X. Dou, Y. Yamauchi, M.-S. Park and J. H. Kim, ACS Nano, 2019, 13, 9607–9619 CrossRef CAS.
- Q. Xu, J.-K. Sun, Y.-X. Yin and Y.-G. Guo, Adv. Funct. Mater., 2018, 28, 1705235 CrossRef.
- J. Wang, H. Zhao, J. He, C. Wang and J. Wang, J. Power Sources, 2011, 196, 4811–4815 CrossRef CAS.
- Z. Liu, D. Guan, Q. Yu, L. Xu, Z. Zhuang, T. Zhu, D. Zhao, L. Zhou and L. Mai, Energy Storage Mater., 2018, 13, 112–118 CrossRef.
- J. Han, G. Chen, T. Yan, H. Liu, L. Shi, Z. An, J. Zhang and D. Zhang, Chem. Eng. J., 2018, 347, 273–279 CrossRef CAS.
- Y. Ren and M. Li, J. Power Sources, 2016, 306, 459–466 CrossRef CAS.
- Y. Ren, X. Wu and M. Li, Electrochim. Acta, 2016, 206, 328–336 CrossRef CAS.
- C. H. Gao, H. L. Zhao, J. Wang, J. Wang, C. L. Yan and H. Q. Yin, J. Electrochem. Soc., 2019, 166, A574–A581 CrossRef CAS.
- Z. Sang, Z. Zhao, D. Su, P. Miao, F. Zhang, H. Ji and X. Yan, J. Mater. Chem. A, 2018, 6, 9064–9073 RSC.
- M. Han and J. Yu, J. Power Sources, 2019, 414, 435–443 CrossRef CAS.
- J. Zhang, X. Zhang, C. Zhang, Z. Liu, J. Zheng, Y. Zuo, C. Xue, C. Li and B. Cheng, Energy Fuels, 2017, 31, 8758–8763 CrossRef CAS.
- J. Zhang, C. Zhang, Z. Liu, J. Zheng, Y. Zuo, C. Xue, C. Li and B. Cheng, J. Power Sources, 2017, 339, 86–92 CrossRef CAS.
- L. Sun, T. Su, L. Xu, M. Liu and H.-B. Du, Chem. Commun., 2016, 52, 4341–4344 RSC.
- H. Ming, J. Qiu, S. Zhang, M. Li, X. Zhu, L. Wang and J. Ming, ChemElectroChem, 2017, 4, 1165–1171 CrossRef CAS.
- J. Hu, L. Fu, R. Rajagopalan, Q. Zhang, J. Luan, H. Zhang, Y. Tang, Z. Peng and H. Wang, ACS Appl. Mater. Interfaces, 2019, 11, 27658–27666 CrossRef CAS.
- C. Guo, D. Wang, T. Liu, J. Zhu and X. Lang, J. Mater. Chem. A, 2014, 2, 3521–3527 RSC.
- Z. Liu, Y. Zhao, R. He, W. Luo, J. Meng, Q. Yu, D. Zhao, L. Zhou and L. Mai, Energy Storage Mater., 2019, 19, 299–305 CrossRef.
- Q. Xu, J.-K. Sun, Z.-L. Yu, Y.-X. Yin, S. Xin, S.-H. Yu and Y.-G. Guo, Adv. Mater., 2018, 30, 1707430 CrossRef.
- G. Zhu, F. Zhang, X. Li, W. Luo, L. Li, H. Zhang, L. Wang, Y. Wang, W. Jiang, H. K. Liu, S. X. Dou and J. Yang, Angew. Chem., Int. Ed., 2019, 58, 6669–6673 CrossRef CAS.
- Y. Chen, Q. Mao, L. Bao, T. Yang, X. Lu, N. Du, Y. Zhang and Z. Ji, Ceram. Int., 2018, 44, 16660–16667 CrossRef CAS.
- D. Liu, C. Chen, Y. Hu, J. Wu, D. Zheng, Z.-z. Xie, G. Wang, D. Qu, J. Li and D. Qu, Electrochim. Acta, 2018, 273, 26–33 CrossRef CAS.
- P. S. Bakshi, D. Selvakumar, K. Kadirvelu and N. S. Kumar, Int. J. Biol. Macromol., 2020, 150, 1072–1083 CrossRef CAS.
- X. Chen, H. Yang and N. Yan, Chem.–Eur. J., 2016, 22, 13402–13421 CrossRef CAS.
- Y. Ning and C. Xi, Nature, 2015, 524, 155 CrossRef.
- L. Gao, J. Ma, S. Li, D. Liu, D. Xu, J. Cai, L. Chen, J. Xie and L. Zhang, Nanoscale, 2019, 11, 12626–12636 RSC.
- J. Ma, L. Gao, S. Li, Z. Zeng, L. Zhang and J. Xie, Batteries Supercaps, 2020, 3, 165–173 CrossRef CAS.
- C. Chen, S. H. Lee, M. Cho, J. Kim and Y. Lee, ACS Appl. Mater. Interfaces, 2016, 8, 2658–2665 CrossRef CAS.
- Y. Gao, X. Qiu, X. Wang, A. Gu, L. Zhang, X. Chen, J. Li and Z. Yu, ACS Sustainable Chem. Eng., 2019, 7, 16274–16283 CrossRef CAS.
- X. Zhao, C.-H. Yim, N. Du and Y. Abu-Lebdeh, J. Electrochem. Soc., 2018, 165, A1110–A1121 CrossRef CAS.
- J. Y. Han, Y. Huang, Y. Chen, A. M. Song, X. H. Deng, B. Liu, X. Li and M. S. Wang, ChemElectroChem, 2020, 7, 1213–1224 CrossRef CAS.
- M. Ogino, D. Kotatha, Y. Torii, K. Shinomiya, S. Uchida, T. Furuike, H. Tamura and M. Ishikawa, Electrochemistry, 2020, 88, 132–138 CrossRef CAS.
- H. Z. Yang, Y. Liu, L. B. Kong, L. Kang and F. Ran, J. Power Sources, 2019, 426, 47–54 CrossRef CAS.
- C. Han, L. Xu, H. Li, R. Shi, T. Zhang, J. Li, C.-P. Wong, F. Kang, Z. Lin and B. Li, Carbon, 2018, 140, 296–305 CrossRef CAS.
- S. Huang, Z. Li, B. Wang, J. Zhang, Z. Peng, R. Qi, J. Wang and Y. Zhao, Adv. Funct. Mater., 2018, 28, 1706294 CrossRef.
- C. Li, X. Zhang, K. Wang, X. Sun and Y. Ma, Carbon, 2018, 140, 237–248 CrossRef CAS.
- Q. Niu, K. Gao, Q. Tang, L. Wang, L. Han, H. Fang, Y. Zhang, S. Wang and L. Wang, Carbon, 2017, 123, 290–298 CrossRef CAS.
- H. Jia, J. Zheng, J. Song, L. Luo, R. Yi, L. Estevez, W. Zhao, R. Patel, X. Li and J.-G. Zhang, Nano Energy, 2018, 50, 589–597 CrossRef CAS.
- S.-Z. Zeng, Y. Niu, J. Zou, X. Zeng, H. Zhu, J. Huang, L. Wang, L. B. Kong and P. Han, J. Power Sources, 2020, 466, 228234 CrossRef CAS.
- Y. Zhang, G. Hu, Q. Yu, Z. Liu, C. Yu, L. Wu, L. Zhou and L. Mai, Mater. Chem. Front., 2020, 4, 1656–1663 RSC.
- W. Luo, F. Li, J.-J. Gaumet, P. Magri, S. Diliberto, L. Zhou and L. Mai, Adv. Energy Mater., 2018, 8, 1703237 CrossRef.
- R. Xu, G. Wang, T. Zhou, Q. Zhang, H. P. Cong, S. Xin, J. Rao, C. Zhang, Y. Liu and Z. Guo, Nano Energy, 2017, 39, 253–261 CrossRef CAS.
- T. Brezesinski, J. Wang, S. H. Tolbert and B. Dunn, Nat. Mater., 2010, 9, 146–151 CrossRef CAS.
Footnote |
| † Electronic supplementary information (ESI) available. See DOI: 10.1039/d0ra07029g |
| This journal is © The Royal Society of Chemistry 2020 |