 Open Access Article
New cytotoxic natural products from the marine sponge-derived fungus Pestalotiopsis sp. by epigenetic modification†
Hui Lei a,
Dan Zhanga,
Nan Dingc,
Siwei Chena,
Can Songa,
Yu Luoa,
Xiujuan Fua,
Xiaoxu Bi*b and
Hong Niu
 *a
*a
aSchool of Pharmacy, Southwest Medical University, Luzhou, Sichuan 646000, People's Republic of China. E-mail: huilei@swmu.edu.cn
bCollege of Agriculture and Life Sciences, Kunming University, Kunming, Yunnan 50241, People's Republic of China
cInstitute of Pathogenic Biology, University of South China, Hengyang 421001, People's Republic of China
First published on 14th October 2020
Abstract
Four new polyketide derivatives, pestalotiopols A–D (1–4), together with seven known compounds (5–11), were isolated from a chemical-epigenetic culture of Pestalotiopsis sp. The structures and absolute configurations of the new compounds (1–4) were determined by spectroscopic analyses, Mo2-induced CD, and electronic circular dichroism (ECD) calculations. All the isolated compounds (1–11) were tested for their cytotoxic activities. Among these compounds, compounds 1, 2, 6 and 7 exhibited cytotoxicity against four human cancer cell lines with IC50 values of 16.5–56.5 μM. The structure–activity relationships of compounds (1–11) were examined. The results indicated that both the diol system of the side chain and the aldehyde group might contribute to the cytotoxic activity. The possible biosynthetic pathways for compounds (1–4) were also postulated.
Introduction
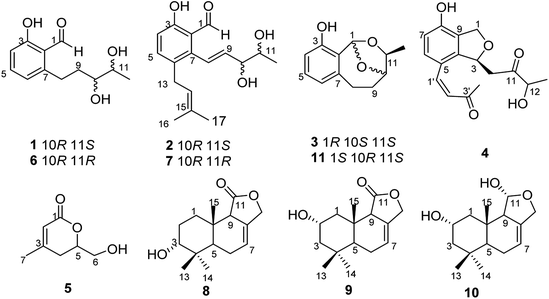
Pestalotiopsis is an asexual genus that is distributed widely in tropical and temperate ecosystems of the earth.1 Pestalotiopsis species had been obtained from diverse environments and were proven to be a rich source of secondary metabolites with unique structural features and diverse pharmacological properties.2–6 The world's first billion dollar anticancer drug, paclitaxel was isolated from the marine fungus Pestalotiopsis sp. reported in 1996.7 This was followed by the isolation of numerous new compounds with diverse chemical structures from the Pestalotiopsis genus.8–10 Some of these compounds exhibited diverse bioactivities including antitumor, anti-inflammatory, antibacterial, and anti-HCV.11–14Our previous investigation of a Pestalotiopsis sp. resulted in the isolation of several new compounds including polyketides,15 isocoumarins, and sesquiterpenoids.16 In order to obtain more new bioactive secondary metabolites from species of this genus, a strain of Pestalotiopsis sp. was treated with epigenetic modifier including 5-aza-2-deoxycytidine and DNA methyltransferase (RG 108). Application of the epigenetic modifier approach led to the production of four new polyketide derivatives, pestalotiopols A–D (1–4), together with seven known compounds, (S)-6-(hydroxymethyl)-4-methyl-5,6-dihydro-2H-pyran-2-one (5),17 heterocornols A, E, and F (6, 7, and 11),15 pestalotiopol B (8),18 dendocarbin B (9),19 2α-hydroxyisodrimeninol (10)19 (Fig. 1). Herein, details of the isolation, structural elucidation, and bioactivities of these compounds are reported.
Results and discussion
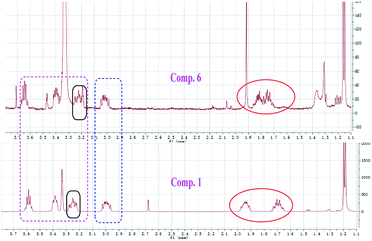
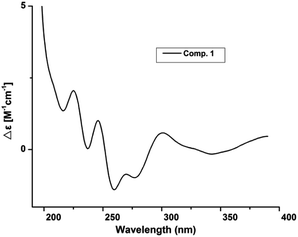
Compound 1 was obtained as white amorphous powder. Its molecular formula was determined to be C12H16O4 based on its HRESIMS spectrum data at m/z 223.1018 [M − H]− and 1H and 13C NMR data. A detailed analysis of its 1H NMR spectrum (Table 1) data displayed characteristic signals including three aromatic protons of a 1,2,3-trisubstituent benzene [δH 6.79 (d, J = 8.0), 7.45 (t, J = 8.0), 6.85 (d, J = 8.0)] and an aldehyde proton at δH 10.43 (1H, s). The 13C NMR and HSQC spectra of 1 (Table 1) displayed 12 carbon signals including one methyl, two methylenes, two oxygenated methines, three methines (three olefinic carbons), three nonprotonated carbons, and one aldehyde group at δC 197.3. The 1H and 13C NMR data of 1 were almost identical to those of heterocornol A (6) isolated from the same strain,15 indicating that both compounds had the same planar structures, except for the relative configuration at C-10 and C-11 in 1 and 6. This result was also confirmed by the chemical shifts of C-8 (ΔδC −0.2, ΔδH 0.02/−0.03), C-9 (ΔδC 0.3, ΔδH 0.12/−0.07), C-10 (ΔδC 0.3, ΔδH −0.02), C-11 (ΔδC 0.4, ΔδH −0.09), and C-12 (ΔδC 0.2, ΔδH 0.03) compared to the 1H and 13C NMR data of 6 (Fig. 2) (ESI†). According to the literature, the coupling constant of the same protons are larger than 4 Hz in erythro vicinal diols (J > 4.0 Hz) but smaller than 2 Hz in threo ones (J < 2.0 ppm).20 Based on the above analysis, the 1H NMR data of 1 revealed that H-10 and H-11 showed the coupling constant of 5.8 Hz, consistent with the known heterocornol A (6) (J = 5.1 Hz), indicating that the relative configuration of 10,11-diol corresponded to an erythro configuration. The absolute configuration of the erythro-10,11-diols in 1 was determined using Mo2(AcO)4-induced circular dichroism. The circular dichroism (CD) spectrum of 1 showed positive Cotton effect at 305 nm (Fig. 3), while the CD spectrum of 6 gave the negative Cotton effect at 325 nm according to the ref. 15. Additionally, the absolute configuration of the known heterocornol A (6) was determined using X-ray and Mo2(AcO)4-induced circular dichroism method. In order to verify the proposed structure, compound 1 was subjected to electronic circular dichroism (ECD) spectra analysis on the two possible conformers (10R,11S)-1 and (10S,11R)-1. The calculated ECD curve of (10R,11S)-1 matched well with the experimental curve of 1 (ESI, Fig. S59†). Therefore, the absolute configuration of C-10 and C-11 in 1 could be assigned to be 10R,11S.| No. | 1 | 2 | 3 | 4 | ||||
|---|---|---|---|---|---|---|---|---|
| δC, type | δH (J in Hz) | δC, type | δH (J in Hz) | δC, type | δH (J in Hz) | δC, type | δH (J in Hz) | |
| 1 | 197.3, CH | 10.43, s | 197.7, CH | 10.23, s | 99.3, CH | 6.80, s | 70.0, CH2 | 4.98, dd (12.3, 2.7), 4.89, d (12.3) |
| 2 | 119.4, C | 118.4, C | 126.8, C | |||||
| 3 | 164.4, C | 161.4, C | 154.7, C | 80.0, CH | 5.91, m | |||
| 4 | 116.6, CH | 6.79, d (8.0) | 115.5, CH | 6.79, d (8.6) | 113.2, CH | 6.62, d (7.2) | 143.8, C | |
| 5 | 138.3, CH | 7.45, t (8.0) | 137.3, CH | 7.35, d (8.6) | 128.4, CH | 6.96, t (7.2) | 119.4, C | |
| 6 | 122.5, CH | 6.85, d (8.0) | 131.0, C | 121.1, CH | 6.60, d (7.2) | 128.8, CH | 7.44, d (8.4) | |
| 7 | 148.8, C | 141.9, C | 142.2, C | 115.1, CH | 6.67, d (8.4) | |||
| 8 | 28.9, CH2 | 3.25, ddd (14.5, 10.4, 4.6), 3.00, ddd (14.5, 10.1, 6.7) | 125.3, CH | 6.85, dd (16.1, 1.3) | 31.7, CH2 | 3.41, td (15.3, 4.2), 1.92, td (15.3, 4.5) | 154.5, C | |
| 9 | 37.2, CH2 | 1.94, ddd (13.4, 10.1, 6.6), 1.69, ddd (13.4, 9.8, 4.6) | 140.1, CH | 5.81, dd (16.1, 6.1) | 30.6, CH2 | 3.22, ddd (15.9, 12.0, 4.5), 2.64, m | 125.6, C | |
| 10 | 75.9, CH | 3.39, ddd (9.0, 5.8, 2.4) | 76.2, CH | 4.13, ddd (6.4, 5.2, 1.4) | 80.8, CH | 4.25, dq (6.5, 1.5) | 43.8, CH2 | 2.87, dd (14.5, 2.9), 2.82, dd (14.5, 3.1) |
| 11 | 71.7, CH | 3.59, dd (6.2, 5.8) | 70.2, CH | 3.77, qd (6.2, 5.2) | 75.9, CH | 4.42, qd (6.2, 1.5) | 211.2, C | |
| 12 | 19.1, CH3 | 1.19, d (6.2) | 17.8, CH3 | 1.23, d (6.2) | 19.2, CH3 | 1.28, d (6.2) | 73.1, CH | 4.14, m |
| 13 | 18.2, CH3 | 1.24, d (7.0) | ||||||
| 1′ | 30.6, CH2 | 3.31, d (7.1) | 140.4, CH | 7.47, d (6.2) | ||||
| 2′ | 122.4, CH | 5.20, t (7.1) | 125.0, CH | 6.52, d (6.2) | ||||
| 3′ | 132.3, C | 199.7, C | ||||||
| 4′ | 16.6, CH3 | 1.72, s | 26.2, CH3 | 2.24, s | ||||
| 5′ | 24.5, CH3 | 1.72, s | ||||||
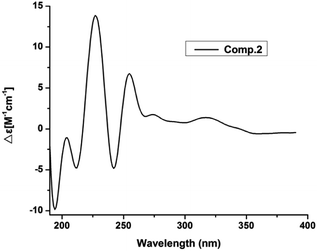
Compound 2 had the molecular formula of C17H22O4, as established by HRESIMS at m/z 289.1493 [M − H]− (calcd for C17H21O4, 289.1440). Analysis of the NMR data (Table 1) of 2 revealed that it was very similar to those of vaccinol G (7),21 except some of the chemical shifts changed, C-9 (δC 140.1), C-10 (δC 76.2), C-11 (δC 70.2), and C-12 (δC 17.8) in 2, which was confirmed by the HMBC correlations from H-1′ (δH 3.31) to C-5 (δC 137.3), C-6 (δC 131.0), C-7 (δC 141.9), C-2′ (δC 122.4) and from H-8 (δH 6.85) to C-6 (δC 131.0), C-2 (δC 118.4), C-7 (δC 141.9), and C-10 (δC 76.2), together with the COSY correlations H-8/H-9/H-10/H-11/H-12 and H-4/H-5 (Fig. 6). While determining the configurations of C-10 and C-11 during storage for one week. Interestingly, compound 2 could convert to two compounds (2 and 7) when kept at room temperature in CD3OD, while the separation of 2 and 7 by HPLC chromatographic methods was successful (ESI†). This results suggested 2 and 7 differed in the configuration at the vicinal diol side strain, which closely resembled those of 1 and 6. The analogous chemical shifts and coupling constants of 2 (J = 5.2 Hz) and 1 (J = 5.8 Hz) and indicated that 2 possessed the same relative configuration as 1. Considering the probable biosynthetic pathway, the absolute configurations of compound 2 was assigned as shown in Fig. 1. The Mo2(AcO)4-induced circular dichroism spectrum helped reconfirm the absolute configurations of compound 2 (Fig. 4). This assignment was further confirmed by ECD calculations, and the absolute configurations of 2 were determined as 10R,11S (ESI, Fig. S60†).
Compound 3 was isolated as a white amorphous solid. The molecular formula was established to be C12H14O3 by HRESIMS. Analysis of the NMR data of 3 revealed that it possessed the similar structural characteristics with 11. The main difference occurred at the configuration of C-1, C-10, and C-11, which were proved by the carbon chemical shifts of C-1 (ΔδC 0.5 ppm), C-10 (ΔδC 3.7 ppm), C-11 (ΔδC 0 ppm), C-12 (ΔδC 8.1 ppm), and C-9 (ΔδC 3.2 ppm) in 3 (ESI†). The planar structure of 3 was confirmed by HSQC, COSY, and HMBC experiments (Fig. 6). The relative configuration of 3 was determined by comparing the NMR data and the coupling constant with those of cladoacetals A and B.22 In addition, considering the possible biosynthesis of compounds 3, 11 and cladoacetals A and B, it was suggested that 3 had the same configuration as cladoacetal A. Moreover, the absolute configuration of cladoacetal A was determined using X-ray and total syntheses.23 The absolute configurations of 3 were determined as 1R,10S,11S, by comparing the calculated ECD spectrum with its experimental values. Thus, the structure of 3 was assigned, and named pestalotiopol C.
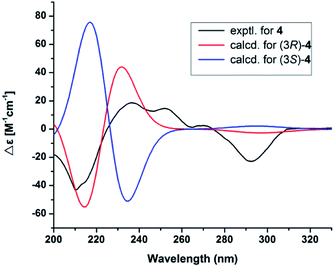
Compound 4 had the molecular formula C16H18O5 as indicated by the HRESIMS signal at m/z 313.1061 [M + Na]+ (calcd for C16H18NaO5, 313.1052). The 1H and 13C NMR data of 4 were very similar to those of (R)-3-hydroxy-1-[(R)-4-hydroxy-1,3-dihydroisobenzofuran-1-yl]butan-2-one,24 except for the presence of the double bond and carbonyl group of the side chain at C-5, which was confirmed by the HMBC correlations (Fig. 5) of H-1′ (δH 7.47) with C-6 (δC 128.8), C-4 (δC 143.8), C-5 (δC 119.4), C-2′ (δC 125.0), and C-3′ (δC 199.7), together with the 1H–1H COSY correlations of H-1′ (δH 7.47)/H-2′ (δH 6.52). The 1H–1H COSY correlations of H-12 (δH 4.14) with H-13 (δH 1.24) revealed that the hydroxy group was located on C-12 in 4. In addition, the configuration of the double bond of 4 was confirmed as Z geometry based on the coupling constant values between H-1′ and H-2′ (JH1′/2′ = 6.2 Hz). The shared biogenesis and similar NMR data (Table 1) suggested that 4 had the same configurations for C-3 as those of (R)-3-hydroxy-1-[(R)-4-hydroxy-1,3-dihydroisobenzofuran-1-yl]butan-2-one.24 CD spectra showed a negative Cotton effect at 210 nm of 4 (Fig. 5) suggesting a 3R configuration of 4.25 Additionally, the absolute configurations of 4 were further determined as 3R, by comparing the calculated electronic circular dichroism (ECD) spectrum (Fig. 5). Due to the chiral center C-12 in 4 was far from the chromophore, and only few derivatives were reported.24 It was difficult to clarify the absolute configurations. We tried to use the modified Mosher's method. Unfortunately, it was unsuccessful because of limited amount available of the compound 4. Thus, the structure of compound 4 was assigned as shown and named pestalotiopol D.
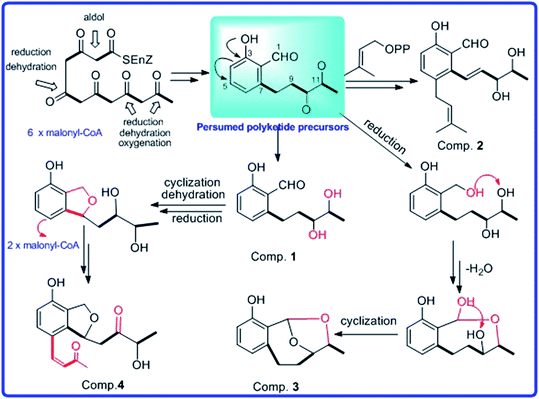
By comparing their NMR data and physicochemical properties with reported ones, the structures of known compounds 5–11 were identified. In addition, the possible biosynthetic pathway for compounds (1–4) were also postulated (Scheme 1). Compounds 1–4 were assumed to be biogenetically derived from presumed polyketide precursors through successive reactions such as cyclization, reduction, oxidation, and dehydration. Presumed polyketide precursors was considered to be derived from the malonyl-CoA by cyclization, reduction, oxidation, and dehydration to form an intermediate.
Biological activities
All of the compounds (1–11) were evaluated for their cytotoxic activities against four human cancer cell lines (Table 2). Compounds 1, 2, 6, and 7 exhibited cytotoxicity against four human cancer cell lines with IC50 values of 16.5–56.5 μM. Unfortunately, the others didn't display cytotoxicities against four human cancer cell lines at 100 μM.| Comp. | BGC-823 | SMMC-7721 | Ichikawa | 7860 |
|---|---|---|---|---|
| 1 | 33.1 | 25.7 | 24.8 | 28.3 |
| 2 | 42.6 | 52.1 | 16.5 | 24.7 |
| 3 | >100 | >100 | >100 | >100 |
| 4 | >100 | >100 | >100 | >100 |
| 5 | >100 | >100 | >100 | >100 |
| 6 | 34.6 | 26.5 | 23.6 | 26.1 |
| 7 | 46.2 | 56.5 | 17.8 | 23.5 |
| 8 | >100 | >100 | >100 | >100 |
| 9 | >100 | >100 | >100 | >100 |
| 10 | >100 | >100 | >100 | >100 |
| 11 | >100 | >100 | >100 | >100 |
| Adriamycin | 1.48 | 2.24 | 1.2 | 2.0 |
Experimental section
General experimental procedures
Optical rotations were determined using a PerkinElmer 341 automatic polarimeter. Ultraviolet (UV) spectra were measured with a UV-2550 spectrophotometer (Shimadzu Corporation, Tokyo, Japan). IR spectra were measured on a Bruker Tensor 27 FT-IR spectrometer (film). 1H and 13C NMR, DEPT, and 2D NMR spectra were carried out on a Bruker AV-600 spectrometer using TMS as internal standard, δ in ppm rel. HRESIMS (including ESIMS) were recorded on a Bruker maXis TOF-QII mass spectrometer (Bruker Fällanden, Switzerland). Column chromatography (CC) were performed on silica gel (100–200 mesh, 300–400 mesh, Qingdao Marine Chemical Ltd., Qingdao, China), Sephadex LH-20 (GE Healthcare Bio-sciences AB, Sweden), YMC GEL ODS-A (S-50 μm, 12 nm) (YMC Co., Ltd, Kyoto, Japan). Semi-preparative HPLC separations were performed using an ODS column (YMC-ODS-A, 250 × 20 mm, 5 μm). Circular dichroism (CD) spectra were recorded on a Chirascan circular dichroism spectrometer (Applied Photophysics).Fungal material
The fungal strain Pestalotiopsis sp. was isolated from the sponge Phakellia fusca that was collected from Xisha Islands of China. The strain was identified according to its DNA amplification and an ITS region sequence analysis (GenBank database). A voucher specimen (no. XWS03F09) was deposited in the School of Pharmacy, Southwest Medical University, Luzhou, Sichuan, China.Fermentation, extraction, and isolation
The fungal strain Pestalotiopsis sp. was grown at 28 °C without shaking for 60 days in one hundred 1000 mL conical flasks containing solid rice medium (each flask contained 200 g of rice, 3 g of artificial sea salt, 10 μM of 5-aza-2-deoxycytidine, 10 μM of RG 108, and 200 mL of distilled water). The whole solid cultures were extracted with EtOAc four times at room temperature. The EtOAc solutions were concentrated under reduced pressure to afford 175 g of crude extract.The crude extract was subjected to silica gel column chromatography (CC) eluting with a PE and EtOAc mixed solvent system in a step gradient (50![[thin space (1/6-em)]](https://www.rsc.org/images/entities/char_2009.gif) :
:![[thin space (1/6-em)]](https://www.rsc.org/images/entities/char_2009.gif) 1 to 0
1 to 0![[thin space (1/6-em)]](https://www.rsc.org/images/entities/char_2009.gif) :
:![[thin space (1/6-em)]](https://www.rsc.org/images/entities/char_2009.gif) 1, v/v) to yield 9 fractions (Frs 1–9). Fraction 3 was isolated by CC on silica gel eluted with PE-EtOAc (10
1, v/v) to yield 9 fractions (Frs 1–9). Fraction 3 was isolated by CC on silica gel eluted with PE-EtOAc (10![[thin space (1/6-em)]](https://www.rsc.org/images/entities/char_2009.gif) :
:![[thin space (1/6-em)]](https://www.rsc.org/images/entities/char_2009.gif) 1 to 0
1 to 0![[thin space (1/6-em)]](https://www.rsc.org/images/entities/char_2009.gif) :
:![[thin space (1/6-em)]](https://www.rsc.org/images/entities/char_2009.gif) 1, v/v) to afford five subfractions (Frs 3.1–3.5). Fr. 3.2 was divided into three subfractions (Frs 3.2.1–3.2.3) by Sephadex LH-20 chromatography (MeOH). Fr. 3.2.3 was further separated by HPLC (75%, MeOH–H2O) to give 2 (5.0 mg) and 7 (3.0 mg). Fr. 3.3 was subjected to a Sephadex LH-20 column eluting with MeOH, followed by semi-preparative HPLC (75%, MeOH–H2O) to yield 1 (5.0 mg) and 6 (4.0 mg). Fr. 3.4 was further separated by ODS CC, eluting with MeOH–H2O (60%) to yield 5 (10.0 mg). Fraction 4 was separated using silica gel column chromatography eluting with PE-acetone (10
1, v/v) to afford five subfractions (Frs 3.1–3.5). Fr. 3.2 was divided into three subfractions (Frs 3.2.1–3.2.3) by Sephadex LH-20 chromatography (MeOH). Fr. 3.2.3 was further separated by HPLC (75%, MeOH–H2O) to give 2 (5.0 mg) and 7 (3.0 mg). Fr. 3.3 was subjected to a Sephadex LH-20 column eluting with MeOH, followed by semi-preparative HPLC (75%, MeOH–H2O) to yield 1 (5.0 mg) and 6 (4.0 mg). Fr. 3.4 was further separated by ODS CC, eluting with MeOH–H2O (60%) to yield 5 (10.0 mg). Fraction 4 was separated using silica gel column chromatography eluting with PE-acetone (10![[thin space (1/6-em)]](https://www.rsc.org/images/entities/char_2009.gif) :
:![[thin space (1/6-em)]](https://www.rsc.org/images/entities/char_2009.gif) 1) to yield four subfractions (Frs 4.1–4.4). Fr. 4.2 was further purified by HPLC (60%, MeOH–H2O) to afford 3 and 11 (8.0 mg). Fraction 5 was subjected to Sephadex LH-20 chromatography (MeOH) and further purified by semi-preparative HPLC (60%, MeOH–H2O) to give 4 (3.0 mg). Fraction 6 was isolated by CC on silica gel eluted with CH2Cl2–acetone (15
1) to yield four subfractions (Frs 4.1–4.4). Fr. 4.2 was further purified by HPLC (60%, MeOH–H2O) to afford 3 and 11 (8.0 mg). Fraction 5 was subjected to Sephadex LH-20 chromatography (MeOH) and further purified by semi-preparative HPLC (60%, MeOH–H2O) to give 4 (3.0 mg). Fraction 6 was isolated by CC on silica gel eluted with CH2Cl2–acetone (15![[thin space (1/6-em)]](https://www.rsc.org/images/entities/char_2009.gif) :
:![[thin space (1/6-em)]](https://www.rsc.org/images/entities/char_2009.gif) 1 to 0
1 to 0![[thin space (1/6-em)]](https://www.rsc.org/images/entities/char_2009.gif) :
:![[thin space (1/6-em)]](https://www.rsc.org/images/entities/char_2009.gif) 1, v/v) to yield six subfractions (Frs 6.1–6.6). Fr. 6.2 was further divided into three subfractions (Frs 6.2.1–6.2.3) by ODS column chromatography eluting with MeOH–H2O (70
1, v/v) to yield six subfractions (Frs 6.1–6.6). Fr. 6.2 was further divided into three subfractions (Frs 6.2.1–6.2.3) by ODS column chromatography eluting with MeOH–H2O (70![[thin space (1/6-em)]](https://www.rsc.org/images/entities/char_2009.gif) :
:![[thin space (1/6-em)]](https://www.rsc.org/images/entities/char_2009.gif) 30). Fr. 6.2.2 was directly separated by semi-preparative HPLC (60%, MeOH–H2O) to afford 8 (5.0 mg), 9 (2.0 mg) and 10 (2.0 mg).
30). Fr. 6.2.2 was directly separated by semi-preparative HPLC (60%, MeOH–H2O) to afford 8 (5.0 mg), 9 (2.0 mg) and 10 (2.0 mg).
![[thin space (1/6-em)]](https://www.rsc.org/images/entities/char_2009.gif) ε) 258 (3.45), 322 (3.20) nm; IR (film) νmax 3329, 2952, 2926, 1680, 1589, 1439, 1348, 1103, 1024, 943, 849 cm−1; 1H NMR and 13CNMR data, see Table 1; HRESIMS m/z 223.1018 [M − H]− (calcd for C12H15O4, 223.0970).
ε) 258 (3.45), 322 (3.20) nm; IR (film) νmax 3329, 2952, 2926, 1680, 1589, 1439, 1348, 1103, 1024, 943, 849 cm−1; 1H NMR and 13CNMR data, see Table 1; HRESIMS m/z 223.1018 [M − H]− (calcd for C12H15O4, 223.0970).![[thin space (1/6-em)]](https://www.rsc.org/images/entities/char_2009.gif) ε) 230 (3.61), 345 (3.28) nm; IR (film) νmax 3334, 2948, 2837, 1661, 1539, 1452, 1409, 1350, 1268, 1225, 1110, 1015, 943 cm−1; 1H NMR and 13C NMR data, see Table 1; HRESIMS m/z 289.1493 [M − H]− (calcd for C17H21O4, 289.1440).
ε) 230 (3.61), 345 (3.28) nm; IR (film) νmax 3334, 2948, 2837, 1661, 1539, 1452, 1409, 1350, 1268, 1225, 1110, 1015, 943 cm−1; 1H NMR and 13C NMR data, see Table 1; HRESIMS m/z 289.1493 [M − H]− (calcd for C17H21O4, 289.1440).![[thin space (1/6-em)]](https://www.rsc.org/images/entities/char_2009.gif) ε) 233 (3.60), 350 (3.58) nm; IR (film) νmax 3381, 2920, 1628, 1603, 1454, 1251, 1128, 1057, 1013, 987 cm−1; 1H and 13C NMR data, see Table 1; HRESIMS m/z 229.0937 [M + Na]+ (calcd for C12H14NaO3, 229.0841).
ε) 233 (3.60), 350 (3.58) nm; IR (film) νmax 3381, 2920, 1628, 1603, 1454, 1251, 1128, 1057, 1013, 987 cm−1; 1H and 13C NMR data, see Table 1; HRESIMS m/z 229.0937 [M + Na]+ (calcd for C12H14NaO3, 229.0841).![[thin space (1/6-em)]](https://www.rsc.org/images/entities/char_2009.gif) ε) 225 (3.65), 284 (3.96) nm; IR (film) νmax 3240, 2922, 2853, 1705, 1606, 1581, 1381, 1349, 1266, 1162, 1053, 1007, 949, 835 cm−1; 1H NMR and 13C NMR data, see Table 1; HRESIMS m/z 313.1061 [M + Na]+ (calcd for C16H18NaO5, 313.1052).
ε) 225 (3.65), 284 (3.96) nm; IR (film) νmax 3240, 2922, 2853, 1705, 1606, 1581, 1381, 1349, 1266, 1162, 1053, 1007, 949, 835 cm−1; 1H NMR and 13C NMR data, see Table 1; HRESIMS m/z 313.1061 [M + Na]+ (calcd for C16H18NaO5, 313.1052).Cytotoxicity assay
The isolated compounds 1–11 were evaluated for their cytotoxic activities against four human carcinoma cell lines, a human gastric carcinoma cell line (BGC-823), a human hepatocellular carcinoma cell line (SMMC-7721), a human carcinoma cell line (Ichikawa), and a human kidney cancer cell line (7860) in an MTT assay as previously reported.26 IC50 value was defined as a 50% reduction of absorbance from the control assay. Adriamycin was assayed as a positive control.Conclusions
In summary, four new polyketide derivatives, pestalotiopols A–D (1–4), together with seven known compounds (5–11), were isolated from a chemical-epigenetic culture of Pestalotiopsis sp. Structures of the compounds (1–4), including their absolute configurations, were determined by spectroscopic analyses, especially the 2D NMR, Mo2-induced CD analyses. All the isolated compounds (1–11) were evaluated for their cytotoxic activities. Compounds 1, 2, 6, and 7 exhibited cytotoxicity against four human cancer cell lines with IC50 values of 16.5–56.5 μM. However, the others were inactive in the cytotoxic activities test at 100 μM. These results suggested that both the diol system of the side chain and the aldehyde group might promoted the cytotoxic activity. Compared to cultures in the same medium without 5-aza-2-deoxycytidine and RG 108, four new compounds 1–4 were obtained by chemical-epigenetic method. These results suggest that the chemical-epigenetic modification enriched the chemodiversity of the marine fungus.Calculation details of ECD spectra
The calculations of new compounds 1–3 were performed by using the density functional theory (DFT) as carried out in the Gaussian 09. Conformation search were performed with MMFF94S force fields using Maestro 10.2 software. All these conformers were further optimized by the density functional theory method at the B3LYP/6-31G(d) level. The ECD were calculated using density functional theory (TDDFT) at B3LYP/6-31+G(d) level with IEFPCM model. The calculated ECD curves were all generated using SpecDis v 1.53 software.Mo2(AcO)4-induced circular dichroism
The experimental methods were the same as described in previous papers.15Conflicts of interest
The authors declare no conflicts of interest.Acknowledgements
This work was funded by the Open Project of Guangdong Key Laboratory of Marine Materia Medica (LMM2019-2), Applied Basic Research Fund of Luzhou Municipal Government-Southwest Medical University (2018LZXNYD-ZK13), and Joint Special Fund Project for Basic Research of Local Universities in Yunnan Province (2019FH001(044)), Scientific Research Fund of Yunnan Education Department (2019J0570).References
- X. Y. Yang, J. Z. Zhang and D. Q. Luo, Nat. Prod. Rep., 2012, 29, 622–641 RSC.
- Y. X. Li, F. L. Zhang, S. Banakar and Z. Y. Li, RSC Adv., 2019, 9, 599–608 RSC.
- H. Lei, H. Niu, C. Song, X. J. Fu, Y. Luo, S. W. Chen and D. Zhang, Biochem. Syst. Ecol., 2020, 91, 104072 CrossRef CAS.
- X. Q. Yu, W. E. G. Müller, D. Meier, R. Kalscheuer, Z. Y. Guo, K. Zou, B. O. Umeokoli, Z. Liu and P. Proksch, Mar. Drugs, 2020, 18, 129 CrossRef CAS.
- G. R. N. Rathnayake, N. S. Kumar, L. Jayasinghe, H. S. Araya and Y. Fujimoto, Nat. Prod. Bioprospect., 2019, 9, 411–417 CrossRef.
- R. C. José, Z. A. Jade, M. J. Jesús, M. A. Blanca, H. O. Simón and A. R. Enrique, Org. Lett., 2019, 11, 3558–3562 Search PubMed.
- G. A. Strobel, W. M. Hess, E. Ford, R. S. Sidhu and X. Yang, J. Ind. Microbiol. Biotechnol., 1996, 17, 417–423 CrossRef CAS.
- J. Xu, X. B. Yang and Q. Lin, Fungal Divers., 2014, 66, 37–68 CrossRef.
- L. Rao, Y. X. You, Y. Su, Y. Liu, Q. He, Y. Fan, F. Hu, Y. K. Xu and C. R. Zhang, Fitoterapia, 2019, 135, 1–8 CrossRef.
- W. H. Wang, C. Park, E. Oh, Y. J. Sung, J. Lee, K. H. Park and H. Kang, J. Nat. Prod., 2019, 82, 3357–3365 CrossRef CAS.
- B. Y. Yang, Q. Y. Tong, S. Lin, J. R. Guo, J. W. Zhang, J. J. Liu, J. P. Wang, H. C. Zhua, Z. X. Hua and Y. H. Zhang, Phytochem. Lett., 2019, 29, 186–189 CrossRef CAS.
- C. S. Li, B. J. Yang, J. Turkson and S. G. Cao, Phytochemistry, 2017, 140, 77–82 CrossRef CAS.
- R. Y. Song, X. B. Wang, G. P. Yin, R. H. Liu, L. Y. Kong and M. H. Yang, Fitoterapia, 2017, 122, 115–118 CrossRef CAS.
- Z. H. Gao, R. R. Gao, X. R. Dong, Z. M. Zou, Q. Wang, D. M. Zhou and D. A. Sun, Phytochem. Lett., 2017, 19, 108–113 CrossRef CAS.
- H. Lei, X. P. Lin, L. Han, J. Ma, K. L. Dong, X. B. Wang, Y. Mu, Y. H. Liu and X. S. Huang, Phytochemistry, 2017, 142, 51–59 CrossRef CAS.
- H. Lei, X. P. Lin, L. Han, J. Ma, Q. J. Ma, J. L. Zhong, Y. H. Liu, T. M. Sun, J. H. Wang and X. S. Huang, Mar. Drugs, 2017, 15, 69 CrossRef.
- J. Liu, X. F. He, G. H. Wang, E. F. Merino, S. P. Yang, R. X. Zhu, L. S. Gan, H. Zhang, M. B. Cassera, H. Y. Wang, D. G. I. Kingston and J. M. Yue, J. Org. Chem., 2014, 79, 599–607 CrossRef CAS.
- J. Xiao, L. B. Lin, J. Y. Hu, F. R. Jiao, D. Z. Duan, Q. Zhang, H. Y. Tang, J. M. Gao, L. Wang and X. L. Wang, RSC Adv., 2017, 7, 29071 RSC.
- Y. Sakio, Y. J. Hirano, M. Hayashi, K. Komiyama and M. Ishibashi, J. Nat. Prod., 2001, 64, 726–773 CrossRef CAS.
- X. W. Chen, C. W. Li, C. B. Cui, W. Hua, T. J. Zhu and Q. Q. Gu, Mar. Drugs, 2014, 12, 3116–3137 CrossRef.
- J. F. Wang, X. Y. Wei, X. Lu, F. Q. Xu, J. T. Wan, X. P. Lin, X. F. Zhou, S. R. Liao, B. Yang, Z. C. Tu and Y. H. Liu, Tetrahedron, 2014, 70, 9695–9701 CrossRef CAS.
- U. Holler, J. B. Gloer and D. T. Wicklow, J. Nat. Prod., 2002, 65, 876–882 CrossRef.
- D. S. Hsu and S. C. Lin, J. Org. Chem., 2012, 77, 6139–6146 CrossRef CAS.
- J. R. Kesting, L. Olsen, D. Staerk, M. V. Tejesvi, K. R. Kini, H. S. Prakash and J. W. Jaroszewski, J. Nat. Prod., 2011, 74, 2206–2215 CrossRef CAS.
- J. F. Wang, X. Y. Wei, X. C. Qin, H. Chen, X. P. Lin, T. Y. Zhang, X. W. Yang, S. R. Liao, B. Yang, J. Liu, X. F. Zhou, Z. C. Tu and Y. H. Liu, Phytochem. Lett., 2015, 12, 59–62 CrossRef CAS.
- D. Zheng, L. Han, Y. Q. Li, J. Li, H. Rong, Q. Leng, Y. Jiang, L. X. Zhao and X. S. Huang, Molecules, 2012, 17, 836–842 CrossRef CAS.
Footnote |
| † Electronic supplementary information (ESI) available: 1D and 2D NMR, and HRMS spectra for 1–4. See DOI: 10.1039/d0ra06983c |
| This journal is © The Royal Society of Chemistry 2020 |

