
 Open Access Article
 This Open Access Article is licensed under a Creative Commons Attribution-Non Commercial 3.0 Unported Licence
The migration of acetochlor from feed to milk
Xue Qin†
a,
Yujun Jiang† a,
Zhenghui Wanga,
Chaoxin Mana,
Shiqian Fua,
Sihan Chena,
Xinyan Yanga,
Tao Yanga,
Dongyan Zhanga,
Linyao Lia,
Edward M. Foxb and
Wei Zhang*a
a,
Zhenghui Wanga,
Chaoxin Mana,
Shiqian Fua,
Sihan Chena,
Xinyan Yanga,
Tao Yanga,
Dongyan Zhanga,
Linyao Lia,
Edward M. Foxb and
Wei Zhang*a
aKey Laboratory of Dairy Science, Ministry of Education, College of Food Science, Northeast Agricultural University, Harbin, 150030, China. E-mail: zhangwei9791@163.com
bDepartment of Applied Science, Northumbria University, Newcastle upon Tyne, NE1 8ST UK
First published on 15th December 2020
Abstract
Acetochlor has been widely used globally for its effective weed control, but the dietary intake of associated residues by people has become a major concern nowadays. Milk is regarded as the best solvent to dissolve pesticides due to its fat-rich characteristic. In this study, we aimed to evaluate the transfer of acetochlor from feed to raw milk. Twenty lactating Australian Holstein cows were randomly chosen and divided into 1 control group and 3 treatment groups, feeding acetochlor at the dosages of 0, 0.45, 1.35 and 4.05 g per day during the treatment period. The concentration of acetochlor residues in raw milk was detected by QuEChERS together with a gas chromatography-mass spectrometry (GC-MS) method. The results showed that the highest concentrations of acetochlor residues in raw milk for the three treatment groups had a positive correlation with the dosage levels and the transfer efficiency of the low dose group was only 0.080%, higher than those of the other two groups. Besides, the national estimated daily intake (NEDI) of acetochlor from milk is 1.67 × 10⁻⁵ mg kg−1, which is 0.08% of the ADI. Overall, we concluded that the risk of acetochlor residues in milk was low, but high-dose acetochlor had a larger impact on milk quality and low-dose acetochlor had potential risks.
Introduction
Pesticides are used to protect crops and increase the yield of agricultural products through reducing the hazard of diseases and killing pests and weeds. Associated pesticide residues can contaminate the environment through water, air and food. Pesticides remaining in crops and water enter organisms through food chains, which can be detected in various foods such as vegetables (organophosphates, organochlorines, acaricides, fungicides, and insecticides of biological origin, Nepal),1 fruits (dimethoate, fenvalerate and chlorpyrifos, Argentina),2 honey (aldrin, phosalone, permethin and dimethylbenzamide, Iran),3 milk (melamine, China)4 and so on. Studies have shown that pesticide residues can affect human health for a prolonged time, especially in the case of infants5 and young teenagers.6 A large number of toxicology tests have shown that long-time even low-dose exposure to pesticides has higher risks.7,8Acetochlor (C14H2OClNO2), a chloroacetamide herbicide with high activity and broad-spectrum pre-sprout amide, has been widely used to control annual grasses and certain broad-leaved weeds.9 In China, the usage amount of acetochlor has been over 10![[thin space (1/6-em)]](https://www.rsc.org/images/entities/char_2009.gif) 000 tons every year10 and it is among the commonly used pesticides in the U.S. since 1994.11 According to the report estimated by Agricultural Market Sector, acetochlor was ranked the 5th among those pesticides.12 Due to its great characteristic of migration and long degradation time, acetochlor can be subsequently detected in soil and water following usage. Later it can be found in various foods such as vegetables, fruits and milk by bioaccumulation action. Acetochlor ingested by people may induce diseases like cancers, heart diseases and Parkinsonism.8 Thus, it has been prescribed as group B-2 carcinogen by the Environmental Protection Agency.13
000 tons every year10 and it is among the commonly used pesticides in the U.S. since 1994.11 According to the report estimated by Agricultural Market Sector, acetochlor was ranked the 5th among those pesticides.12 Due to its great characteristic of migration and long degradation time, acetochlor can be subsequently detected in soil and water following usage. Later it can be found in various foods such as vegetables, fruits and milk by bioaccumulation action. Acetochlor ingested by people may induce diseases like cancers, heart diseases and Parkinsonism.8 Thus, it has been prescribed as group B-2 carcinogen by the Environmental Protection Agency.13
Milk, evaluated as a highly nutritious food for its rich nutritive value and easy digestibility, attracts more and more consumers' attention.14 Milk is rich in proteins and lipids, which also makes it an effective solvent for acetochlor. When lactating cows were fed contaminated feedstuff or contaminated water, pesticides can be detected from milk and adipose tissue.15 Food safety has always been an important concerned problem for consumers all over the world. Generally, the hazard of pesticide residues comes from the consumption of contaminated food. As a result, detections of pesticide residues in raw milk,14,16 fruits and vegetables,17 ground water,18 as well as environmental sources19 has frequently been recorded. The safety of dairy products remains a key consideration for public health, with the Food and Drug Administration (FDA) and similar national committees enacting a series of standards on the maximum residue limit (MRL) of a number of pesticides. The MRL for acetochlor in raw milk is 0.01 mg kg−1 under EU regulations.20
Numerous studies have examined residues of chlorinated pesticides, organophosphates, sulfonamides and antibiotic around the word.4,21,22 Such studies on the sources of acetochlor residues have focused on soil, water, and agriculture products. But raw milk as an important source has received little attention in recent work. Therefore, the main objective of this research was to establish a method to detect acetochlor in raw milk and predict the migration of acetochlor from feed to milk considering the relationship between concentration and time. The information obtained from such research is essential for better understanding of the correlation between acetochlor concentration in feed and raw milk and risk assessment, providing scientific guidance for acetochlor control.
Materials and methods
Experiment animals and treatments
This trial was approved by the Northeast Agricultural University Animal Ethics Committee and cows were treated according to the guidelines of Regulations for the Administration of Affairs Concerning Experimental Animals. Twenty healthy lactating Australian Holstein cows, with a mean daily milk production of 26.69 ± 2.33 kg per day, were reared at farm (located in the north of Songhua river, Harbin, Heilongjiang) under the same standards from September to November. The average age of the cows were around 5 years and the weights were 612 ± 15.4 kg. The cows were housed individually in well-ventilated barns (length × width = 4 m × 3 m). Each had access to fodder and fresh water via a feeding trough and a ball valve-controlled water bowl. Experimental cows in this research fed with acetochlor at different doses were randomly divided into 3 groups, with 5 cows in each group, and were designed as low-dose (LD), middle-dose (MD) and high-dose (HD) groups respectively. In addition, an additional 5 cows were fed mixed rations with no drug administration and designed as the blank control group. The dosages of acetochlor were set as 0.45, 1.35 and 4.05 g per day for the three treatment groups, in which we have made some modifications on the basis of others' researches.23,24 Acetochlor (purity 90%) (Lebont Chemicals Co., LTD Shandong, China) was placed in the water bowl, and drunk by cows through plastic jugs connected to normal drinking water nipples.The experimental trial period was run for 60 days for the LD treatment group. The first 40 days comprised the feeding period (acetochlor was dissolved by drinking water), with the following 20 days constituting the withdrawal period (cows were treated with no acetochlor). For MD and HD treatment groups, the experimental period was set at 50 days, including a feeding period of 30 days followed by 20 days of the withdrawal period. The variation in experimental trial periods across the three treatment groups is further elaborated in the discussion section. During the experimental trial, basal diets at 15 kg per day were provided to all cows twice a day in the morning (at 9:30 am) and afternoon (at 16:30 pm). Before trial commencement, acetochlor in water, diets and raw milk were measured to confirm no acetochlor was present in any sample. The basal diets were formulated to meet or exceed the Feeding Standard of Dairy Cattle nutrition required (NY/T 34-2004), and the ingredients and chemical compositions of the basal diets are summarized in Table 1. Acetochlor can induce some digestive manifestation such as the symptoms of diarrhea and emesis, and potentially lead to liver and kidney damaged. If symptoms characteristic of acetochlor poisoning were noted in experimental animals at any point during the feeding time, acetochlor dosing must be terminated immediately and the unhealthy cows taken to a veterinarian for treatment.
| Item | Content (% of dry matter) |
|---|---|
| a The compositions of the concentrate diet were barley (14.70%), wheat (4.90%), corn (15.00%), extruded corn (4.10%), corn germ meal (15.60%), corn fibers (16.60%), pomace (4.00%), soybean meal (9.60%), rapeseed meal (3.00%), beet molasses (2.40%), rumen protected fat (5.40%), salt (0.90%), mountain flour (1.40%), soda (0.90%), magnesium oxide (0.50%) and gunk for lactation cow (1.00%).b Calculated by dietary constitutes.c Calculated by the cow feeding standard NY/T 34-2004. | |
| Ingredient | |
| Alfalfa | 5.20 |
| Grass hay | 3.90 |
| Corn silage | 42.10 |
| Corn organic | 2.60 |
| Cottonseed | 6.50 |
| Carrot fresh | 2.60 |
| Brewers grains | 10.60 |
| Concentrate dieta | 26.50 |
|
|
| Chemical compositionb | |
| NELc (MJ kg−1 of DM) | 7.00 |
| Crude protein | 15.38 |
| Crude fat | 5.77 |
| Neutral detergent fiber | 36.54 |
| Calcium | 0.90 |
| Phosphorus | 0.45 |
| Non-structural carbohydrate | 34.62 |
| Rumen bypass protein, 4% BW | 5.77 |
| Ash | 5.77 |
Sample collection
Milk samples from each of the 3 groups of cows, collected twice daily at 9:30 am and 16:30 pm, were mixed homogeneously. Mixtures were subsequently divided into 50 mL glass containers and stored at −20 °C for later analysis. The cryopreserved samples were analyzed as soon as possible. To ensure the safety of milk produced by other cows which were fed a normal diet without acetochlor at the farm, contaminated milk was discarded immediately following some special treatments. All the vessels and instruments contacted with contaminated milk were cleaned thoroughly to ensure that they were suitable for subsequent analyses.Extraction of acetochlor from milk and diets
Prior to detecting by GC-MS, pretreatment of samples was performed by the QuEChERS method, including extraction and purification. QuEChERS (the abbreviation of quick, easy, cheap, effective, rugged, and safe) is an approach with wide detection scope, fast sample preparation, and high sensitivity to detect minimum samples or pesticides consumption coupled with GC-MS/LC-MS for detection.25 This original approach was applied to detect pesticide residues in plant samples, as reported by Anastassiades et al.26 However, QuEChERS can be modified appropriately according to the characteristics of different samples. For extracted acetochlor, an adapted method of Jawaid was used, which included some modifications.27In our research, 2.00 ± 0.01 g homogenized milk sample was added to a 20 mL centrifuge tube. Then 0.50 g NaCl (analytically pure, Kermel Chemicals Co., LTD. Tianjin, China) and 10 mL acetonitrile (chromatographically pure, Thermo Fisher Scientific Inc. Massachusetts, USA) were added into the tube for extraction. After 5 min of vortex oscillation to achieve complete homogeneity, the mixture was centrifuged at 4000×g for 5 min, and then 5 mL supernatant of the mixture was transferred into a glass tube and dried under a stream of nitrogen. The dried sample was solved by 1.0 mL acetone and then transferred to a 2.0 mL centrifuge tube. Later, an additional 0.15 g anhydrous MgSO4 (purity 99.5%, Kermel Chemicals J&K Scientific LTD. Beijing, China), 0.15 g PSA (Agela Technologies LTD. Tianjin, China) and 0.02 g Cleanert PestiCarb (Agela Technologies LTD. Tianjin, China) were added to remove any residual water, fatty acid, carbohydrate, pigment and other impurities to increase the accuracy of pesticide detection. The mixed sample was centrifuged at 15000×g for 10 min and the liquid supernatant was collected for analysis. At this moment, the sample was ready for GC-MS analysis. The pretreatment method of dietary biomass was similar to raw milk. Before the pretreatment method, material was ground carefully to pass through a 40-mesh sieve.
GC-MS analysis for acetochlor
The extracted acetochlor was analyzed on a 7890-5975 GC-MS system (Agilent Inc., USA), in which the MS used was equipped with a selective mass detector. Helium (purity 99.9999%) was employed as the carrier gas at a flow rate of 1.0 mL min−1 and a sample of 1.0 μL was injected into the GC-MS system. The capillary column was a HP-5 MS (30 m length × 0.25 mm internal diameter × 250 μm film thickness; Agilent Inc., USA). The effluent from the capillary column was operated in the splitless mode with an injection temperature of 250 °C. Oven temperature was programmed at 80 °C for 2 min, 40 to 100 °C at 5 °C min−1, further increased to 200 °C at 15 °C min−1 and then to 270 °C at 30 °C min−1 for 10 min. The MS was operated in electron impact (EI) mode with ionization energy of 70 eV, and the detector interface, ion source and quadrupole temperature were 280 °C, 230 °C and 150 °C, respectively.Confirmation and quantification of acetochlor
Confirmation of the acetochlor was established by the retention time and the presence of the target ions. MS analysis followed the core in full-scan conditions with the mass/charge scan ranging from 50 to 550 m/z for 0 to 20 min. Determinations were performed by using selected ion monitoring (SIM) mode and the mass to charge (m/z) scan were 146 m/z, 162 m/z, 223 m/z and 269 m/z. Three of them (146 m/z, 162 m/z, 269 m/z) were selected as qualitative standards, and the remaining one (223 m/z) was used for quantification.The minimum detected concentration of the method was 0.5 μg kg−1, which was less than the maximum residue limits in corn and bean established by China and in raw milk established by the EU. The average recovery of the method was 98.82%, which meant the methods of extraction and analysis could provide high efficiency. Contents of acetochlor residues were calculated using the calibration curves established by external standards (acetochlor standard, purity 99.5%, Dr Ehrenstorfer GmbH – Augsburg, Germany). Acetochlor standard samples were dissolved in acetone to provide different concentrations of 5, 10, 20, 50, 100, 200, or 300 μg L−1.
Transfer efficiency of acetochlor
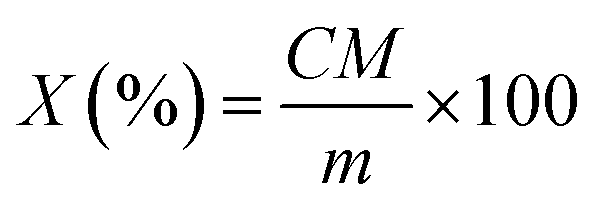
Transfer efficiency was calculated to measure the percentage of daily acetochlor transferred from diet to milk and it was calculated using the following equation:where X (%) was the transfer efficiency of acetochlor from diet to milk; C (mg kg−1) was the content of acetochlor residues in milk; M (kg) was the milk yielding; m (mg) was acetochlor dose added to drinking water of cattle.
Validation of the method
In general, standard curve, limit of quantification (LOQ), recovery, and precision were selected as indexes to analyze the feasibility of method adopted in the experiments. A standard curve of acetochlor was obtained by utilizing seven standard acetochlor samples with different concentrations (5, 10, 20, 50, 100, 200, 300 μg L−1). LOQ was defined by the analyzed sample concentration when the value of signal-to-noise ratio was 10. If the detected values of samples were greater than LOQ, they were identified and quantified. Recovery and precision were detected to demonstrate the accuracy of the experimental method. Recoveries were calculated by preparing three milk samples spiked with different acetochlor standard contents (20, 50, or 100 μg L−1). Each recovery assay was tested five times.Statistical analysis
The statistical analyses of data were calculated using SPSS 21.0 (Chicago, USA) and tested with analysis of variance (ANOVA). All results were expressed as mean value ± standard deviation (SD), and the values were calculated by three repetitions. Because no acetochlor was detected in the control group, so there was no statistical analysis for control group.Results and discussion
Validation results
The determination coefficient (R2) value of the standard curve was calculated to be 0.9991, which demonstrated the linearity of the method was robust. The LOQ was 0.5 μg kg−1 for acetochlor, which was below the concentration of acetochlor detected in milk. The recoveries of different spiked levels of acetochlor were between 90.92% and 102.25%, and relative standard deviations (RSD) ranged from 2.00% to 2.61%. These results indicated the methods established in this research were suitably qualified for determining acetochlor residues in raw milk (Table 2).The optimization methods for extracting acetochlor from milk and diets
Milk is a complex matrix consisting of many components (i.e. protein, fat, pigment), which may affect the experimental results. Therefore, pretreatment of samples should be performed before testing the content of acetochlor in milk. The choice of extraction reagent, extraction patterns and matrix dispersants were determined by previous work we have done (the processes not shown in this manuscript). Based on the comparison of extraction rate, we chose acetonitrile as the best extraction reagent from three organic solutions (acetonitrile, acetone, ethyl acetate), which could not only extract acetochlor fully, but also precipitate protein. Later, NaCl was added to separate acetonitrile from water rapidly. We compared three extraction patterns of shaking, ultrasonic, and homogeneity and found shaking showed the best extracting effect according to the calculated recovery rate, which was proved by Li et al.28 Besides, anhydrous MgSO4 has the ability of absorbing moisture and PSA can absorb fatty acid, carbohydrate, phenols, pigments, and other impurities. Cleanert PestiCarb can mainly absorb sterol and carotenoids. These three reagents were used as cleaning agents and adsorbents, facilitating accurate detection of acetochlor residues.Model of acetochlor residues detected in milk of each treatment group
In the preliminary experiment, the treatment period of the LD group was set as 30 days, which was the same as other two groups. However, the highest content of acetochlor residues was 3.22 × 10⁻² mg kg−1 at the 29th day (Fig. 1), which was just about 12-fold of the initial content (2.68 × 10⁻³ mg kg−1 at the 6th day). But from Fig. 2 and 3, the highest residues content, 0.147 mg kg−1 at the 25th day of the MD group and 0.192 mg kg−1 at the 25th day of the HD group trial, were 73 and 59-fold of the initial content respectively. Nag et al. pointed out that long-term use of low-dose pesticides may have adverse effects on animals,24 which indicated that the continuous treatment of acetochlor may have a higher residual value. Therefore, we extended the feeding period to 40 days and found that the content of acetochlor residues was higher than the 29th day, 0.128 mg kg−1 at the 34th day, which was 48-fold of the initial content. By extending the feeding period of LD group, the variation trend of acetochlor residues was similar to those of the MD and HD group. Therefore, 60 days (feeding period of 40 days and withdrawal period of 20 days) was selected as the experimental period for the LD group. | ||
| Fig. 1 Concentration of acetochlor residues in the milk of the low-dose treatment group. | ||
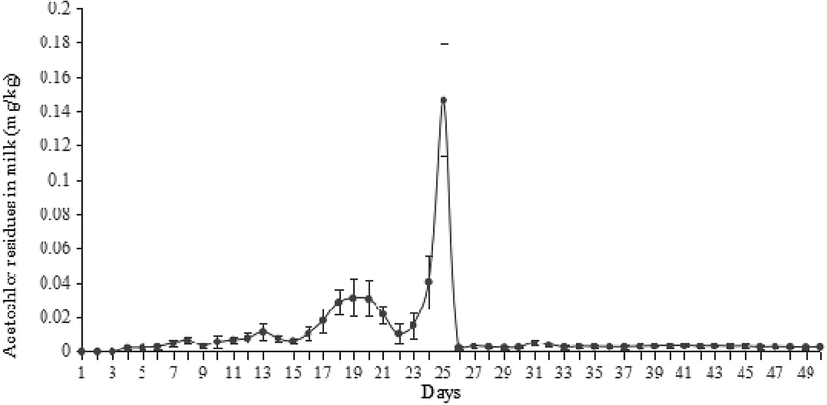 | ||
| Fig. 2 Concentration of acetochlor residues in the milk of the middle-dose treatment group. | ||
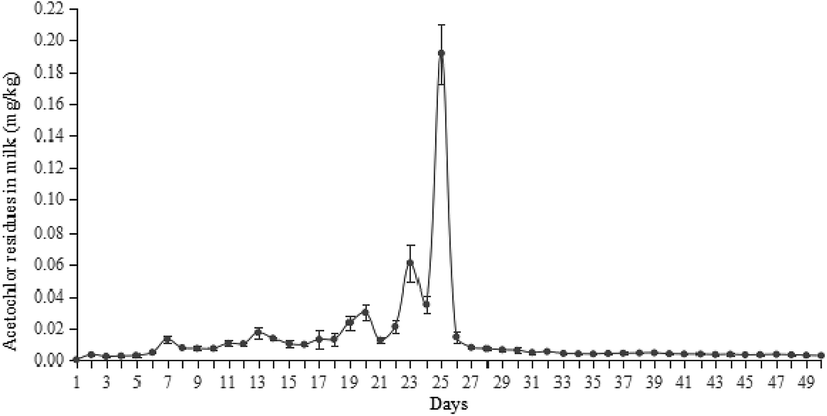 | ||
| Fig. 3 Concentration of acetochlor residues in the milk of the high-dose treatment group. | ||
By analyzing the dynamic relationship between acetochlor residues in milk and time, we found the changes of the three treatment groups were consistent. Acetochlor residues of the LD treatment group were not detected during the first 5 days (Fig. 1), and then the concentration of acetochlor residues increased slowly and consecutively from the 6th day (2.68 × 10⁻³ mg kg−1) to the 15th day (8.44 × 10⁻³ mg kg−1). Similar to that, Shen et al. found melamine could not be detected in cows' milk until the 24th h after first ingestion,4 showing that pesticides could not be detected immediately after contamination. In the initial 16 days, the values of acetochlor content were lower than 0.01 mg kg−1. After that, acetochlor content fluctuated and reached the highest level (0.128 mg kg−1 at the 34th day) during the whole treatment period. In the fluctuant period, there was another high value, 3.22 × 10⁻² mg kg−1 at the 29th day, then the concentration of acetochlor continued to increase. After 2 days of rising, the concentration dropped sharply below MRL and remained stable. Acetochlor residues of the MD and HD treatment groups showed similar trends to that of the LD treatment group (Fig. 2 and 3). However, acetochlor residues of these two groups could be detected quicker than the LD group. After that, a fluctuation period appeared and the concentration reached the highest values (3.14 × 10⁻² mg kg−1 on the 19th day of MD group and 0.147 mg kg−1 on the 25th day of HD group) during the feeding period, then dropped until steady.
We found that all the three groups had fluctuation periods before achieving maximum recorded concentrations. We speculate that the fluctuation was probably related to continuous acetochlor administration and the complexity of metabolism and migration of acetochlor in dairy cows. Fries et al. researched on the law of DDT metobolites in raw milk and found that the concentration of the DDT metabolites fluctuate to some extent,29 similar to what was observed in our study. Besides, different daily milk production could also contribute to fluctuation, which has previously been reported by Cruywagen et al.30 In the initial stages of the feeding period, the acetochlor content in raw milk of all three groups was relatively low. The probable reason is that a part of acetochlor is excluded by urine and faeces, or deposited in the tissues. Another explanation is that microbes in the cow's rumen can breakdown the acetochlor molecule. Oberien et al. reached a similar conclusion by analyzing metabolic mechanism of malathion in dairy cows, observing that rumen microorganisms of cows could degrade some malathion by phosphatase.31 Nonetheless, the accumulation of acetochlor in raw milk increased with the continuous administration. The concentration of residues in milk is related to pharmacokinetic factors, such as molecular weight, protein binding rate, half-life period, blood/milk ratio of drugs and so on.32 Drug concentration in plasma/milk is a dynamic equilibrium, which means drug concentration in milk is positively correlated with that in plasma. In this study we adopted a repeat-dose method. The concentration of acetochlor in milk increased as the drug delivery time increased.
The concentration of acetochlor residues of the three treatment groups dropped sharply after achieving a maximum, and subsequently remained stable under the MRL. The main reason may be that cows can mobilize the body's organs, such as the liver, to reduce concentration of acetochlor following accumulation in plasma, resulting in a sharp associated decrease of concentration in milk. When drug administration stopped, concentration of residues in milk was at a low level. This is because most of acetochlor can be excreted by urine and faeces and mammary ductal cells of cows have certain barrier functionality against acetochlor. Although the treatment of cows was switched back to a no-acetochlor pattern and the levels of acetochlor was under MRL, it could still be detected to the end of the trial, which reflects previous reports by Nag et al.24 They reported that chlorine pesticide could be detected in goat milk samples up to 20 days after withdrawal.
Transfer efficiency of acetochlor from feed to milk
The time to acetochlor detection shortened with increasing dosage administration, as illustrated in Fig. 1, 2 and 3 (the 6th day of LD group, the 4th day of MD group and the 2nd day of HD group). However, the transfer efficiency of acetochlor decreased with the dose of acetochlor increasing. We calculated that the average transfer efficiency of acetochlor detected in milk of the LD, MD and HD groups was 0.080%, 0.032% and 0.014% respectively (Table 3). The results indicated that the transfer efficiency of acetochlor from feed to milk was very low. Transfer efficiency and acetochlor administration had a negative correlation relationship. Sun et al. had the similar conclusion that the transfer efficiency of melamine from feed to milk was faily low. But there was no significant relationship between transfer efficiency and melamine administration. We inferred that the difference was related to drugs, methods and dose administration.33 Weiwei et al. investigated omethoate migration from feed to goat milk and founded that the omethoate residues of the low-dose group (9 mg per day) and high-dose group (18 mg per day) in goat milk was very low.34 The migration rate was also low (0.515% and 0.429%, respectively), which was consistent with our results. In contrast, the maximum amount of acetochlor concentration of three groups showed a gradual increase based on the dosage (0.128, 0.147 and 0.191 mg kg−1 of LD, MD and HD respectively), which meant that acetochlor with a higher dosage concentration had greater impact on milk. In the treatment process, each cow was fed 15 kg basic feed per day. There was 0.45 g acetochlor in the diet to guarantee that the daily intake of acetochlor was 0.45 g per head, which indicated the intake was 30 mg acetochlor per kg daily meal (DM) during the feeding period of the LD group. According to the same algorithm, the intakes were 90 and 270 mg acetochlor per kg DM for the MD and HD group, respectively. Compared to the intake concentration of acetochlor during the feeding period (i.e. 30 mg acetochlor/kg DM of the LD group), acetochlor detected from milk (i.e. 0.00268–0.128 mg kg−1 of the LD group) was only a small fraction relative to the dosage. It was possible that other residues remained in tissue or viscus, or excreted via urine.| Index | Treatment groups | ||
|---|---|---|---|
| LD | MD | HD | |
| Average acetochlor content (mg kg−1) | 14.48 × 10⁻³ | 16.27 × 10⁻³ | 19.48 × 10⁻³ |
| Average milk yield (kg per day) | 24.62 ± 2.29 | 26.23 ± 3.11 | 29.22 ± 3.69 |
| Average acetochlor excretion via milk (mg per day) | 0.36 | 0.43 | 0.57 |
| Average acetochlor transfer efficiency (%) | 0.080 | 0.032 | 0.014 |
Apart from these aspects, behavior of feeding would also have affected transfer efficiency. Mosha et al. studied mammary excretion and residues in goat milk by different methods of administration. Existed time for ethion residues detected in milk above the MRL lasted more than 2 weeks by intravenous injection, and was limited but long-standing (more than 5 weeks) by dermal exposure.35 Twenty Spanish farmers who were exposed to acetochlor by dermal exposure, oral intake, and inhalation, were monitored for the major acetochlor metabolites from urine, 2-ethyl-6-methyl-aniline. Acetochlor could be detected in all urine samples collected from farmers, but the concentrations were too low to affect farmers' health.36 In this way, not only the feed stuff but also environment should be considered for acetochlor control efforts. Dermal exposure can also induce the transfer of acetochlor. Besides, farmers exposed to acetochlor may also present one of the possible sources of milk cross-contamination.
Faouder et al. fed dairy cows with silage adding fipronil, with results demonstrating that no fipronil was detected in milk but sulfone (the metabolite of fipronil) residues could be identified, suggesting the pathway of fipronil from feed to raw milk under its sulfone form.37 In a study of Jablonkai, it was noteworthy that only 9% of the parent acetochlor molecule could be detected after acetochlor exposure in soil approaching one year, while other acetochlor was degraded into two metabolites.38 In addition, Jablonkai speculated the major metabolite, deethoxymethyl acetochlor (2-chloro-N-(2-ethyl-6-methylphenyl) acetde), may come from a hydrolytic cleavage of the ethoxymethyl side chain. These studies suggest that determination of other metabolites and the metabolites in milk and other tissues of cows could be considered for analysis of acetochlor residues, which will be elaborated in further research in the future.
Risk assessment
Pesticide residues in milk become a public health concern because milk and dairy products are widely consumed by infants, children and adults. The accumulation of these compounds in the human body occurs as humans are at the top in the food chain, with diverse diet sources.39 The pesticide residues in milk may come from contaminated feed, silage of grass or corn, and direct application of pesticides to cows. Although acetochlor is considered as a safe herbicide, the widespread use of this herbicide gradually increases the resistance of weeds. People subsequently have to increase the amount of acetochlor dose applied, leading to increased accumulation of acetochlor residues in soil and crops.40 This may lead to increased occurrence of acetochlor residues contaminating milk, posing serious health risks.According to our dynamic analyses between the concentration of acetochlor in milk and time, we found that long-time exposure to low concentration of acetochlor has greater risks. Even after withdrawing the drug, larger fluctuation may appear. But the amounts of acetochlor residues of the MD and HD groups were nonetheless under the designated MRL after withdrawal, which means that acetochlor detection and control play great importance in the dairy industry, especially low-dose acetochlor treatments.
According to the maximum pesticide residue limits in food in China (China standard, GB2763-2016), the acceptable daily intake (ADI) of acetochlor was 0.02 mg kg−1 (bw). In our research, the final residue of acetochlor in the three groups of milk was lower than the MRL (0.01 mg kg−1). We chose 0.01 mg kg−1 as the supervised trial median residue (STMR) value. The national estimated daily intake (NEDI) can be calculated by the equation as follow:
| NEDI = STMR × Fi/bw |
Conclusions
In this study, we combined a QuEChERS extraction method with GC-MS to analyze the dynamic process of acetochlor transfer from feed to milk. The three treatment groups tested showed similar trends. The acetochlor ingested by cows can be partly transferred into milk, however residues cannot be detected in milk immediately. The dose of acetochlor seems to be the key factor influencing residues in milk. The concentration of residues of the HD group surpassed the MRL formulated by FDA only after one week, and residues increase with drug administration increasing. The concentration decreased rapidly after achieving the maximum due to complex organism regulation. However, acetochlor could be detected from milk after the cessation of acetochlor dosing over longer periods. The transfer efficiency of these three groups were 0.080%, 0.032% and 0.014%, which showed negative correlation with the dose of acetochlor. That means transfer efficiency of acetochlor from feed to milk is low but low-dose and long-term exposure to acetochlor poses a potential risk, which merits concern in relation to detection and control. The NEDI of acetochlor was 1.67 × 10⁻⁵ mg kg−1, just 0.08% of ADI. Besides, the final residues of all the three groups were below the LOQ, indicating daily digestion of acetochlor from milk was at low risk. Overall, a comprehensive analysis of acetochlor transfer from feed to milk was provided, which can contribute to risk assessment efforts, as well as supporting scientific guidance for acetochlor control.Author contributions
Conceptualization, X. Q. Y. J. J. and W. Z.; formal analysis, X. Q. and Y. J. J. and Z. H. W.; investigation, L. Y. L.; resources, Y. J. J. and C. X. M.; data curation, X. Q. T. Y. and Z. H. W.; writing—original draft preparation, X. Q. and L. Y. L.; writing—review and editing, X. Q., S. Q. F., S. H. C., X. Y. Y. and E. M. F.; visualization, C. X. M. and D. Y. Z.; supervision, Y. J. J., C. X. M., and W. Z.; funding acquisition, Y. J. J.; project administration, Y. J. J. All authors have read and agreed to the published version of the manuscript.Conflicts of interest
There are no conflicts to declare.Acknowledgements
This work was supported by National Key Research and Development Project (2018YFE0120500) and the National Natural Science Foundation of China (31871828).Notes and references
- G. Bhandari, P. Zomer, K. Atreya, H. G. J. Mol, X. Yang and V. Geissen, Environ. Res., 2019, 172, 511–521 Search PubMed.
- T. M. M. Loughlin, M. L. Peluso, M. A. Etchegoyen, L. L. Alonso, M. C. De Castro, M. C. Percudani and D. J. G. Marino, Food Control, 2018, 93, 129–138 Search PubMed.
- M. Shamsipur, N. Yazdanfar and M. Ghambarian, Food Chem., 2016, 204, 289–297 Search PubMed.
- J. S. Shen, J. Wang, H. Y. Wei, D. Bu, P. Sun and L. Zhou, J. Dairy Sci., 2010, 93, 2060–2066 Search PubMed.
- C. Monteagudo, M. Mariscalarcas, L. Herasgonzalez, D. Ibanezpeinado, A. Rivas and F. Oleaserrano, Chemosphere, 2016, 156, 135–142 Search PubMed.
- J. Butlerdawson, K. Galvin, P. S. Thorne and D. S. Rohlman, Neurotoxicology, 2016, 53, 165–172 Search PubMed.
- H. Liu, T. Chu, L. Chen, W. Gui and G. Zhu, Chemosphere, 2017, 181, 600–608 Search PubMed.
- P. K. Maurya and D. Malik, J. Ind. Pollut. Control, 2016, 32, 580–594 Search PubMed.
- D. Jin, A. Gong and H. Zhou, RSC Adv., 2017, 7, 17489–17496 Search PubMed.
- L. Li, M. Wang, S. Chen, W. Zhao, Y. Zhao, X. Wang and Y. Zhang, Pestic. Biochem. Physiol., 2016, 128, 82–88 Search PubMed.
- C. C. Lerro, S. Koutros, G. Andreotti, C. J. Hines, A. Blair, J. H. Lubin, X. Ma, Y. Zhang and L. E. B. Freeman, Int. J. Cancer, 2015, 137, 1167–1175 Search PubMed.
- A. Grube, D. Donaldson, T. Kiely and L. Wu, US EPA, Washington, DC, 2011.
- C. E. Lindley, J. T. Stewart and M. W. Sandstrom, J. AOAC Int., 1996 Search PubMed.
- E. Kampire, B. T. Kiremire, S. A. Nyanzi and M. Kishimba, Chemosphere, 2011, 84, 923–927 Search PubMed.
- H. Wang, Y. Jiang, C. Tian, R. Pan, F. Dang, J. Feng, M. Li, Y. Zhang, H. Li and C. Man, Food Addit. Contam., Part A: Chem., Anal., Control, Exposure Risk Assess., 2018, 35, 1990–1999 Search PubMed.
- I. Jeong, B. Kwak, J. Ahn and S. Jeong, Food Chem., 2012, 133, 473–481 Search PubMed.
- G. Ramadan, M. A. Jabir, N. Alabdulmalik and A. Mohammed, Drug Test. Anal., 2016, 8, 498–510 Search PubMed.
- H. Li, Y. Feng, X. Li and D. Zeng, Bull. Environ. Contam. Toxicol., 2018, 100, 815–820 Search PubMed.
- J. Namiesnik, Pol. J. Environ. Stud., 2001, 10, 127–140 Search PubMed.
- E. Commission, EU Pesticides database, Available from, http://ec.europa.eu/sanco_pesticides/public/index.cfm.
- M. Aslam, S. Rais and M. Alam, J. Environ. Prot., 2013, 2013, 964–974 Search PubMed.
- C. Qu, S. Albanese, A. Lima, J. Li, A. L. Doherty, S. Qi and B. De Vivo, Environ. Pollut., 2017, 231, 1497–1506 Search PubMed.
- J. T. Miles, B. J. Demott, S. A. Hinton, M. J. Montgomery and S. E. Bennett, J. Dairy Sci., 1971, 54, 478–480 Search PubMed.
- S. K. Nag, S. K. Mahanta, M. K. Raikwar and B. K. Bhadoria, Small Ruminant Research, 2007, 67, 235–242 Search PubMed.
- J. Stocka, M. Tankiewicz, M. Biziuk and J. Namieśnik, Int. J. Mol. Sci., 2011, 12, 7785–7805 Search PubMed.
- M. Anastassiades, S. J. Lehotay, D. Stajnbaher and F. J. Schenck, J. AOAC Int., 2003, 86, 412–431 Search PubMed.
- S. Jawaid, F. N. Talpur, S. M. Nizamani, A. A. Khaskheli and H. I. Afridi, Environ. Monit. Assess., 2016, 188, 230 Search PubMed.
- N. Li, L. Lei, L. Nian, R. Zhang, S. Wu, R. Ren, Y. Wang, H. Zhang and A. Yu, Talanta, 2013, 105, 219–228 Search PubMed.
- G. F. Fries, W. P. Flatt and L. A. Moore, J. Dairy Sci., 1969, 52, 684–686 Search PubMed.
- C. W. Cruywagen, M. A. Stander, M. Adonis and T. Calitz, J. Dairy Sci., 2009, 92, 2046–2050 Search PubMed.
- R. D. Obrien, W. C. Dauterman and R. P. Niedermeier, J. Agric. Food Chem., 1961, 9, 39–42 Search PubMed.
- V. Cerkvenikflajs, I. Grabnar, N. K. Eržen, I. Marc, J. Antonic, A. Verglesrataj, J. Kužner and M. Pogacnik, J. Agric. Food Chem., 2007, 55, 9733–9738 Search PubMed.
- P. Sun, J. Wang, J. S. Shen and H. Y. Wei, J. Dairy Sci., 2011, 94, 3575–3582 Search PubMed.
- D. Weiwei, Master thesis, Northeast Agricultural University, 2009.
- R. D. Mosha, N. Gyrdhansen and P. Nielsen, J. Agric. Food Chem., 1991, 39, 396–399 Search PubMed.
- C. Gustin, S. J. Moran, J. D. Fuhrman, M. L. Kurtzweil, J. M. Kronenberg, D. I. Gustafson and M. Marshall, Regul. Toxicol. Pharmacol., 2005, 43, 141–149 Search PubMed.
- J. L. Faouder, E. Bichon, P. Brunschwig, R. Landelle, F. Andre and B. L. Bizec, Talanta, 2007, 73, 710–717 Search PubMed.
- I. Jablonkai, Int. J. Environ. Anal. Chem., 2000, 78, 1–8 Search PubMed.
- E. M. Shaker and E. E. Elsharkawy, Environ. Toxicol. Pharmacol., 2015, 39, 433–440 Search PubMed.
- I. Lee, T. Won, Y. Seo, E. J. Kim, Y. Yun, S. Cho, O. Kwon, S. Kim, W. Chung and T. Park, Weed Turfgrass Science, 2012, 2, 318–321 Search PubMed.
- K. Ge, J. Jia and H.M. Liu, Ann. Nutr., 2007, 51, 26–31 Search PubMed.
Footnote |
| † These authors contributed to the work equally and should be regarded as the co-first authors. |
| This journal is © The Royal Society of Chemistry 2020 |