 Open Access Article
Electrochemical performance of activated carbon fiber with hydrogen bond-induced high sulfur/nitrogen doping†
Chaohui Ruan and
Yibing Xie *
*
School of Chemistry and Chemical Engineering, Southeast University, Nanjing 211189, China. E-mail: ybxie@seu.edu.cn
First published on 12th October 2020
Abstract
The sulfur/nitrogen co-doped activated carbon fiber (S/N-ACF) is prepared by the thermal treatment of thiourea-bonded hydroxyl-rich carbon fiber, which can bond the decomposition products of thiourea through hydrogen bond interaction to avoid the significant loss of sulfur and nitrogen sources during the thermal treatment process. The sulfur/nitrogen co-doped carbon fiber (S/N-CF) is prepared by the thermal treatment of thiourea-adsorbed carbon fiber. The doping degree of the carbon fiber is improved by reasonable strategy. S/N-ACF shows a higher amount of S/N doping (4.56 at% N and 3.16 at% S) than S/N-CF (1.25 at% N and 0.61 at% S). S/N-ACF with high S/N doping level involves highly active sites to improve the capacitive performance, and high delocalization electron to improve the conductivity and rate capability when compared with the normal S/N co-doped carbon fiber (S/N-CF). Accordingly, the specific capacitance increases from 1196 mF cm−2 for S/N-CF to 2704 mF cm−2 for S/N-ACF at 1 mA cm−2. The all-solid-state flexible S/N-ACF supercapacitor achieves 184.7 μW h cm−2 at 350 μW cm−2. The results suggest that S/N-ACF has potential application as a CF-based supercapacitor electrode material.
1. Introduction
Flexible mobile electronics, smart textiles and large display screens have grown significantly, stimulating the rapid development of flexible energy storage devices. Supercapacitors1,2 have been regarded as one of the most important energy storage devices due to their intrinsic advantages of high power density, fast charge–discharge rate and good cycling reliability.3,4 However, the electrode materials of conventional supercapacitors usually lack flexibility and toughness, and severely hinder their applications for flexible and wearable electronic devices. Thus, as an ideal candidate for flexible energy storage devices, the flexible supercapacitor has attracted a lot of attention.5 The crucial features of a flexible supercapacitor are good mechanical strength, flexibility and electrochemical performance, which put forward higher requirements for electrode materials. Carbon fibers (CF), as one of the flexible supercapacitor electrode materials, have attracted sustained attention due to its advantages such as lightweight, advanced flexibility, inexpensiveness, chemical stability and deformable mechanical properties.6–9 However, CF has some defects, like lacking an electrochemical active site and low specific surface area, resulting in poor electrochemical performance.3 Moreover, the faradaic capacitance is much higher than the electrical double layer capacitance of carbon materials.9–14 In recent years, the surface modification of carbon materials has been a research hotspot.15–17 Notably, N/S co-doping has been shown to be helpful in adjusting the electronic properties of carbon materials, such as creating charge sites, polarizing electron pairs, as well as enhancing the electrochemical properties.18–20 The thermal treatment of heteroatom-enriched sources and CF is an appropriate method to introduce heteroatoms into the surface of CF. As a sulfur and nitrogen source, thiourea (TU) is an ideal choice for the preparation of S/N co-doped CF (S/N-CF). However, TU is sublimated at about 150 °C and decomposed at about 180 °C in a vacuum or inert gas atmosphere.21 This decomposition reaction might be described as the formula (1):22| 2SC(NH2)2 → CS2 + H2NCN + 2NH3 | (1) |
In this paper, the sulfur/nitrogen co-doped activated carbon fiber (S/N-ACF) is prepared by the thermal treatment of the hydroxyl-rich carbon fiber (CF-OH) that tightly bonded thiourea. CF-OH as a substrate achieves sufficient adsorption of thiourea and its decomposition products via hydrogen bonds. The N and S atomic percentage of S/N-ACF (4.36 and 3.16 at%) was much higher than that of S/N-CF (1.25 and 0.61 at%). The highly enhanced S/N doping degree contributes to improving the specific capacitance and rate capability of CF. S/N-CF and S/N-ACF show specific capacitance of 2704 and 1196 mF cm−2 at 1 mA cm−2, respectively, and a capacitance retention of 64.71 and 54.48% when the current density increases from 1 to 40 mA cm−2. The all-solid-state flexible supercapacitor using two S/N-ACF electrodes achieves 184.7 μW h cm−2 at 350 μW cm−2 and good cycling performance. These results proved that S/N-ACF has potential application as CF-based supercapacitors.
2. Experimental section
2.1. Materials
CF was obtained from Jiangsu Sutong CF Co., Ltd. Sulfuric acid (98%, AR); polyvinyl alcohol (PVA) and TU were obtained from Sinopharm Chemical Reagent Co., Ltd.2.2. Computational model and method
The adsorption of TU on the surface of CF or oxygen-functionalized CF was investigated via density functional theory (DFT) calculations.23–25 The periodic supercell of the 4 × 4 graphene unit cells formed by 32 carbon atoms (C32) was applied to simulate the interaction between TU and CF. Single hydroxyl or epoxy groups grafted onto C32 to fabricate C32-O and C32-OH were used to simulate the adsorption of TU by CF-O and CF-OH. The CASTEP code of Materials Studio was applied to optimize the structure of the adsorption of TU on C32, C32-O and C32-OH. Additionally, the Perdew–Burke–Ernzerhof (PBE) exchange–correlation functional of generalized gradient approximation (GGA) and ultrasoft pseudopotential was applied. Furthermore, a 2 × 2 × 1 Monkhorst–Pack grid in the Brillouin zone and a 350 eV cutoff energy were selected after testing. The convergence tolerance was set as the total energy converged to 2 × 10⁻⁵ eV per atom. In addition, the residual stress was less than 0.02 GPa, and the residual force was less than 0.01 eV Å−1. To evaluate the interaction of TU with C32, C32-O or C32-OH, the binding energy (Eb) was calculated by the following formulas (2)–(4):| Eb = (E(TU) + E(C32)) − E(TU/C32) | (2) |
| Eb = (E(TU) + E(C32-O)) − E(TU/C32-O) | (3) |
| Eb = (E(TU) + E(C32-OH)) − E(TU/C32-OH) | (4) |
2.3. Preparation of S/N co-doped activated CF (S/N-ACF)
The surface density and thickness of the carbon fiber (CF, 1 × 4 cm2) were 6.6 mg cm−2 and 2.0 mm, respectively. Before the thermal treatment, CF was ultrasonically washed by acetone, alcohol, and distilled water in order. After that, CF was dried at 60 °C. The electrochemical activation of CF was performed in a standard three-electrode cell, and the electrolyte was 3.0 M H2SO4. Here, CF was used as the working electrode, the platinum electrode was the counter electrode and the saturated calomel electrode (SCE) was reference electrode. CF was electrochemically oxidized under +10 V for 10 min, followed by electrochemical reduction under −10 V for 30 min. The samples obtained were defined as CF-OH. As a comparison, CF only conducted electrochemical oxidation (+10 V for 30 min). The samples obtained were defined as CF-O. These electrochemically activated CF samples were washed with distilled water three times. CF, CF-O and CF-OH were impregnated in 50 mL TU solution (0.2 M) overnight, respectively. These samples were dried at 60 °C, and were defined as TU/CF, TU/CF-O and TU/CF-OH, respectively. Finally, TU/CF, TU/CF-O and TU/CF-OH conducted thermal treatment in a tube furnace at 1000 °C for 2 h in N2 atmosphere (5 °C min−1), which were defined as S/N-CF, S/N-CF-O and S/N-ACF. The mass density of S/N-ACF was 5.5 mg cm−2.2.4. Preparation of the S/N-ACF supercapacitor
The S/N-ACF supercapacitor was assembled via two S/N-ACF, H2SO4–PVA gel electrolyte and porous dialysis membrane shown in Fig. 11a. First, the H2SO4–PVA gel electrolyte was obtained with a solution-casting method that was similar to the papers of our research group.26 The rectangular S/N-ACF (total area: ∼1 × 3 cm2, working area: ∼1 × 2 cm2) was immersed into the H2SO4–PVA gel electrolyte three times to make sure that the electrolyte was in full contact with the electrode. Two S/N-ACF electrodes of the same shape were placed face-to-face, and assembled into S/N-ACF FSC. The overlapped part was wrapped with plastic wrap, and dried at room temperature to evaporate extra water.2.5. Characterization
The morphological characteristics of the samples were studied via field emission scanning electron microscopy (FESEM, Zeiss Ultra Plus). In addition, the surfaces of various activated CF were analyzed utilizing the X-ray photoelectron spectroscopy spectrometer (XPS, ESCALAB 250 X-ray photoelectron spectrometer, Al Kα radiation), as well as energy-dispersive X-ray spectroscopy (EDX, Phenom ProX, The Netherlands). Furthermore, thermogravimetric analysis (TGA) was carried out on a synchronous thermal analyzer (STA449F3, Netzsch, Germany) under N2 atmosphere (5 °C min−1).2.6. Electrochemical measurements
Cyclic voltammetry (CV), galvanostatic charge/discharge (GCD) and electrochemical impedance spectroscopy (EIS) measurements of various activated CF were tested with a CHI760C electrochemical workstation at room temperature. The activated CF samples above were used directly and served as the working electrode. Here, the effective immersed area is 1 cm2. Furthermore, the platinum electrode was used for the counter electrode, and the saturated calomel electrode served as the reference electrode. 1.0 M H2SO4 solution was applied as the electrolyte for S/N-ACF. The EIS spectra were collected with an open potential, and the frequency range was 10 mHz to 100 kHz. The cycling stability test was carried out, making use of the LAND CT2001A battery testing system. Moreover, the area specific capacitance (Cs, mF cm−2) was calculated by the formula (5):| Cs = I × Δt/S × ΔV | (5) |
| E = Cs × (ΔV)2/2 | (6) |
| P = I × ΔV/2S | (7) |
3. Results and discussion
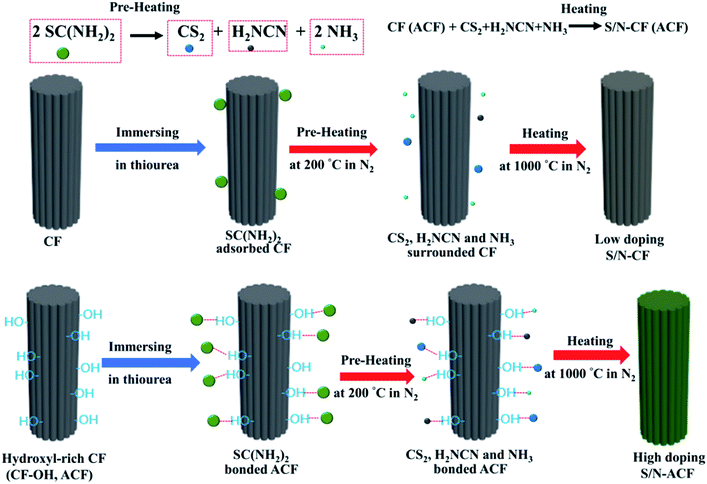
Carbon fiber (CF) is considered to be the perfect candidate as an electrode material for the supercapacitor, but suffers from low specific capacitance and rate capability. The S/N co-doping is an ideal route to boost the electrochemical performance of CF. The post-treatment of CF with thiourea (SC(NH2)2) is an effective strategy to prepare S/N-CF (Fig. 1). Thiourea is adsorbed onto the surface of CF, and then conducts pre-heating treatment from room temperature to 200 °C. Thiourea is thermally decomposed into CS2, H2NCN and NH3. Finally, CS2, H2NCN and NH3 will react with CF to prepare S/N-CF. Unfortunately, bare CF adsorbs the decomposition products of thiourea via weak intermolecular interaction. Thus, CS2, H2NCN and NH3 can easily escape from the CF surface. In addition, the S and N sources involved in the doping reaction will be reduced. Obviously, S/N-CF showed a very low S/N co-doping degree. So, how to avoid the loss of S and N sources during thermal treatment are the key issues to improve the S/N co-doping degree of CF.In this work, we propose a strategy of interfacial activation to increase the doping level of CF. The sulfur/nitrogen co-doped activated carbon fiber (S/N-ACF) was prepared by the thermal treatment of thiourea bonded hydroxyl-rich carbon fiber (CF-OH). CF-OH can bond the decomposition products of thiourea (CS2, H2NCN and NH3) through hydrogen bonds (–NH⋯O and –S⋯OH) to avoid the significant loss of sulfur and nitrogen sources during the thermal treatment process, thus causing the highly doped S/N-ACF. S/N-ACF with the high S/N doping level involved the highly active sites to improve the capacitive performance, and the high electron delocalization improved the conductivity and rate capability when compared with S/N-CF.
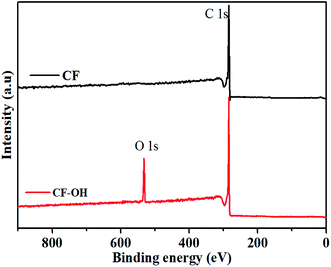
Fig. 2 shows the XPS spectrum of CF and CF-OH. The atomic binding states of CF and CF-OH illustrate the obvious difference. Both CF and CF-OH show the C 1s peak. Comparatively, CF-OH also shows the O 1s peak of the hydroxyl group, which indicates that the carbonyl group could be electrochemically reduced into the hydroxyl group.27–30 So, the electrochemical treatment could improve the activation of CF.
The surface of CF is modified by oxygen-containing functional groups under electrochemical oxidation. Marrani et al. proposed the mechanism of electrochemical reduction of graphene oxide.31 The conjugated structure of the carbon skeleton is restored due to the reduction of the epoxy group, as shown in the formula (8). In addition, formula (9) shows that the carbonyl group is reduced to the hydroxyl group, which provides a route for hydroxylation of the CF surface.
 | (8) |
 | (9) |
Fig. 3 shows the schematic illustration of the oxygen functional groups on the carbon skeleton of CF, CF-O and CF-OH. The carbon atoms in CF are arranged in a similar manner to graphite. Specifically, the carbon atoms are in a regular hexagonal pattern, preferentially aligned along the CF axis.32 The carbon skeleton of CF-O includes the oxygen-containing functional groups of the hydroxyl, epoxy and carbonyl groups. The epoxy or hydroxyl groups exist on the basal plane of the carbon skeleton, leading to the rehybridization from the sp2 to sp3 state. Thus, the electrochemical oxidation of CF results in the decreased graphitization degree of CF-O. The electrochemical reduction of CF-O results in the restoration of the conjugated structure of the carbon skeleton. Furthermore, the electrochemical reduction of the carbonyl groups produces extra hydroxyl groups on the edge of the carbon skeleton.
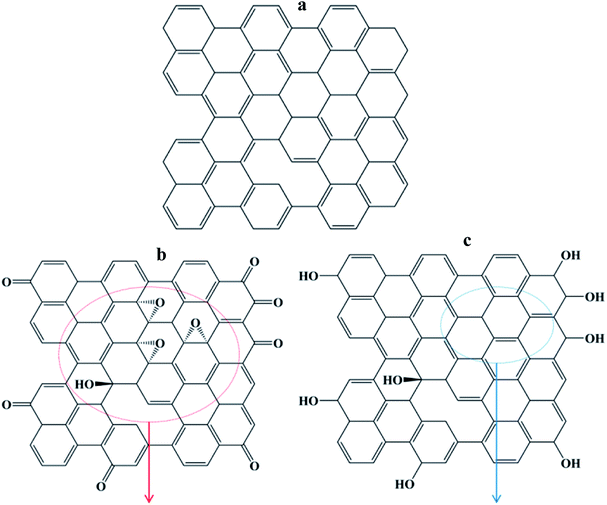 | ||
| Fig. 3 Schematic illustration of the oxygen functional groups on the carbon skeleton of (a) CF, (b) CF-O and (c) CF-OH. | ||
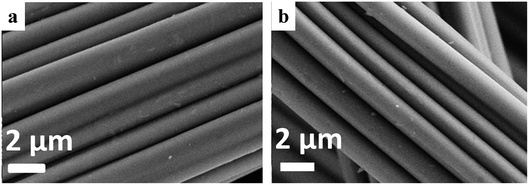
Fig. 4 shows the SEM images of S/N-CF and S/N-ACF. Both S/N-CF and S/N-ACF keep the similar morphology (Fig. 4a and b). This indicates that the S and N doping reaction on both CF and ACF does not have a great influence on the surface morphology of S/N-CF and S/N-ACF.
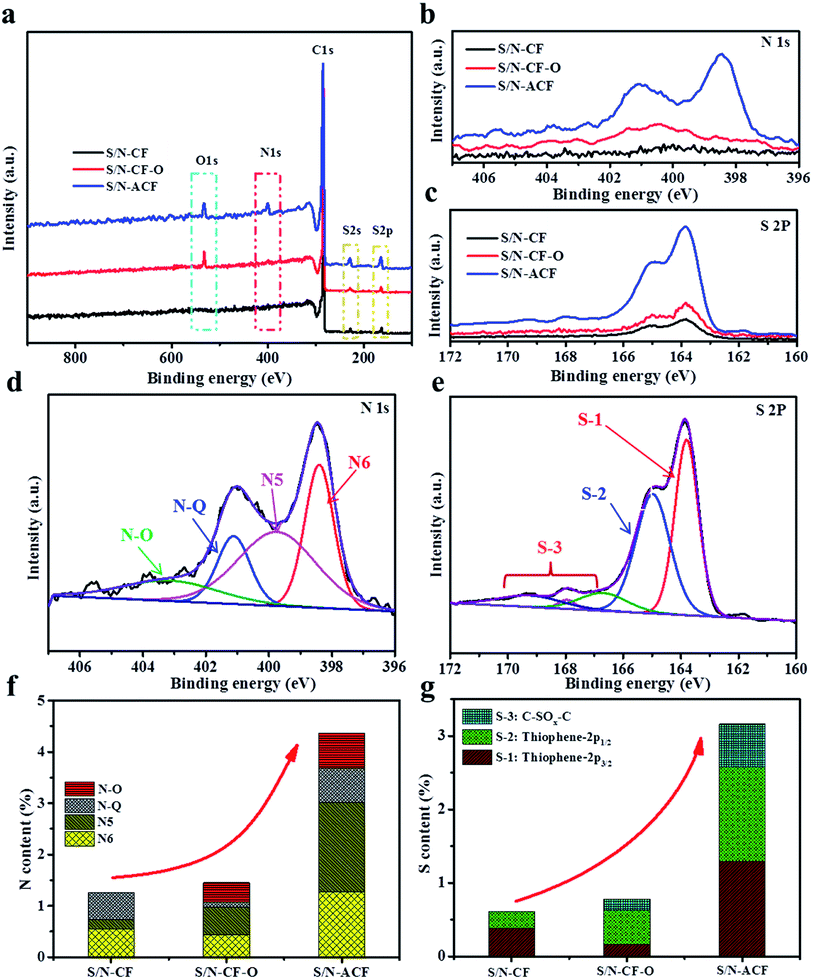
The surface chemical components of S/N-CF, S/N-CF-O and S/N-ACF were fully calculated by XPS analysis. As shown in Fig. 5a–c, the XPS survey spectra indicates that there are three primary peaks at around 284, 400, 532 eV, and two weak peaks at around 168 and 230 eV, which were assigned to C 1s, N 1s, O 1s, S 2p and S 2s, respectively.33–35 These results further indicate that the S and N atoms have been incorporated into CF. Fig. 5d and e show the N 1s and S 2p XPS spectra of S/N-ACF. The N 1s spectra can be fitted into N-Q (401.2 eV), N-6 (398.4 eV), and N-5 (399.8 eV), and the pyridine-N-O (403.2 eV).36–39 N-6 and N-5 can offer extra free or delocalized electron that participate in pseudocapacitive faradaic reactions.40 Thus, the high content of N-6 and N-5 are in favor of the enhancement of the capacitance of CF. Meanwhile, many papers have reported that the presence of graphitic nitrogen can enhance the charge transfer of carbon materials for excellent ionic or electronic conductivity.41 The content of N-6, N5 and N-Q of S/N-ACF are much higher than those of S/N-CF and S/N-CF-O, which is conducive to the enhancement of S/N-ACF's electrochemical performance (Table S1†). The S 2p XPS spectral analysis of S/N-ACF shows that there are five binding modes of the sulfur dopants. The peaks located at 163.8 and 165 eV correspond to thiophene-S (C–S–C, 2p3/2, 2p1/2). The peaks located at 166.7, 167.9 and 168.9 eV correspond to sulfur oxide C–SOx–C (x = 1–4).33,34,42 Thiophene-S provides additional delocalized electrons on the conjugated backbones of carbon, making for enhanced conductivity. Sulfur oxide (C–SOx–C) can take part in the faradaic reactions and create plenty of reversible pseudo-sites, which is in favor of the improvement of the capacitance. Fig. 5g and h show the total N contents and S contents of S/N-CF, S/N-CF-O and S/N-ACF. The elemental contents of N and S for S/N-CF-O are 1.45 and 0.78%, for S/N-CF are 1.25 and 0.61%, respectively. The N and S elemental contents of S/N-ACF are 4.36 and 3.16 at% in atomic ratio, respectively, which is higher S,N co-doping contents than the reported carbons42–48 (Table S2†). S/N-ACF exhibits much higher content of thiophene-S and C–SOx–C than those of S/N-CF and S/N-CF-O. So, the N and S functionalities can not only enhance the electrical conductivity of CF, but also contributed to the pseudocapacitance by participating in the redox reactions. Obviously, S/N-ACF shows a high degree of S/N doping, which will be beneficial to improving the electrochemical performance.
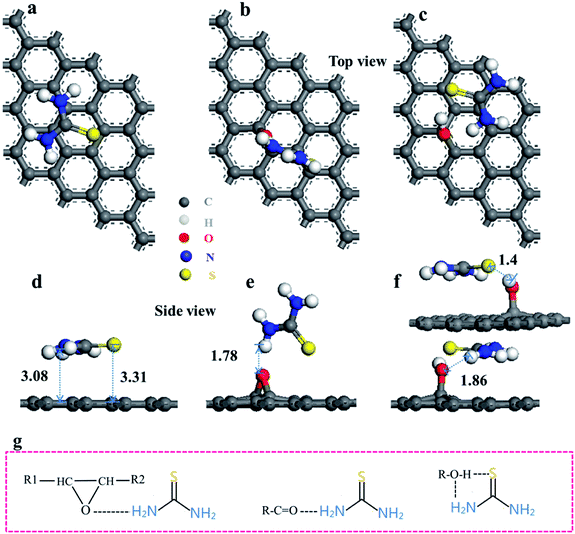
To gain insight, DFT was applied to research the adsorption of TU on CF, CF-O and CF-OH. TU/C32, TU/C32-O and TU/C32-OH were used to simulate the adsorption of TU by CF, CF-O or CF-OH, respectively. The relaxed structures obtained by plain DFT are shown in Fig. 6a–f. The top views of TU/C32, TU/C32-O and TU/C32-OH are shown in Fig. 6a, b and c, respectively. Fig. 6d, e and f show the side views of TU/C32, TU/C32-O and TU/C32-OH, respectively. The binding energies (Eb) for TU on the different surfaces are shown in Table S3.† The binding energy of TU/C32 (0.74 eV) is much larger than that of TU/C32-O (0.79 eV) and TU/C32-OH (1.46 eV), indicating that the interaction between the OH group and TU molecule is very strong.
The TU molecule interacts with C32-OH to form double H-bonding. The S atom in the TU molecule interacts with the hydroxyl group of C32-OH to form a H-bonding of –OH⋯S.49 The amino group of the TU molecule interacts with the oxygen atom in C32-OH to form another H-bonding of –NH⋯O.50 Notably, the amino group of the TU molecule interacts with the O atom in C32-O to form only single H-bonding of –NH⋯O. Double hydrogen bonds are stronger than single hydrogen bonds. Thus, the binding energy of TU/C32-OH is much larger than that of TU/C32-O. Hydrogen bonds are also much stronger than van der Waals forces.51 C32 interacts with the TU molecule by van der Waals force. Thus, the binding energy of TU/C32 is the smallest of all.
Based on the calculated result, the OH group enhanced the bonding energy between C32-OH and TU through the double H-bonding. These enhancements of the H-bonding interaction also appeared in the adsorption of graphene oxide to NO2 or SO2.52,53 In other words, the OH group enhanced the adsorption of CF to nitrogen and sulfur atoms. The interaction between the hydroxyl and thermal decomposition products of TU (such as CS2, H2NCN and NH3) must be very strong due to H-bonding. So, it can be inferred from this that CF-OH binds sulfur and nitrogen sources (such as SC(NH2)2 and CS2, H2NCN and NH3) tightly by H-bonding. Thus, CS2, H2NCN and NH3 cannot easily escape from the ACF (CF-OH) surface. More S and N sources are provided for doping reactions at the intermediate temperature stage.
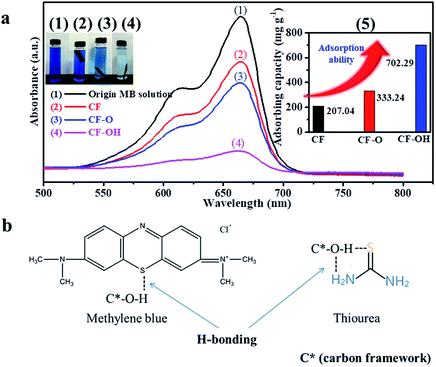
3.1. Dye-absorption method
The dye-absorption method was used to study the adsorption of CF, CF-O and CF-OH to methylene blue (MB) (Fig. 7a). Specifically, CF, CF-O and CF-OH were soaked in 40 mL high concentration MB solution (1000 mg L−1) for 12 h in the dark, respectively. Compared to the original MB solution, the MB solution impregnated with CF-OH presented the significantly decreased MB intensity. This indicates that more MB molecules were absorbed by CF-OH than CF and CF-O, confirming the enhanced adsorption capacity of CF-OH. The adsorptive capacities of MB for the samples calculated by the standard curve (Fig. 5a, inset (e)) were 207.24 (CF), 333.24 (CF-O) and 702.29 (CF-OH) mg g−1, respectively. Fig. 7b shows that the interaction mechanism between methylene blue and hydroxyl is similar to that between TU and hydroxyl. The MB molecule also interacts with CF-OH to form H-bonding.DFT and the dye-absorption method proved the strong adsorption of CF-OH to sulfur and nitrogen sources. Thermogravimetric analysis was applied to measure the loss degree of the sulfur source or nitrogen source on the surface of CF or CF-OH during thermal treatment (under 200 °C). Significantly, the weight loss of TU/CF-OH (13.02%) was much lower than that of TU/CF (16.12%) from 150 to 320 °C, indicating that the hydroxyl group reduced the loss of sulfur and nitrogen sources (TU and its thermal decomposition products). Below 800 °C, the weight loss of TU/CF-OH (28.01%) was also lower than that of TU/CF (31.35%), proving that more N and S atoms were doped into the surface of CF-OH.
Fig. 8b shows the differential thermogravimetry (DTG) curve of TU/CF and TU/CF-OH. According to the previous reports, TU was sublimated at about 150 °C and decomposed at about 180 °C. From 174 to 320 °C, the decomposition rate of TU on the surface of CF or CF-OH increased rapidly with temperature and reached the maximum at 195 °C. This is because TU and its thermal decomposition products were carried away by the nitrogen gas flow. However, the weight loss rate of TU/CF-OH was much slower than that of TU/CF, which indicates that –OH reduces the mass loss caused by the thermal decomposition of TU. During the heating process, it was more difficult for TU and its thermal decomposition products on the surface of CF-OH to escape to N2 than for CF. According to previous reports, the thermal reduction of GO occurred around 177 °C, releasing CO2, H2O, and CO at the same time.54 Thus, the thermal reduction of CF-OH (dehydroxylation) occurs at around 177 °C, too. However, the sublimation or thermal decomposition of TU was the main factor for the quality change of TU/CF-OH, from 174 to 320 °C. So, the weight loss rate of TU/CF-OH was much slower than that of TU/CF. Thermogravimetric analysis proved that CF-OH has a strong adsorption effect on S and N sources through H-bonding (–NH⋯O and –S⋯OH), which contributed to the doping reaction. Thus, S/N-ACF shows a much higher S/N doping degree than S/N-CF.
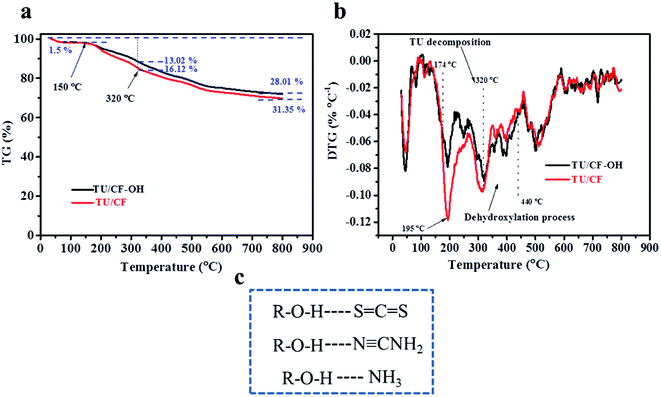 | ||
| Fig. 8 (a) TG and (b) DTG curve. (c) Hydrogen bonding between the hydroxyl group and thermal decomposition products of TU. | ||
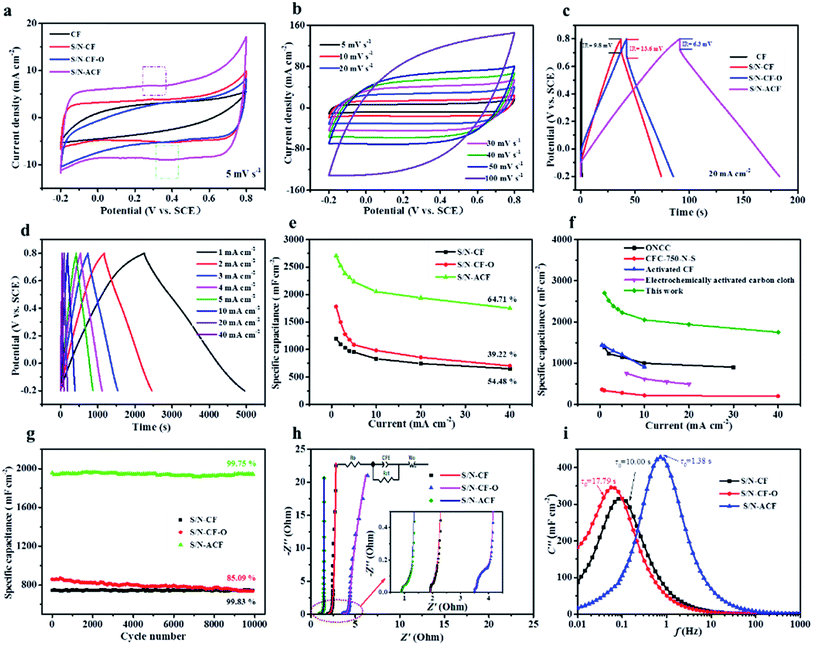
Fig. 9a exhibits the typical CV curves of CF, S/N-CF, S/N-CF-O and S/N-ACF at 5 mV s−1. Obviously, the area under the CV curve of CF is much smaller than that of S/N-CF, S/N-CF-O, and S/N-ACF. This is mainly due to the high content of S and N contributing to the enhancement of the specific capacitance. It is noteworthy that the occurrence of reversible humps at around 0.3 to 0.4 V indicates the presence of pseudocapacitance behavior due to the redox reactions, as shown in Fig. S1.†55,56
Fig. 9b shows the CV curves of the S/N-ACF electrode at different scan rates. Here, these CV curves show approximate rectangular features at different scan rates. The potential window is from −0.2 to 0.8 V. In addition, the CV curve of the S/N-ACF electrode shows a box-like shape with good symmetry, even at a high scan rate (100 mV s−1).
To deeply investigate the performance of the CF samples, GCD curves of CF, S/N-CF, S/N-CF-O and S/N-ACF were tested at 20 mA cm−2 (Fig. 9c). According to eqn (5), the specific capacitances of CF, S/N-CF, S/N-CF-O and S/N-ACF were calculated as 10, 744, 858 and 1940 mF cm−2, respectively. S/N-ACF shows extremely excellent capacitive performance at high current density. Fig. 9d shows that all of the GCD curves are relatively symmetrical, indicating good electrochemical reversibility of the S/N-ACF electrode. Fig. 9e exhibits the rate capability of S/N-CF, S/N-CF-O and S/N-ACF, which were derived from the GCD curves. The specific capacitance of S/N-ACF (2704 mF cm−2) was much higher than that of S/N-CF (1196 mF cm−2) and S/N-CF-O (1780 mF cm−2) at 1.0 mA cm−2. The capacitance retention of S/N-ACF is 64.71% when the current density increases from 1.0 to 40 mA cm−2, which is much high than that of S/N-CF (54.48%) and S/N-CF-O (39.22%). S/N-ACF shows remarkable electrochemical performance (capacitive performance and rate capability), which is mainly due to the high S/N co-doping degree of S/N-ACF. More importantly, as shown in Fig. 9f, this impressive specific capacitance and rate capability is also much higher than some of the recently reported CF-based electrodes, such as ONCC (oxygen-containing groups modified nitrogen-doped CF, 1385 mF cm−2 at 1 mA cm−2),57 CFC-750-N-S (362 mF cm−2 at 1 mA cm−2),47 ACF (activated carbon felt, 1441 mF cm−2 at 0.5 mA cm−2)58 and EACC (electrochemically activated carbon cloth, 756 mF cm−2 at 6 mA cm−2).59 Fig. 9g shows the cycling stability of S/N-CF, S/N-CF-O and S/N-ACF after 10![[thin space (1/6-em)]](https://www.rsc.org/images/entities/char_2009.gif) 000 cycles at 20 mA cm−2. The capacitance retentions of S/N-CF, S/N-CF-O and S/N-ACF electrodes are 99.83, 85.09 and 99.75%, respectively. Obviously, these results demonstrate that S/N-CF and S/N-ACF retained good cycle stability. However, the S/N-CF-O electrode exhibited relatively poor cyclic stability, which may be due to the high oxygen content of S/N-CF-O. Some of the unstable groups (epoxy and carbonyl group) on the surface of S/N-CF-O lead to the decrease of cyclic stability.60,61
000 cycles at 20 mA cm−2. The capacitance retentions of S/N-CF, S/N-CF-O and S/N-ACF electrodes are 99.83, 85.09 and 99.75%, respectively. Obviously, these results demonstrate that S/N-CF and S/N-ACF retained good cycle stability. However, the S/N-CF-O electrode exhibited relatively poor cyclic stability, which may be due to the high oxygen content of S/N-CF-O. Some of the unstable groups (epoxy and carbonyl group) on the surface of S/N-CF-O lead to the decrease of cyclic stability.60,61
The Nyquist plots and the corresponding fitting curves of the S/N-CF, S/N-CF-O and S/N-ACF electrodes are shown in Fig. 9h. The inset shows the enlarged Nyquist plots of the electrodes in the high frequency region. Table S4† lists the fitting values of the equivalent circuit elements for S/N-CF, S/N-CF-O and S/N-ACF. The ohmic resistances (Ro) of the S/N-CF, S/N-CF-O and S/N-ACF electrodes are 2.36, 4.15 and 1.36 Ω, respectively. S/N-ACF shows the lowest ohmic resistance of all, which is due to the high S/N co-doping degree of S/N-ACF. Meanwhile, S/N-ACF shows the smallest Warburg resistance (1.35 Ω) of all. It is relatively easy for the electrolyte ions to diffuse to the surface of S/N-ACF for electrochemical reactions. The capacitance–frequency curves can precisely reflect the relationship between frequency and the electrochemical characteristics.62 The imaginary part (C′′) of the capacitance was calculated by the formula (10):63
 | (10) |
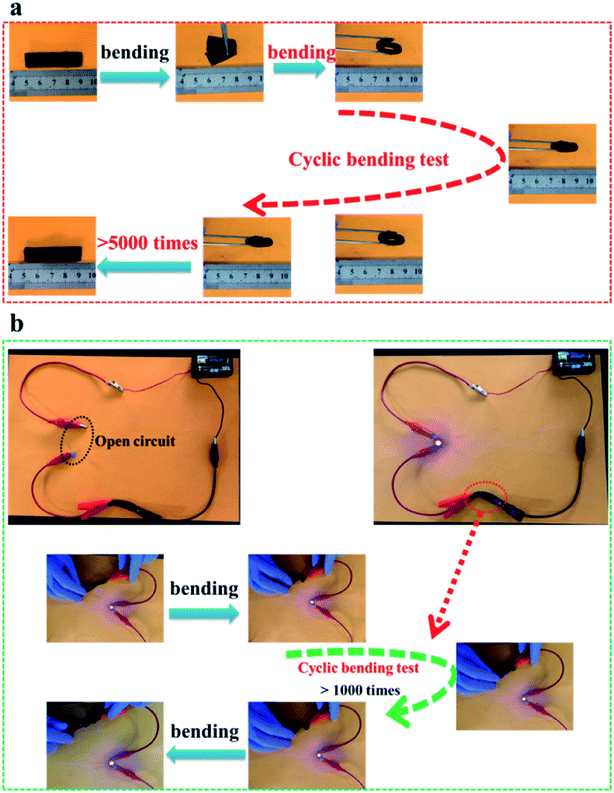
Fig. 10a shows the excellent bending performance of S/N-ACF. The S/N-ACF electrode still kept up the original state after bending tests of more than 5000 times, indicating the outstanding mechanical property. Fig. 10b shows the excellent conductive stability of S/N-ACF. Obviously, the brightness of the light-emitting-diode (LED) was held steady during the cyclic bending test, which indicates the prominent conductive stability of the S/N-ACF electrode. Clearly, S/N-ACF shows that the prominent performance of the conductive stability and bending can be applied to the flexible supercapacitor.
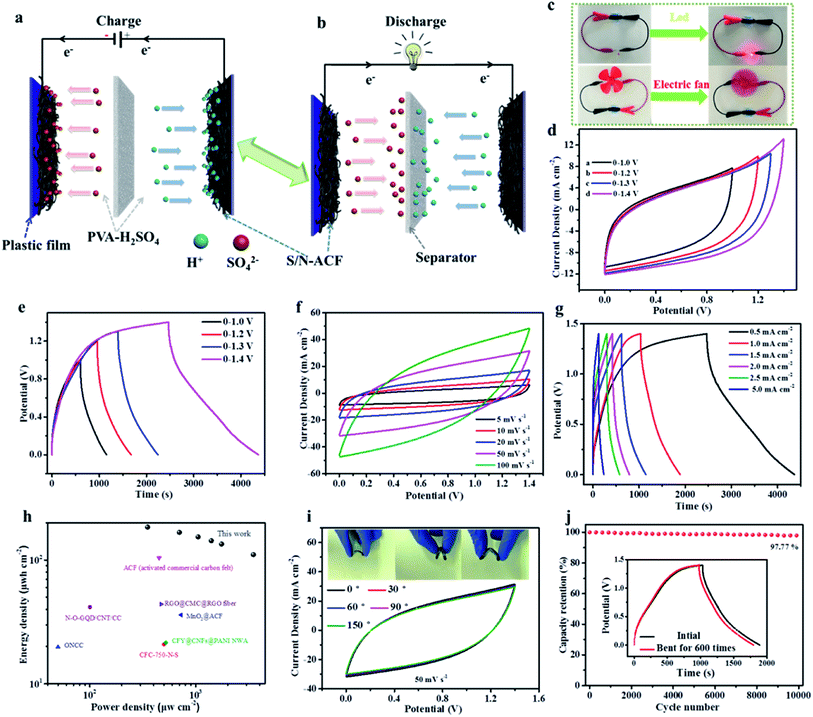
To further verify the performance of the S/N-ACF electrode for practical application, the S/N-ACF//S/N-ACF flexible supercapacitor (FSC) was assembled. Fig. 11a and b shows the schematic diagram of the charging and discharging process of the S/N-ACF//S/N-ACF FSC. Additionally, Fig. 11c shows that just one unit of S/N-ACF//S/N-ACF FSC powered a LED and an electric fan. This indicates that the S/N-ACF//S/N-ACF FSC shows outstanding energy storage performance, as well as practical application potential. As eqn (8) and (9) shows, the voltage window (ΔV) is an important parameter for the energy density of SC. Fig. 11d exhibits the CV curves of the S/N-ACF//S/N-ACF FSC at 10 mV s−1 with different voltage windows. Obviously, even at the large voltage window of 0 to 1.4 V, these approximate rectangular shaped CV curves show an ideal capacitive behavior. Thus, 0–1.4 V was selected as ideal voltage window for follow-up research. Additionally, the discharge GCD curves (Fig. 11e) were still nearly symmetrical with the corresponding charging counterpart as the operation potential increased from 1.0 to 1.4 V, indicating a good electrochemical reversibility of the FSC. Fig. 11f shows that the CV curves of FSC kept a nearly rectangular shape when the scan rates increased from 5 to 100 mV s−1, proving that the S/N-ACF FSC showed outstanding capacitive behavior in the voltage window of 0–1.4 V. Moreover, Fig. 11g shows that the GCD curves of S/N-ACF//S/N-ACF FSC at different current densities exhibited an approximately linear relationship between the discharge/charge time and voltage, proving that this FSC showed fast charge–discharge ability and good capacitive performance. Fig. 11h shows the Ragone plot of S/N-ACF//S/N-ACF FSC. This FSC shows a high energy density of 184.7 μW h cm−2 under the power density of 350 μW cm−2, which is much higher than that of other recently reported FSC.47,57,58,64–67 Fig. 9i shows the excellent flexibility of the S/N-ACF//S/N-ACF FSC. What is noteworthy is that the CV curves obtained at bending angles of 0°, 30°, 60°, 90° and 150° have similar shapes and sizes. Additionally, as shown in Fig. 11j, the supercapacitor exhibits exceptional cycle stability. When the current density is 1.0 mA cm−2, the capacitance of FSC retains about 97.77% of the initial specific capacitance after 10![[thin space (1/6-em)]](https://www.rsc.org/images/entities/char_2009.gif) 000 cycles of the charging–discharging test. The inset of Fig. 11j shows the GCD of S/N-ACF//S/N-ACF FSC before and after being repeatedly bent for 600 cycles, demonstrating the outstanding mechanical property and electrochemical stability of the FSC. To sum up, the acquired S/N-ACF can serve as an efficient electrode for high performance flexible energy storage devices.
000 cycles of the charging–discharging test. The inset of Fig. 11j shows the GCD of S/N-ACF//S/N-ACF FSC before and after being repeatedly bent for 600 cycles, demonstrating the outstanding mechanical property and electrochemical stability of the FSC. To sum up, the acquired S/N-ACF can serve as an efficient electrode for high performance flexible energy storage devices.
4. Conclusions
In this paper, CF sequentially conducts electrochemical oxidation (CF-O), electrochemical reduction to form CF-OH, and then a high-temperature treatment of CF, CF-O and CF-OH impregnated with TU to prepare S/N-CF, S/N-CF-O and S/N-ACF, respectively. At the molecular level, the strong adsorption of CF-OH to thiourea (high binding energy between hydroxyl group and thiourea) was demonstrated by density functional theory. Thermogravimetric analysis demonstrated that CF-OH reduces the loss of sulfur and nitrogen sources, which is the main reason that S/N-ACF shows much higher S/N doping degree than S/N-CF. The N and S atomic percentage of S/N-ACF (4.36 and 3.16 at%) was much higher than that of S/N-CF (1.25 and 0.61 at%) and S/N-CF-O (1.45 and 0.78 at%). This led to an improvement in an electrical conductivity in an enhanced specific capacitance. In addition, the electrochemical reduction caused an improvement in the cycling stability of S/N-CF-O because of the removal of an unstable group. S/N-ACF shows higher cycling durability with nearly 99.75% capacitance retention after 10![[thin space (1/6-em)]](https://www.rsc.org/images/entities/char_2009.gif) 000 cycles than S/N-CF-O. S/N-CF, S/N-CF-O and S/N-ACF showed specific capacitance values of 2704, 1780 and 1196 mF cm−2 at 1 mA cm−2, respectively, and capacitance retention of 54.48, 39.22, and 64.71% when the current density increased from 1 to 40 mA cm−2. The all-solid-state flexible supercapacitors using two S/N-ACF electrodes achieved 184.7 μW h cm−2 at 350 μW cm−2 and good cycling performance. The results suggested that S/N-ACF has the potential to be used in CF-based supercapacitors.
000 cycles than S/N-CF-O. S/N-CF, S/N-CF-O and S/N-ACF showed specific capacitance values of 2704, 1780 and 1196 mF cm−2 at 1 mA cm−2, respectively, and capacitance retention of 54.48, 39.22, and 64.71% when the current density increased from 1 to 40 mA cm−2. The all-solid-state flexible supercapacitors using two S/N-ACF electrodes achieved 184.7 μW h cm−2 at 350 μW cm−2 and good cycling performance. The results suggested that S/N-ACF has the potential to be used in CF-based supercapacitors.
Conflicts of interest
There is no conflict to declare.Acknowledgements
The work was supported by the National Natural Science Foundation of China (No. 21373047), Graduate Innovation Program of Jiangsu Province (KYCX18_0080), the Fundamental Research Funds for the Central Universities (2242018K41024) and the Priority Academic Program Development of Jiangsu Higher Education Institutions.References
- D. Z. Wang, Y. Y. Xiao, X. N. Luo, Z. Z. Wu, Y. J. Wang and B. Z. Fang, ACS Sustainable Chem. Eng., 2017, 5, 2509 CrossRef CAS.
- B. Fang, Y. Z. Wei and M. Kumagai, J. Power Sources, 2006, 155, 487 CrossRef CAS.
- B. Z. Fang, A. Bonakdarpour, Y. L. Xing, J. S. Yu and D. P. Wilkinson, in Electrochemical Capacitors: Fundamentals to Applications, ed. T. Brousse, W. Sugimoto, P. Simon, J. Long and P. N. Kumta, Electrochemical Soc Inc, Pennington, 2014, vol. 58, p. 13 Search PubMed.
- Y. Xie, Chem. Rec., 2019, 19, 1370 Search PubMed.
- Y. Xie and Y. Zhang, J. Solid State Electrochem., 2019, 23, 1911 CrossRef CAS.
- J. Xu, C. Ruan, P. Li and Y. Xie, Chem. Eng. J., 2019, 378, 14 Search PubMed.
- Y. Xie and Y. Zhou, J. Mater. Res., 2019, 34, 2472 CrossRef CAS.
- C. Ruan, P. Li, J. Xu, Y. Chen and Y. Xie, Inorg. Chem. Front., 2019, 6, 3583 RSC.
- L. Lu and Y. Xie, J. Mater. Sci., 2019, 54, 4842 CrossRef CAS.
- P. Li, C. Ruan, J. Xu and Y. Xie, J. Alloys Compd., 2019, 791, 152 CrossRef CAS.
- P. Li, C. Ruan, J. Xu and Y. Xie, Nanoscale, 2019, 11, 13639 RSC.
- Y. Xie and C. Yao, Mater. Res. Express, 2020, 6, 125550 CrossRef.
- J. Xu, C. Ruan, P. Li, Y. Mu and Y. Xie, Electrochim. Acta, 2020, 340, 135950 CrossRef CAS.
- P. Li, C. Ruan, J. Xu and Y. Xie, Electrochim. Acta, 2020, 330, 135334 CrossRef CAS.
- B. Fang, Y. Z. Wei, K. Suzuki and A. Kumagai, Electrochim. Acta, 2005, 50, 3616 CrossRef CAS.
- Y. Z. Wei, B. Fang, S. Iwasa and M. Kumagai, J. Power Sources, 2005, 141, 386 CrossRef CAS.
- C. Ruan, P. Li, J. Xu and Y. Xie, Prog. Org. Coat., 2020, 139, 12 CrossRef.
- S. L. Huo, M. Q. Liu, L. L. Wu, M. J. Liu, M. Xu, W. Ni and Y. M. Yan, J. Power Sources, 2018, 387, 81 CrossRef CAS.
- W. J. Zhang, Z. T. Chen, X. L. Guo, K. Jin, Y. X. Wang, L. Li, Y. Zhang, Z. M. Wang, L. T. Sun and T. Zhang, Electrochim. Acta, 2018, 278, 51 CrossRef CAS.
- M. Q. Liu, S. L. Huo, M. Xu, L. L. Wu, M. J. Liu, Y. F. Xue and Y. M. Yan, Electrochim. Acta, 2018, 274, 389 CrossRef CAS.
- W. F. Tang, L. X. Song, S. Zhang, H. F. Li, J. Sun and X. Y. Gu, J. Mater. Sci., 2017, 52, 208 CrossRef CAS.
- S. Wang, Q. Y. Gao and J. C. Wang, J. Phys. Chem. B, 2005, 109, 17281 CrossRef CAS.
- Y. Wang and Y. Xie, J. Alloys Compd., 2020, 824, 18 Search PubMed.
- Y. Mu, C. Ruan, P. Li, J. Xu and Y. Xie, Electrochim. Acta, 2020, 338, 11 CrossRef.
- Y. Mu and Y. Xie, J. Phys. Chem. C, 2019, 123, 18232 CrossRef CAS.
- Y. Chen and Y. Xie, Adv. Electron. Mater., 2019, 5, 1900816 CrossRef CAS.
- L. Stobinski, B. Lesiak, A. Malolepszy, M. Mazurkiewicz, B. Mierzwa, J. Zemek, P. Jiricek and I. Bieloshapka, J. Electron Spectrosc. Relat. Phenom., 2014, 195, 145 CrossRef CAS.
- L. Z. Fan, S. Y. Qiao, W. L. Song, M. Wu, X. B. He and X. H. Qu, Electrochim. Acta, 2013, 105, 299 CrossRef CAS.
- Z. J. Liu, Z. H. Zhao, Y. Y. Wang, S. Dou, D. F. Yan, D. D. Liu, Z. H. Xia and S. Y. Wang, Adv. Mater., 2017, 29, 7 Search PubMed.
- X. Xiao, T. Q. Li, Z. H. Peng, H. Y. Jin, Q. Z. Zhong, Q. Y. Hu, B. Yao, Q. P. Luo, C. F. Zhang, L. Gong, J. Chen, Y. Gogotsi and J. Zhou, Nano Energy, 2014, 6, 1 CrossRef CAS.
- A. G. Marrani, A. Motta, R. Schrebler, R. Zanoni and E. A. Dalchiele, Electrochim. Acta, 2019, 304, 231 CrossRef CAS.
- B. Xu, H. R. Wang, Q. Z. Zhu, N. Sun, B. Anasori, L. F. Hu, F. Wang, Y. B. Guan and Y. Gogotsi, Energy Storage Materials, 2018, 12, 128 CrossRef.
- M. Wang, H. Liu, D. D. Zhai, X. Y. Chen and Z. J. Zhang, J. Power Sources, 2019, 416, 79 CrossRef CAS.
- L. L. Cheng, Y. Y. Hu, D. D. Qiao, Y. Zhu, H. Wang and Z. Jiao, Electrochim. Acta, 2018, 259, 587 CrossRef CAS.
- L. Miao, H. Duan, M. X. Liu, W. J. Lu, D. Z. Zhu, T. Chen, L. C. Li and L. H. Gan, Chem. Eng. J., 2017, 317, 651 CrossRef CAS.
- H. R. Peng, B. Yao, X. J. Wei, T. Y. Liu, T. Y. Kou, P. Xiao, Y. H. Zhang and Y. Li, Adv. Energy Mater., 2019, 9, 9 Search PubMed.
- P. Ramakrishnan and S. Shanmugam, ACS Sustainable Chem. Eng., 2016, 4, 2439 CrossRef CAS.
- J. K. Ou, L. Yang, Z. Zhang and X. H. Xi, J. Power Sources, 2016, 333, 193 CrossRef CAS.
- S. M. Liu, Y. J. Cai, X. Zhao, Y. R. Liang, M. T. Zheng, H. Hu, H. W. Dong, S. P. Jiang, Y. L. Liu and Y. Xiao, J. Power Sources, 2017, 360, 373 CrossRef CAS.
- J. C. Zhang, J. S. Zhou, D. Wang, L. Hou and F. M. Gao, Electrochim. Acta, 2016, 191, 933 CrossRef CAS.
- J. H. Hou, C. B. Cao, F. Idrees and X. L. Ma, ACS Nano, 2015, 9, 2556 CrossRef CAS.
- N. Q. Tran, B. K. Kang, M. H. Woo and D. H. Yoon, ChemSusChem, 2016, 9, 2261 CrossRef CAS.
- P. F. Tian, J. B. Zang, S. P. Jia, Y. Zhang, H. W. Gao, S. Y. Zhou, W. P. Wang, H. Q. Xu and Y. H. Wang, Appl. Surf. Sci., 2018, 456, 781 CrossRef CAS.
- H. Chen, F. Yu, G. Wang, L. Chen, B. Dai and S. L. Peng, ACS Omega, 2018, 3, 4724 CrossRef CAS.
- W. J. Tian, H. Y. Zhang, X. G. Duan, H. Q. Sun, M. O. Tade, H. M. Ang and S. B. Wang, ACS Appl. Mater. Interfaces, 2016, 8, 7184 CrossRef CAS.
- X. S. Zhang, P. T. Yan, R. J. Zhang, K. Liu, Y. Y. Liu, T. Liu and X. Y. Wang, J. Mater. Chem. A, 2016, 4, 19053 RSC.
- T. Ouyang, K. Cheng, F. Yang, J. T. Jiang, J. Yan, K. Zhu, K. Ye, G. L. Wang, L. M. Zhou and D. X. Cao, Chem. Eng. J., 2018, 335, 638 CrossRef CAS.
- C. H. Yang, J. W. Xiong, X. Ou, C. F. Wu, X. H. Xiong, J. H. Wang, K. Huang and M. L. Liu, Mater. Today Energy, 2018, 8, 37 CrossRef.
- T. G. Heafield, G. Hopkins and L. Hunter, Nature, 1942, 149, 218 CrossRef CAS.
- P. Vishweshwar, A. Nangia and V. M. Lynch, Cryst. Growth Des., 2003, 3, 783 CrossRef CAS.
- B. P. Schoenborn and R. M. Featherstone, Adv. Pharmacol., 1967, 5, 1 CAS.
- H. J. Zhang, W. L. Cen, J. Liu, J. X. Guo, H. Q. Yin and P. Ning, Appl. Surf. Sci., 2015, 324, 61 CrossRef CAS.
- N. J. Fang, J. X. Guo, S. Shu, J. J. Li and Y. H. Chu, Fuel, 2017, 202, 328 CrossRef CAS.
- R. Larciprete, S. Fabris, T. Sun, P. Lacovig, A. Baraldi and S. Lizzit, J. Am. Chem. Soc., 2011, 133, 17315 CrossRef CAS.
- U. B. Nasini, V. G. Bairi, S. K. Ramasahayam, S. E. Bourdo, T. Viswanathan and A. U. Shaikh, J. Power Sources, 2014, 250, 257 CrossRef CAS.
- C. Liu, F. Y. Yi, D. Shu, W. X. Chen, X. P. Zhou, Z. H. Zhu, R. H. Zeng, A. M. Gao, C. He and X. Li, Electrochim. Acta, 2019, 319, 410 CrossRef CAS.
- Y. W. Zheng, W. Zhao, D. D. Jia, L. Cui and J. Q. Liu, Chem. Eng. J., 2019, 364, 70 CrossRef CAS.
- G. B. Lou, Y. T. Wu, X. Q. Zhu, Y. Z. Lu, S. Yu, C. H. Yang, H. Chen, C. Guan, L. Li and Z. H. Shen, ACS Appl. Mater. Interfaces, 2018, 10, 42503 CrossRef CAS.
- W. Wang, W. Y. Liu, Y. X. Zeng, Y. Han, M. H. Yu, X. H. Lu and Y. X. Tong, Adv. Mater., 2015, 27, 3572 CrossRef CAS.
- Y. T. He, Y. H. Zhang, X. F. Li, Z. Lv, X. J. Wang, Z. G. Liu and X. Q. Huang, Electrochim. Acta, 2018, 282, 618 CrossRef CAS.
- D. Ye, Y. Yu, J. Tang, L. Liu and Y. Wu, Nanoscale, 2016, 8, 10406 RSC.
- P. L. Taberna, P. Simon and J. F. Fauvarque, J. Electrochem. Soc., 2003, 150, A292 CrossRef CAS.
- E. Y. L. Teo, H. N. Lim, R. Jose and K. F. Chong, RSC Adv., 2015, 5, 38111 RSC.
- N. Mao, W. C. Chen, J. Meng, Y. Y. Li, K. Zhang, X. H. Qin, H. N. Zhang, C. Y. Zhang, Y. P. Qiu and S. R. Wang, J. Power Sources, 2018, 399, 406 CrossRef CAS.
- H. F. Li, J. C. Liang, H. Li, X. Y. Zheng, Y. Tao, Z. H. Huang and Q. H. Yang, J. Energy Chem., 2019, 31, 95 CrossRef.
- Z. P. Yang, W. Zhao, Y. T. Niu, Y. Y. Zhang, L. B. Wang, W. J. Zhang, X. Xiang and Q. W. Li, Carbon, 2018, 132, 241 CrossRef CAS.
- Z. Li, Y. F. Li, L. Wang, L. Cao, X. Liu, Z. W. Chen, D. Y. Pan and M. H. Wu, Electrochim. Acta, 2017, 235, 561 CrossRef CAS.
Footnote |
| † Electronic supplementary information (ESI) available. See DOI: 10.1039/d0ra06724e |
| This journal is © The Royal Society of Chemistry 2020 |

