 Open Access Article
Creative Commons Attribution 3.0 Unported Licence
Toluene adsorption on porous Cu–BDC@OAC composite at various operating conditions: optimization by response surface methodology
Amir Hossein Khoshakhlagh a,
Farideh Golbabaei
 a,
Mojtaba Beygzadeh
 *b,
Francisco Carrasco-Marín
 c and
Seyed Jamaleddin Shahtaheri*a
aDepartment of Occupational Health Engineering, School of Public Health, Tehran University of Medical Sciences, Tehran, Iran. E-mail: shahtaheri@tums.ac.ir; Tel: +98-2188951390
bDepartment of Energy, Materials & Energy Research Center, P. O. Box: 14155-4777, Tehran, Iran. E-mail: m.beygzadeh@merc.ac.ir; Tel: +98-26-36280040-9
cCarbon Materials Research Group, Faculty of Science, University of Granada, Avda. Fuente Nueva s/n, Spain
First published on 29th September 2020
Abstract
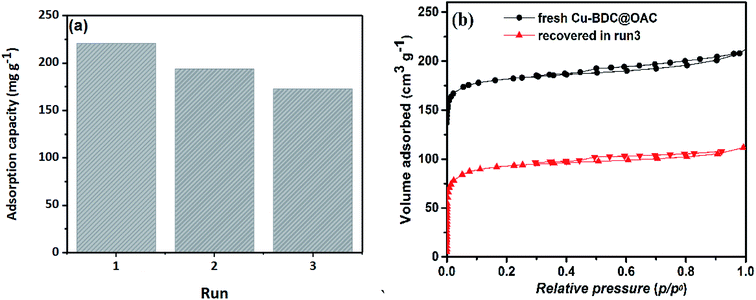
The work presented here describes the synthesis of Cu–BDC MOF (BDC = 1,4-benzenedicarboxylate) based on oxidized activated carbon (microporous Cu–BDC@OAC composite) using an in situ method. The adsorbents (oxidized activated carbon (OAC), Cu–BDC and microporous Cu–BDC@OAC composite) were characterized by XRD, FTIR, SEM, EDS and BET techniques. Optimization of operating parameters affecting the efficiency of adsorption capacity, including adsorbent mass, flow rate, concentration, relative humidity and temperature, was carried out by central composite design (CCD) of the response surface methodology (RSM). An adsorbent mass of 60 mg, a flow rate of 90 mL min−1, the concentration of toluene (500 ppm), the relative humidity of 30% and a temperature of 26 °C were found to be the optimized process conditions. The maximum adsorption capacity for toluene onto Cu–BDC@OAC composite was 222.811 mg g−1, which increased by almost 12% and 50% compared with pure Cu–BDC and oxidized AC, respectively. The presence of micropores enhances the dynamic adsorption capacity of toluene. The regeneration of the composite was still up to 78% after three consecutive adsorption–desorption cycles. According to the obtained adsorbent parameters, microporous Cu–BDC@OAC was shown to be a promising adsorbent for the removal of volatile organic compounds.
1. Introduction
Volatile organic compounds (VOCs) are organic chemicals that have a high vapor pressure at room temperature and a low boiling point in the range of 50–100 °C to 240–260 °C. The sources of VOCs are diverse and include burning fuel, such as gasoline, wood, coal, or natural gas, or a variety of consumer products such as cigarettes, solvents, pesticides, etc. Despite being valuable for many industrial applications, volatile organic compounds (VOCs) are also a health hazard to humans.1Toluene is one of the most common VOCs, that is widely used in the production of fuels and other industrial products.2,3 Various studies have reported that exposure to toluene has major effects on human health, causing diseases such as encephalopathy, headaches and loss of coordination.4–6 The OSHA's (occupational safety and health administration) permissible exposure limit (PEL) standard for toluene as an 8 hour time-weighted average (TWA) limit is 200 ppm, with a maximum limit of 300 ppm (not to be exceeded for more than 10 minutes in any 8 hour TWA); in quantities above 500 ppm it becomes immediately dangerous to life or health (IDLH).7
Hence, there is a pressing need to remove VOCs from the atmosphere. Various physical, chemical and biological removal techniques have been widely used such as adsorption,8,9 oxidation,1,9 bio-filtration,10,11 biodegradation,12 bio-reactor removal13,14 and catalytic combustion.15 Among the above technologies, adsorption is a good candidate method for air purification, as it is efficient, low cost and a simple technique. Various porous materials have been studied as adsorbents for the abatement of VOCs from contaminated air. They consist of activated carbon, carbon nanotubes, zeolites, graphene and metal–organic frameworks (MOFs).8,9,16,17
Metal–organic frameworks (MOFs) are known to have explicit pore structures, a high specific surface area and a high pore volume, which makes them good candidates for many applications, such as gas storage and adsorption.18,19 Compared to other traditional porous materials like activated carbon, MOFs have excellent advantages for the removal of VOCs due to high specific surface area, diverse structural composition, a large number of active adsorption sites and cation–π bonding through electrostatic attraction with a benzene ring.20 A large number of MOF materials are synthesized for VOCs adsorption, which were design to display high selectivity or capacity.20 However, MOFs have a low resistance to high humidity and high temperature, which significantly limits their application in a humid environment.21 To alleviate this, the water stability of MOFs was enhanced by optimized synthetic methods which produced MOFs composites, including MOF–silica, MOF@zeolite, MOF@organic polymers, MOF@CNT and MOF@carbon.21
The most widely used adsorbent for the adsorption process in industrial wastewater treatment systems is activated carbon due to its large specific surface area and high pore volumes.22,23 On the other hand, the modification of activated carbon and the preparation of new composite adsorbent materials from modified activated carbon are necessary.24 Therefore, researches have been continued for the preparation of new alternative adsorbents having reasonable adsorption efficiencies.25
Also, activated carbon has been commonly used as adsorbents for volatile organic compounds (VOCs), due to the hydrophobic surface that is appropriate for adsorption of organic compounds.26 In recent years, it has attracted attention as a low cost solution with a number of useful features (chemisorption, high surface area, material hardness, etc.).27,28 Its surface area range is between 800 and 1200 m2 g−1. Generally, activated carbon can be used in a fixed, moving, or fluidized bed system. The advantages of fixed beds include low cost and longer packing life.29 One of the essential factors for the removal of compounds is surface chemistry. The lack of functional groups on the external surface of the activated carbon (AC) can limit its practical use. Hence, a modification of its surface chemistry was a key point for the work presented here. Oxidized activated carbon (OAC), produced by the introduction of independent monoprotic functional groups on AC surfaces, such as carboxyls (–COOH) can be a favorable solution. Carboxyl groups are affiliated as common oxygen functions on activated carbons. The presence of surface oxygens can influence the adsorption properties of AC, as a result of the formation of additional and diverse binding sites.3,26 Chemical or thermal treatments can be used to manipulate the proportion of oxygen surface groups. In contrast to heating, oxidation/activation can be used for increasing the number of oxygen surface groups.26
Cu–BDC MOF contains copper nodes interconnected by 1,4-benzene dicarboxylate (BDC) coordinated as 2D layers within the bulk crystal. The Cu–BDC MOF is often water stable and can be used as an adsorbent to remove pollutants and gas storage.19,30 By combining with other materials, the characteristics of MOFs can be enhanced to a greater extent for improved functionality/stability, simplicity of preparation and selectivity of operation. For example, the composite Cu-BTC@GO (comprising of Cu-BTC and graphite oxide) improves toluene adsorption capacity.31 As it was mentioned, the MOF or modified MOF material proves magnificent adsorptive toluene performance in the adsorption system.
Furthermore, some of the MOFs have been synthesized and studied under the specific attention of avoiding exposure to air, so enhancing the stability and suitability of MOF materials is needed more research field. The mixture of a MOF and AC can improve performance because most carbon-based materials inherently possess excellent stabilities towards water/vapor. In a study conducted for adsorptive desulfurization, MOF-5@AC was synthesized. The results showed that the composite was an excellent material for adsorptive desulfurization.20
Further experimental research can provide insights on the effects of applying suitable conditions of critical operating parameters, including concentration, flow rate, temperature and relative humidity.3 The optimal experimentation design will have to possess the following three features: (1) cost reduction; (2) accommodation of several parameters, for example, process, variety and separate parameters; (3) optimization of designs can be done when the design-space is constrained.2,32
There are several types of design for experiments, such as one-factor-at-a-time and the response surface methodology (RSM) design. Taking into account the disadvantages of conventional one-factor-at-a-time optimization method such as requiring more runs for the same precision, time-consuming, high overall costs, failure to estimate interactions and missing optimal settings of parameters, using statistical methods such as response surface methodology (RSM) can be performed to enhance the production of a particular substance by optimization of operational variables.2,33 Lately, there has been an enormous increase in the use of RSM in studies.2,33,34 Amari et al. used central composite design (CCD) as an experimental design for the investigation of toluene adsorption onto acid-activated clay. They studied the effect of temperature, contact time, the mass ratio of liquid/solid and strength of the acid. The optimized proportions of the following variables, i.e., temperature, contact time, the mass ratio of liquid/solid and strength of acid were found to be 96.2 °C, 6.93 h, 5.98 and 32.94%, respectively.2 To date, a number of studies have addressed the reduction of toluene just under certain circumstances such as concentration.3,8,26,35,36 These studies did not perform an optimization of essential variables regarding the adsorption capacity. The present study thus addresses this knowledge gap with the aim to provide a comprehensive study of the adsorption behavior of toluene under various operational parameters.
As it was mentioned above, among many MOF materials, Cu–BDC MOF is inexpensive and environmentally friendly and also has a uniform pore size and open-pore structure. After Cu–BDC is combined with oxidized activated carbon, the hydrophobicity and specific surface area are increased by synergistic action.19,30,37 Therefore, this article aimed to synthesize microporous Cu–BDC@OAC composite from incorporating Cu–BDC MOF into oxidized activated carbon with high specific surface area and porosity to enhance the performance of toluene adsorption at various operating conditions. Also, the other purpose of this study is to present a systematic method to determine what range of essential variables has a higher effect on the VOC adsorption. For achieving this aim, optimization will be done by the response surface methodology. Finally, the reusability of the synthesized composite will be investigated.
2. Experimental
2.1 Materials
All chemicals used, including toluene, copper(II) nitrate trihydrate, terephthalic acid, N,N-dimethylformamide (DMF), nitric acid (65%) and hydrochloric acid (1 M) (Titrisol® concentrated solution) were purchased from Merck Co. (Germany). Commercial activated carbon (815 m2 g−1) was supplied by Caware Int'l Corp. (Taiwan).2.2 Pretreatment of adsorbents
Samples (activated carbon) were ground using a mortar grinder (RM 200, Retsch Company) and sieved to a mesh of 35–60 (250–500 μm). After that, the ground sample was mixed with distilled water using stirrer for 1 h with a velocity of 150 rpm to remove impurities, the suspension was passed through a standard sieve and washed 3 times using distilled water. Then, the sample was dried in the oven at 105 °C for 24 h to remove the moisture till constant weight. The dried sample was heated at 200 °C for 1 h in a furnace (Carbolite, UK) in the presence of air.38 Finally, the samples were maintained in a desiccator for further use.2.3 Synthesis of Cu–BDC MOF
The Cu–BDC MOF was prepared by a previously reported method adapted from the published procedure,39 at first, 1![[thin space (1/6-em)]](https://www.rsc.org/images/entities/char_2009.gif) :
:![[thin space (1/6-em)]](https://www.rsc.org/images/entities/char_2009.gif) 1 molar ratio of Cu(NO3)2·3H2O (1.45 g, 6 mmol) and terephthalic acid (1 g, 6 mmol) were mixed in 75 mL DMF. The mixture was stirred for 10 min and after that transferred to a glass reagent bottle heated at 110 °C for 36 h. The bottle was then cooled to room temperature outside the oven. The resulting blue precipitate was filtrated and washed with fresh DMF several times over 24 h. Finally, the sample was dried in an oven at 220 °C for 24 h.
1 molar ratio of Cu(NO3)2·3H2O (1.45 g, 6 mmol) and terephthalic acid (1 g, 6 mmol) were mixed in 75 mL DMF. The mixture was stirred for 10 min and after that transferred to a glass reagent bottle heated at 110 °C for 36 h. The bottle was then cooled to room temperature outside the oven. The resulting blue precipitate was filtrated and washed with fresh DMF several times over 24 h. Finally, the sample was dried in an oven at 220 °C for 24 h.
2.4 Synthesis of Cu–BDC@OAC composite
Oxidized activated carbon with terminal –COOH groups was prepared as previously described.40 In a typical preparation, commercial coconut shell activated carbon (7 g) was placed in reflux conditions for 4 h in 7.5 M nitric acid. Then, after the reaction is complete, the oxidized carbon is filtered off and washed with de-ionized water to stabilize its pH. Finally, it was dried at 75 °C under vacuum. Obtained samples were marked as oxidized activated carbon (OAC). Similarly, the preparation of the Cu–BDC@OAC composite was carried out by adding oxidized activated carbon (4 g) to well-dissolved MOF precursors (6 mmol from each one) in the same procedure as described for the Cu–BDC followed by continuous stirring for 30 min. The obtained precipitate was washed with DMF for several times and dried in an oven at 220 °C for 24 h.2.5 Characterization
Brunauer–Emmett–Teller (BET) surface area analyzer (Belsorp-Mini II, Gemini 2375 (Bel Japan Inc.)) was used to measure the specific surface area and pore size distributions with N2 adsorption/desorption at liquid nitrogen at −196 °C. For achieving this aim, each sample was degassed under the vacuum (10−5 torr) at 150 °C for 24 h. The BET surface area (SBET) and micropore volumes from Dubinin–Radushkevich (W0) were obtained from the N2 adsorption isotherm. Based on the Gurvitch rule, total pore volume was determined, as the N2 adsorbed at P/P0 = 0.95. Furthermore, mesopore volume was calculated subtracting the micropore volume to the total pore volume. Also, pore size distributions were determined by applying quenched solid density functional theory (QSDFT) to the N2 adsorption data.The titration method developed by Boehm was applied to study the surface chemistry of AC. The X-ray powder diffraction patterns were recorded on X'pert MPD Philips DW371 with Cu Kα radiation (λ = 1.5406 Å). Fourier transform infrared spectroscopy was used to the analysis of the chemical structure and binding features of activated carbon, oxidized activated carbon, MOF and composite (FT-IR, Brucker V33 instrument). The spectra were obtained in the range of 4000–400 cm−1, at the resolution of 4 cm−1 with 45 scans using the KBr pellet method. The morphologies of samples were also observed by scanning electron microscopy (SEM, TESCAN VEGA-XMU) using ultra-thin coating of gold (Au) with an accelerating voltage of 20 kV with 3000× magnification.
2.6 Dynamic adsorption and desorption experiments
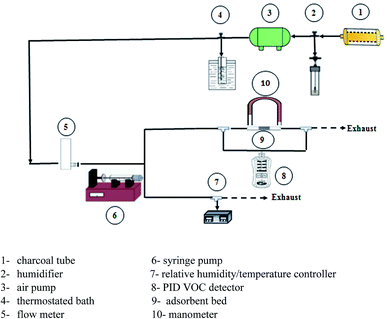
The samples were granulated and sieved between 35 and 60 meshes. On a continuous flow type fixed bed reactor, the adsorption and desorption of toluene were performed. The injection technique was used to generate vapors of a particular concentration of toluene.41Fig. 1 shows the schematic diagram of the adsorption and desorption experimental set-up. Firstly, the air produced by a pump passed through a tube containing charcoal to remove potential impurities in the air stream. The flow meter was carried out to control the airflow rate. Toluene vapor was produced by vaporizing toluene flowed out from the syringe pump at a constant rate. The adsorbent was packed in a quartz tube with a 10 mm internal diameter, 12 mm outer diameter and 150 mm long, which MCE (mixed cellulose ester membrane) filter with 37 mm size (SKC) was placed on the top of the reactor as an adsorbent holder. Before any experiment, adsorbents were heated at 110 °C for 2 h in order to remove adsorbed water from the air.
Eqn (1) presents the residence time under this condition:
 | (1) |
The residence time alters between 0.01 and 0.1 s. The influent and effluent concentrations were measured using a calibrated portable handheld VOC detector equipped with a photoionization detector (MultiRAE, made in the USA). Attention was always paid once the gas mixture was constant at upstream, the adsorption experiment might start.
A humidifier was used to provide the desired relative humidity, which was placed at the upstream. The required temperature was provided using a thermostated bath with a temperature uncertainty of 0.1 °C. The temperature and relative humidity were controlled using ETS electro-tech systems humidity and temperature controller. Breakthrough curves were used to study the activities of the adsorbents toward toluene. The time of the adsorption breakthrough point tb and equilibrium te (min) was obtained when the C/C0 reached to 0.1 and 0.5, respectively. The adsorption capacity of adsorbent (mg g−1) was as the total mass of the adsorbed toluene per unit weight of adsorbent. It was obtained using eqn (2):42,43
 | (2) |
For optimization of toluene adsorption, five parameters, including adsorbent mass, flow rate, the concentration of the sample, relative humidity and temperature, were chosen according to preliminary studies and experiments. Because of some drawbacks such as time-consuming and not considering the interaction of the important parameters in the conventional optimization techniques, such as one variable at a time, the response surface methodology (RSM) was selected to design experiments and regulate the process of adsorption. Table 1 presents the selected operational range of parameters.
| Factors | Unit | Symbol | Variable level | ||||
|---|---|---|---|---|---|---|---|
| −2 | −1 | 0 | 1 | 2 | |||
| Adsorbent mass | mg | x1 | 15 | 60 | 105 | 150 | 195 |
| Flow rate | mL min−1 | x2 | 35 | 90 | 145 | 200 | 255 |
| Adsorbate concentration | ppm | x3 | 50 | 200 | 350 | 500 | 650 |
| Relative humidity | % | x4 | 10 | 30 | 50 | 70 | 90 |
| Temperature | °C | x5 | 14 | 26 | 38 | 50 | 62 |
Central composite design (CCD) (a full factorial (2n) of orthogonal type) with 8 central and 10 axial points was used by design expert 11. According to the suggested experimental design, the effective parameters were particularly studied in two sets of 50-run experiments for adsorption of toluene onto the adsorbents. The adsorption capacity of the adsorbents was defined as the response value (y).
For assessment of the fitting of results along with the experimental conditions with the response surface models, the main, quadratic and interaction relationships between output responses and independent factors were studied using a second-order polynomial model according to the eqn (3):
 | (3) |
![[R with combining circumflex]](https://www.rsc.org/images/entities/i_char_0052_0302.gif) is the predicted response, xi is variables, b0, bi, bii, bij are the regression coefficients and ε is the statistical error.
is the predicted response, xi is variables, b0, bi, bii, bij are the regression coefficients and ε is the statistical error.
The adequacy of the response surface quadratic model was justified through the analysis of variance (ANOVA). The model F-value was considered to assess the statistical significance of the model. Statistical F-value with a low ‘P’ value demonstrates a high significance of the regression model.
R2 and adjusted R2 (the ANOVA coefficient of determination) was used to express the quality of fit for the polynomial model equation. According to the results, the two values were both close to 1, which showed a moderately high level of correlation between the actual and the predicted responses. Finally, the model can be acceptable for data when the P-value for lack of fit in the ANOVA tests is higher than 0.05.
3. Results and discussion
3.1 Characterization of Cu–BDC@OAC composite
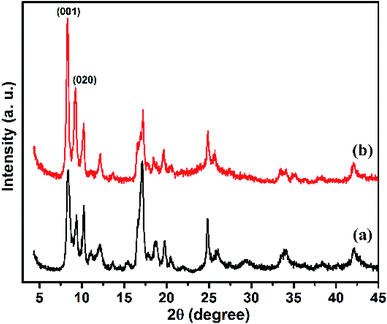
As shown in Fig. 2, the XRD patterns of Cu–BDC MOF and Cu–BDC@OAC composite are presented, comparatively. Fig. 2a represents the XRD pattern of the Cu–BDC with sharp peaks, which are consistent with the diffraction peaks centered at 2θ = 8.3° and 9.1° representing (001) and (020) planes of crystal structure respectively, match well with relevant reported in the literature.19 The high intensity of the peaks in the XRD pattern demonstrated that the good crystallization of Cu–BDC MOF was developed. Also, the characteristic peaks of Cu–BDC MOF are observed in the composite based on oxidized activated carbon, which confirms the successful formation of Cu–BDC@OAC composite. The appearance of the two main peaks at (2θ = 8.3° and 9.1°) less than 2θ = 10° in both Cu–BDC MOF and Cu–BDC@OAC indicates that the DMF solvent completely evaporated at 220 °C.44The SEM images of the as-synthesized Cu–BDC, oxidized activated carbon and Cu–BDC@OAC composite are shown in Fig. 3 respectively. The SEM image shows that the Cu–BDC MOF particles are uniform with well-formed cubic microcrystals and, which are in agreement with their XRD patterns and their average edge length is about 9.3 μm. Its morphology was compatible with the previous results that were achieved from hydrothermal synthesis.39,45 Fig. 3b shows that the oxidized activated carbon is amorphous and its particle size is below 10 μm. Comparing the SEM images of oxidized activated carbon and Cu–BDC@OAC composite (Fig. 3b and c) the successful formation of crystalline Cu–BDC on oxidized activated carbon can be observed. Furthermore, the EDS spectra and elemental analysis data (Fig. 3d) show that the Cu–BDC@OAC composite has been successfully synthesized and it is confirmed by the presence of Cu.
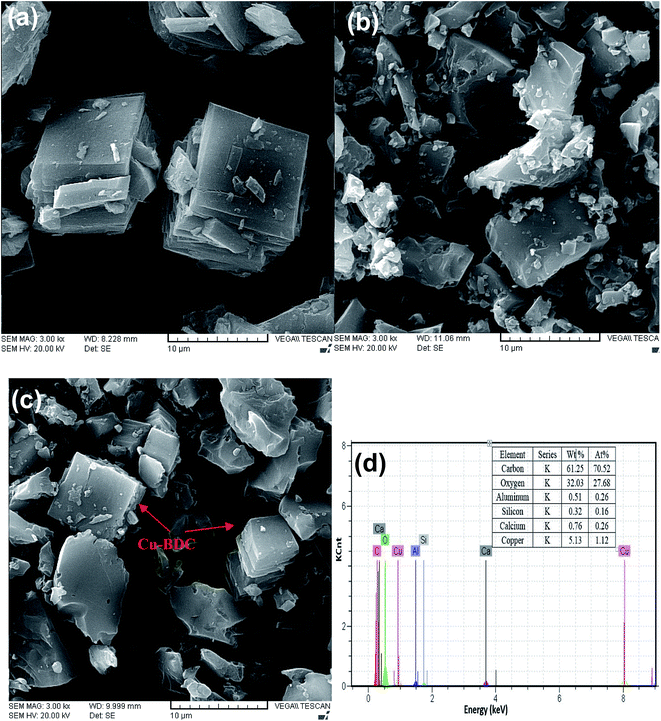 | ||
| Fig. 3 SEM images of (a) Cu–BDC, (b) oxidized activated carbon (c) Cu–BDC@OAC composite and (d) EDS spectra of Cu–BDC@OAC composite. | ||
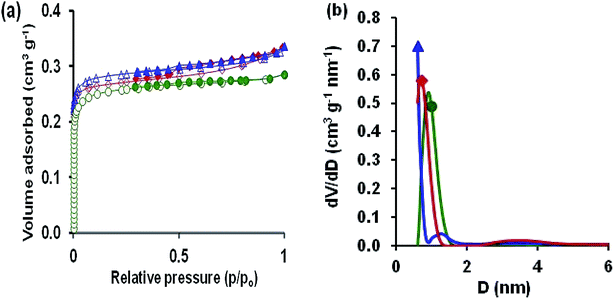
The specific textural properties of oxidized AC, Cu–BDC and Cu–BDC@OAC composite were determined by N2 adsorption–desorption measurements at −196 °C (Fig. 4a). According to the IUPAC nomenclature, the illustrated isotherm of oxidized AC was type I, which is typical for microporous materials.
The specific BET surface area obtained for the oxidized AC is 632 m2 g−1, and the total volume of pores is 0.277 cm3 g−1. Cu–BDC and Cu–BDC@OAC composite revealed the isotherm type I with H2 hysteresis, which is related to microporous materials with a BET surface area of 686 and 712 m2 g−1 respectively. In the N2 adsorption–desorption isotherms of Cu–BDC and Cu–BDC@OAC composite, there is a small hysteresis loop, which can be attributed to the H2-type hysteresis loop, indicating the presence of mesopores.46 Larger micropore volume of Cu–BDC@OAC sample leads to a higher N2 adsorption capacity at low pressures. As shown in Fig. 4a, Cu–BDC and Cu–BDC@OAC have higher N2 adsorption capacity at high pressures because of their larger Vtotal (Table 2). Also, there has been some increase in the specific surface area of Cu–BDC@OAC composite even more than pure Cu–BDC, which could be due to the synergistic action.30,37,47 Pore size distribution (PSD) demonstrates a model of solid internal structure, which shows that a similar set of non-interacting and commonly shaped model pores can indicate the complex void spaces. The PSD is nearly attributed to both kinetic and equilibrium features of porous material, and it can be the most significant factor to characterize the structural heterogeneity of porous materials. Fig. 4b shows the pore size distributions of the adsorbents derived from QSDFT. Therefore, the prepared Cu–BDC@OAC composite has mainly micropores with some mesopores. The presence of the uplift curve at diameter < 2.5 nm for Cu–BDC@OAC proves the existence of micropore structure.48 Also, the BET surface areas and different textural parameters of the samples are listed in Table 2. From this table, it can be found that introducing Cu–BDC MOF to OAC caused a significant effect on the textural features (Cu–BDC@OAC).
| Sample | SBET | SDFT | Vmicro | Vmeso | Vtotal |
|---|---|---|---|---|---|
| (m2 g−1) | (m2 g−1) | (cm3 g−1) | (cm3 g−1) | (cm3 g−1) | |
| Oxidized AC | 632 | 523 | 0.260 | 0.017 | 0.277 |
| Cu–BDC | 686 | 707 | 0.269 | 0.066 | 0.335 |
| Cu–BDC@OAC | 712 | 966 | 0.287 | 0.049 | 0.336 |
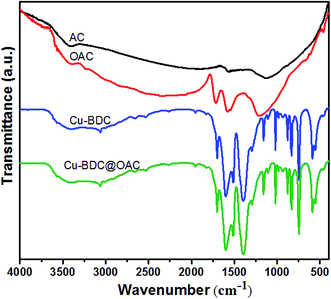
The FT-IR spectra of the activated carbon, oxidized AC, Cu–BDC and Cu–BDC@OAC composite were displayed in Fig. 5. There is a clear difference in the IR spectrum between the oxidized AC compared to the original activated carbon after the oxidation with nitric acid. Typical bands of the oxidized AC at 1716 cm−1 can be assigned to the stretching vibration from ketones, or carboxyl groups. Also, the 1577 cm−1 band belongs to the aromatic ring conjugated with C![[double bond, length as m-dash]](https://www.rsc.org/images/entities/char_e001.gif) O carbonyl groups.40 The broad peak around the 3400 cm−1 represents the carboxylic OH group. The 1185 cm−1 peak corresponded to C–O stretching vibration and OH bending mode of alcoholic, phenolic and carboxylic groups. In the as-synthesized Cu–BDC spectra, the sharp absorption peaks at 1602 and 1398 cm−1 belong to the asymmetric and symmetric stretching modes of the carboxylate groups, respectively. The bands at 1512 and 743 cm−1 are assigned to the vibrations of the phenyl ring. The vibration bands at 468 and 556 cm−1 can be considered as the stretching vibration peaks of Cu–O.39 Also, there are no solvent (DMF) absorption peaks, which is in agreement with the XRD patterns of these samples. All of the mentioned peaks of Cu–BDC are observed in the infrared spectrum of the Cu–BDC@OAC composite without shift.
O carbonyl groups.40 The broad peak around the 3400 cm−1 represents the carboxylic OH group. The 1185 cm−1 peak corresponded to C–O stretching vibration and OH bending mode of alcoholic, phenolic and carboxylic groups. In the as-synthesized Cu–BDC spectra, the sharp absorption peaks at 1602 and 1398 cm−1 belong to the asymmetric and symmetric stretching modes of the carboxylate groups, respectively. The bands at 1512 and 743 cm−1 are assigned to the vibrations of the phenyl ring. The vibration bands at 468 and 556 cm−1 can be considered as the stretching vibration peaks of Cu–O.39 Also, there are no solvent (DMF) absorption peaks, which is in agreement with the XRD patterns of these samples. All of the mentioned peaks of Cu–BDC are observed in the infrared spectrum of the Cu–BDC@OAC composite without shift.
Notably, the peak 1716 cm−1 for the oxidized AC shifts to a low wavenumber or disappears, which may be due to bond formation between Cu ions in Cu–BDC MOF and –COO groups on the oxidized AC surface.
The Boehm titration revealed that the quantities of carboxylic, lactonic and phenolic groups are, respectively, 1.7, 0.55 and 1.25 meq g−1 for oxidized AC. The surface of the original activated carbon does not contain a carboxylic group and is approximately zero. Carboxylic groups are the higher acidity, followed by phenolic groups, and then lactonic groups.
Fig. 6 depicts the schematic synthesis of Cu–BDC on the oxidized AC surface and the proposed mechanism of toluene adsorption on the Cu–BDC@OAC composite adsorbent. After the oxidation reaction on the surface of activated carbon with HNO3, the proportion of acidic functional groups, particularly the carboxylic acid (–COOH) groups, was escalated on the surface of AC (approved by Boehm titration). After adding oxidized activated carbon to well-dissolved MOF precursors, the chemical bond is formed between Cu2+ ions in MOF and –COO groups on the surface of oxidized activated carbon due to the existence of vacant coordination sites in Cu(II).49 Also, the proposed mechanism of toluene adsorption is presented in Fig. 6. Pore-filling is proposed to be an important mechanism participating in the micropore of activated carbon and Cu–BDC in the synthesized composite. Furthermore, Cu–BDC@OAC has other types of adsorption mechanisms, which include transition metal cation–π interactions, π–π stacking, donor–acceptor complexes with the C![[double bond, length as m-dash]](https://www.rsc.org/images/entities/char_e001.gif) O group (–COOH) and hydrophobic interactions from phenyl ring in the wall of the structure of MOF. Cu2+ cation could form π-complex bonds with toluene molecules, creating more active adsorption sites, which greatly enhanced the selectivity of adsorption (confirmed by the adsorption tests).50
O group (–COOH) and hydrophobic interactions from phenyl ring in the wall of the structure of MOF. Cu2+ cation could form π-complex bonds with toluene molecules, creating more active adsorption sites, which greatly enhanced the selectivity of adsorption (confirmed by the adsorption tests).50
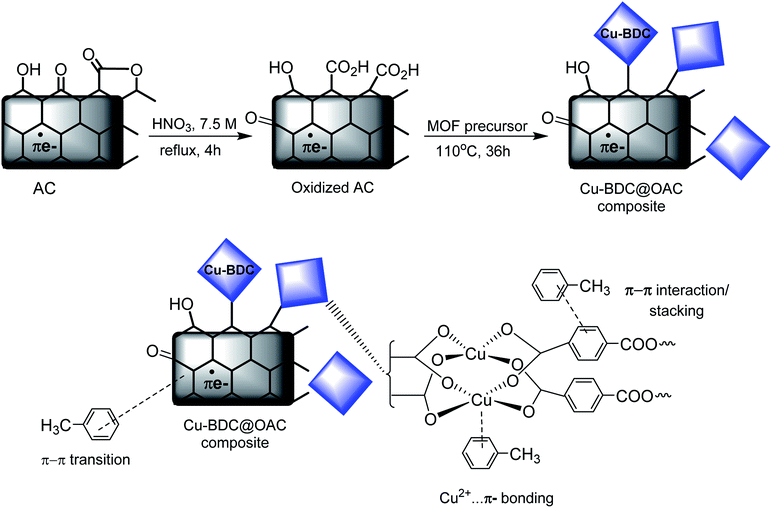 | ||
| Fig. 6 Schematic of synthesizing of Cu–BDC MOF on the oxidized AC surface and the proposed mechanism of toluene adsorption on the Cu–BDC@OAC composite adsorbent. | ||
3.2 Toluene adsorption studies
| Adsorbents | Experimental conditionsa | Toluene adsorption capacity (mg g−1) | Reference |
|---|---|---|---|
| a T = temperature (°C); RH = relative humidity (%); Q; flow rate (mL min−1); C0 = initial toluene concentration (ppm).b Copper–benzene-1,3,5-tricarboxylic acid@Zeolite Socony Mobil-5.c Amino-functionalized spherical mesoporous silica.d Crystalline porous material.e Single-walled carbon nanotube.f Activated carbon fiber. | |||
| Cu–BDC@OAC | T: 26, RH: 30, Q: 90, C0: 500 | 220.7 | This study |
| Cu-BTC@ZSM-5b | T: 25, RH: 30, Q: 180, C0: ∼345 | 158.6 | 52 |
| ASMSc | T: 35, Q: 60, C0: 2 | 98.1 | 53 |
| CPM-5d | T: 25, RH: 30, Q: 600, C0: 1 | 50 | 8 |
| SWCNT (NaOCl)e | T: 25, C0: 200 | 103.2 | 54 |
| ACFf | T: 20, C0: ∼100 | 85 | 55 |
The effects of different operational parameters for adsorption of toluene on the composite were studied separately. The effect of adsorbent mass on the adsorption capacity in order to determine the required adsorbent quantity for maximum removal of toluene was investigated and illustrated in Fig. 7a. Adsorbent mass studies were done at temperature 40 °C, flow rate 150 mL min−1 and initial concentration 350 ppm with relative humidity 50% for three different adsorbent masses (100–300–500 mg). At first glance, it is evident that the breakthrough point of the adsorbent declines with the increasing weight of the adsorbent. The adsorption capacity declined from 195 mg g−1 to 149.5 mg g−1 when the weight of the adsorbent was increased from 100 mg to 500 mg. This can be interpreted as the higher the mass of adsorbent, the greater the accessibility of the interchangeable sites or surface offered to the adsorption of toluene.28,47
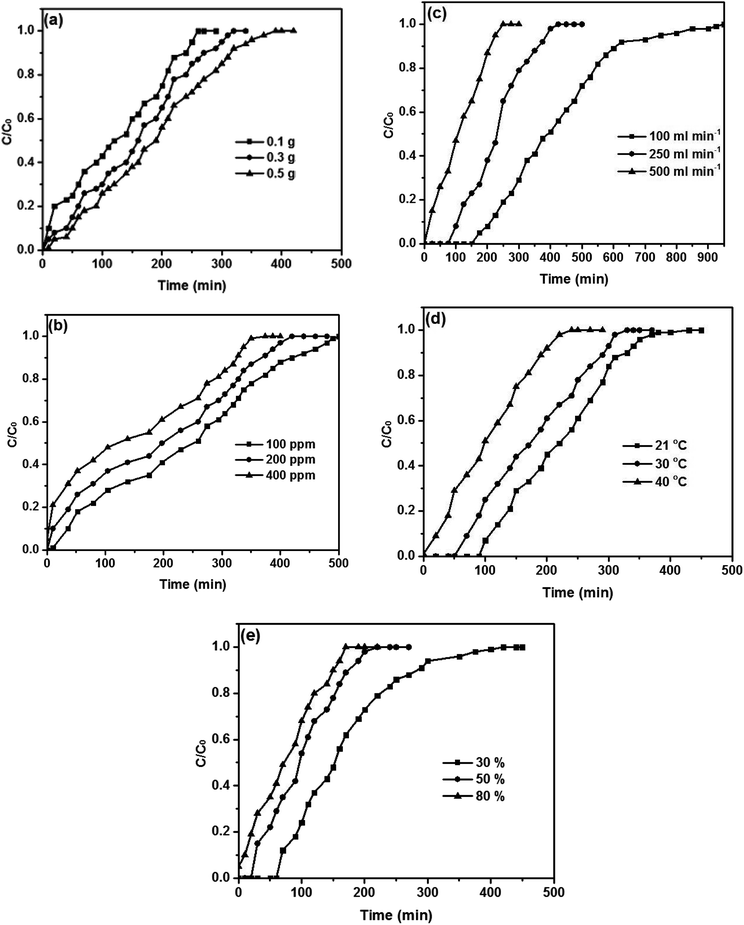 | ||
| Fig. 7 Breakthrough curves of toluene on the Cu–BDC@OAC composite at different (a) adsorbent masses, (b) concentrations, (c) flow rates, (d) temperatures and (e) relative humidity levels. | ||
The influence of the initial concentration on the adsorption capacity of the adsorbent was examined. The experiments were performed at various initial concentrations (100–200–400 ppm) at the fixed adsorbent mass of 100 mg, temperature 40 °C, flow rate 150 mL min−1 and relative humidity 50%. The adsorption capacity decreased with an increase in initial concentration (Fig. 7b). The adsorption capacity reduced from 198.9 mg g−1 to 178.6 mg g−1 when the toluene concentration was increased from 100 ppm to 400 ppm. The toluene concentration influences the diffusion of toluene molecules to the surface of adsorbent since agitation speed is constant. An increase of the toluene concentration accelerates the diffusion of toluene molecules onto the adsorbent as a result of the increase in the driving force of the concentration gradient.56,57
The effect of flow rate on the adsorption of toluene is depicted in Fig. 7c. The flow rate experiments were conducted at three different flow rates of air passing from adsorbent at a temperature of 40 °C, the relative humidity of 50% and initial concentration of 350 ppm for a constant adsorbent mass of 100 mg. The adsorption capacity of toluene was found to decline with increasing flow rate. Also, when the flow rate increased, the breakthrough curve becomes steeper. With increasing flow rate, the adsorption capacity is decreased due to the increase in the velocity of passing airstream over the composite surface; so, whether the residence time of the toluene in the reactor is not long sufficient for adsorption equilibrium to be reached at that flow rate, the toluene vapor leaves the reactor before equilibrium happens. Thence, at a higher flow rate, the contact time of toluene ions with the adsorbent is very short so that the adsorption capacity will be declined.28,58
The relationship between temperature and adsorption capacity was illustrated in Fig. 7d. The experiments were done for an initial concentration of 350 ppm at a flow rate 150 mL min−1 and relative humidity 50% with constant carbon loading of adsorbent mass of 100 mg. The results reveal that the amount of toluene adsorbed declined moderately with increasing temperature from 21 °C to 40 °C. The decrease in the adsorption capacity of toluene indicates that the significance of the physisorption mechanism between the composite and gaseous toluene.47,59
Fig. 7e illustrates the relationship between humidity and adsorption capacity. Humidity experiments were executed at temperature 40 °C, flow rate 150 mL min−1 and initial concentration 350 ppm at the fixed adsorbent mass of 100 mg for three different relative humidity ranges (30–50–80%). It is evident from Fig. 7e that the presence of relative humidity (RH) has a significant negative impact on the rate of toluene adsorption on the adsorbent, demonstrating a competitive adsorption process between toluene and water vapor. The amount of adsorption capacity declines relatively in the presence of 30% RH, and this proportion drops noticeably in the presence of 80% RH. The structure of the composite could be deformed due to interactions between hydrogens in H2O and oxygens in carboxylate, so it hindered toluene from reaching the active sites of the adsorbent.47,60,61
| Adsorption capacity (Ŷ) = 285.48816 − 0.452216X1 − 0.235563X2 − 0.029443X3 − 0.105717X4 − 1.37796X5 + 0.000156X1X2 − 0.000015X1X3 − 0.000042X1X4 + 0.001591X1X5 − 0.000034X2X3 − 0.000022X2X4 − 0.000208X2X5 − 0.000452X3X4 + 0.000291X3X5 − 0.001471X4X5 + 0.001461X12 0.000700X22 + 0.000092X32 − 0.000618X42 + 0.012702X52 | (4) |
| Run no. | Std | Type | Adsorbent mass (mg) | Flow rate (mL min−1) | Concentration (ppm) | Temperature (°C) | Relative humidity (%) | Adsorption capacity (mg g−1) | Breakthrough time (min) |
|---|---|---|---|---|---|---|---|---|---|
| 1 | 17 | Factorial | 60 | 90 | 200 | 50 | 30 | 205.38 | 36.33 |
| 2 | 16 | Factorial | 150 | 200 | 500 | 26 | 70 | 192.11 | 15.29 |
| 3 | 14 | Factorial | 150 | 90 | 500 | 26 | 70 | 196.44 | 34.75 |
| 4 | 35 | Center | 105 | 145 | 350 | 38 | 50 | 190.44 | 20.91 |
| 5 | 27 | Factorial | 60 | 200 | 200 | 50 | 70 | 187.55 | 14.93 |
| 6 | 21 | Factorial | 60 | 90 | 500 | 50 | 30 | 215.04 | 15.21 |
| 7 | 38 | Center | 105 | 145 | 350 | 38 | 50 | 190.44 | 20.91 |
| 8 | 36 | Center | 105 | 145 | 350 | 38 | 50 | 190.44 | 20.91 |
| 9 | 37 | Center | 105 | 145 | 350 | 38 | 50 | 190.44 | 20.91 |
| 10 | 12 | Factorial | 150 | 200 | 200 | 26 | 70 | 189.92 | 37.79 |
| 11 | 11 | Factorial | 60 | 200 | 200 | 26 | 70 | 197.55 | 15.72 |
| 12 | 19 | Factorial | 60 | 200 | 200 | 50 | 30 | 199.7 | 15.9 |
| 13 | 24 | Factorial | 150 | 200 | 500 | 50 | 30 | 206.66 | 16.45 |
| 14 | 15 | Factorial | 60 | 200 | 500 | 26 | 70 | 199.47 | 6.35 |
| 15 | 28 | Factorial | 150 | 200 | 200 | 50 | 70 | 184.74 | 36.76 |
| 16 | 26 | Factorial | 150 | 90 | 200 | 50 | 70 | 186.76 | 82.59 |
| 17 | 5 | Factorial | 60 | 90 | 500 | 26 | 30 | 220.79 | 15.62 |
| 18 | 34 | Center | 105 | 145 | 350 | 38 | 50 | 200.44 | 22 |
| 19 | 3 | Factorial | 60 | 200 | 200 | 26 | 30 | 208.5 | 16.6 |
| 20 | 10 | Factorial | 150 | 90 | 200 | 26 | 70 | 194.34 | 85.95 |
| 21 | 22 | Factorial | 150 | 90 | 500 | 50 | 30 | 210.56 | 37.24 |
| 22 | 4 | Factorial | 150 | 200 | 200 | 26 | 30 | 202.4 | 40.28 |
| 23 | 33 | Center | 105 | 145 | 350 | 38 | 50 | 190.44 | 20.91 |
| 24 | 18 | Factorial | 150 | 90 | 200 | 50 | 30 | 200.39 | 88.62 |
| 25 | 2 | Factorial | 150 | 90 | 200 | 26 | 30 | 204.11 | 90.27 |
| 26 | 7 | Factorial | 60 | 200 | 500 | 26 | 30 | 215.4 | 6.86 |
| 27 | 29 | Factorial | 60 | 90 | 500 | 50 | 70 | 197.33 | 13.42 |
| 28 | 8 | Factorial | 150 | 200 | 500 | 26 | 30 | 209.49 | 16.67 |
| 29 | 1 | Factorial | 60 | 90 | 200 | 26 | 30 | 211.63 | 37.44 |
| 30 | 6 | Factorial | 150 | 90 | 500 | 26 | 30 | 213.46 | 37.76 |
| 31 | 13 | Factorial | 60 | 90 | 500 | 26 | 70 | 203.24 | 14.38 |
| 32 | 9 | Factorial | 60 | 90 | 200 | 26 | 70 | 201.06 | 35.56 |
| 33 | 20 | Factorial | 150 | 200 | 200 | 50 | 30 | 197.76 | 39.35 |
| 34 | 30 | Factorial | 150 | 90 | 500 | 50 | 70 | 192.95 | 34.13 |
| 35 | 32 | Factorial | 150 | 200 | 500 | 50 | 70 | 189.67 | 15.09 |
| 36 | 31 | Factorial | 60 | 200 | 500 | 50 | 70 | 190.62 | 6.07 |
| 37 | 25 | Factorial | 60 | 90 | 200 | 50 | 70 | 192.33 | 34.02 |
| 38 | 23 | Factorial | 60 | 200 | 500 | 50 | 30 | 209.41 | 6.66 |
| 39 | 46 | Axial | 105 | 145 | 350 | 38 | 90 | 175.61 | 19.28 |
| 40 | 40 | Axial | 195 | 145 | 350 | 38 | 50 | 201.87 | 41.16 |
| 41 | 41 | Axial | 105 | 35 | 350 | 38 | 50 | 208.52 | 94.86 |
| 42 | 44 | Axial | 105 | 145 | 650 | 38 | 50 | 209.23 | 12.37 |
| 43 | 45 | Axial | 105 | 145 | 350 | 38 | 10 | 213.95 | 23.49 |
| 44 | 49 | Center | 105 | 145 | 350 | 38 | 50 | 195.79 | 21.49 |
| 45 | 48 | Axial | 105 | 145 | 350 | 62 | 50 | 196.64 | 21.59 |
| 46 | 50 | Center | 105 | 145 | 350 | 38 | 50 | 195.79 | 21.49 |
| 47 | 47 | Axial | 105 | 145 | 350 | 14 | 50 | 209.53 | 23 |
| 48 | 39 | Axial | 15 | 145 | 350 | 38 | 50 | 213.34 | 3.34 |
| 49 | 43 | Axial | 105 | 145 | 50 | 38 | 50 | 174.83 | 152.83 |
| 50 | 42 | Axial | 105 | 255 | 350 | 38 | 50 | 199.96 | 12.48 |
| Source | Sum of squares | Degrees of freedom | Mean square | F value | P value |
|---|---|---|---|---|---|
| a R2 = 0.9717; adjusted R2 = 0.9514; predicted R2 = 0.9260. | |||||
| Model | 4332.60 | 20 | 216.63 | 48.01 | <0.0001 |
| X1 | 281.85 | 1 | 281.85 | 62.46 | <0.0001 |
| X2 | 168.02 | 1 | 168.02 | 37.23 | <0.0001 |
| X3 | 355.93 | 1 | 355.93 | 78.88 | <0.0001 |
| X4 | 2422.38 | 1 | 2422.38 | 536.83 | <0.0001 |
| X5 | 353.07 | 1 | 353.07 | 78.25 | <0.0001 |
| X1X2 | 4.76 | 1 | 4.76 | 1.05 | 0.3132 |
| X1X3 | 0.3444 | 1 | 0.3444 | 0.0763 | 0.7844 |
| X1X4 | 0.0450 | 1 | 0.0450 | 0.0100 | 0.9212 |
| X1X5 | 4 | 1 | 23.63 | 5.24 | 0.0299 |
| X2X3 | 2.59 | 1 | 2.59 | 0.5735 | 0.4552 |
| X2X4 | 0.0190 | 1 | 0.0190 | 0.0042 | 0.9487 |
| X2X5 | 0.6050 | 1 | 0.6050 | 0.1341 | 0.7170 |
| X3X4 | 58.75 | 1 | 58.75 | 13.02 | 0.0012 |
| X3X5 | 8.76 | 1 | 8.76 | 1.94 | 0.1746 |
| X4X5 | 3.99 | 1 | 3.99 | 0.8843 | 0.3551 |
| X12 | 277.64 | 1 | 277.64 | 61.53 | <0.0001 |
| X22 | 142.22 | 1 | 142.22 | 31.52 | <0.0001 |
| X32 | 135.25 | 1 | 135.25 | 29.97 | <0.0001 |
| X42 | 1.94 | 1 | 1.94 | 0.4294 | 0.5176 |
| X52 | 106.08 | 1 | 106.08 | 23.51 | <0.0001 |
| Residuals | 126.35 | 28 | 4.51 | — | — |
| Lack of fit | 43.01 | 22 | 1.96 | 0.1408 | 0.9997 |
| Pure error | 83.33 | 6 | 13.89 | — | — |
R2 = 0.9717, which is for eqn (4), demonstrates that almost 2.83% of the whole alterations were not adequately explained by the model. From Table 5, it is immediately apparent that the statistical F value of the model was high. This great value represents that the adsorption capacity can be acceptably explained by the model. The residual error is the unexplained part of the model (4.51), which is presented in Table 5. It was seen that the linear effects of all the factors were significant (P < 0.001) and the coefficient of X12, X22, X32 and X52 were considerably significant (P < 0.001) in comparison with the interaction terms X1X5 (P = 0.0299) and X3X4 (P = 0.0012). The most important term on the adsorption capacity was X4 with F-value 536.83.
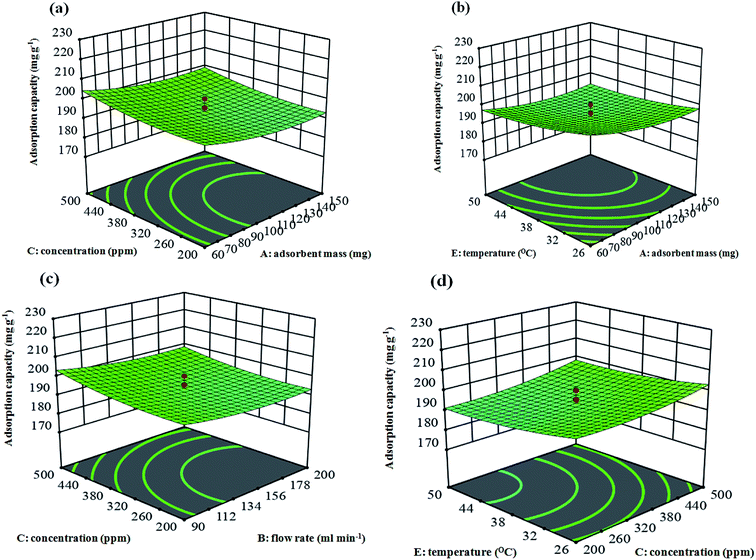
The behavior of the response surface models can be shown using graphical representations of the parameter dependencies, such as 3D response plots, where the interaction influence of the parameters have been mapped against the response factors. The adsorption capacities of the adsorbent (the Cu–BDC@OAC) over the various mixtures of independent parameters were therefore shown through plots (Fig. 8a–d). In this way, the plots were illustrated as a function of two parameters at a time, maintaining other variables at a fixed state. The response surfaces at low and high levels of the parameters lead to minimal capacity of the adsorbent. The results show that there is an area where neither an increasing nor a decreasing trend in the adsorption capacity is observed. This trend demonstrates an optimum point for the adsorption parameters to enhance the adsorption capacity. Additionally, it is worth noting that there was a moderate interaction between the adsorbent mass and temperature (X1 and X5) (P = 0.0299) and concentration and relative humidity (X3 and X4) (P = 0.0012) on the toluene adsorption (Fig. 8b).
Several optimum points were suggested, including the factors along with the predicted response value using the CCD via model confirmation (Table 6). The experimental findings were in good agreement with the predicted results because there was a negligible error between predicted and experimental results, and “desirability” values were attained up to 100%, indicating the great closeness of response (y) to their ideal values. So, the model for the optimization of toluene adsorption over the adsorbent in this survey obtained high compatibility and hence could be applied to design and optimize the experimental conditions.62
| Solution no. | Adsorbent mass (mg) | Concentration (ppm) | Flow rate (mL min−1) | Temperature (°C) | Relative humidity (%) | Adsorption capacity (mg g−1) | Desirability | |
|---|---|---|---|---|---|---|---|---|
| Predicted | Experimental | |||||||
| 1 | 60.000 | 500.000 | 90.000 | 26.000 | 30.000 | 222.811 | 220.79 | 1.000 |
| 2 | 61.885 | 494.524 | 90.064 | 26.450 | 30.391 | 221.709 | 219.60 | 1.000 |
| 3 | 62.336 | 486.535 | 90.950 | 26.025 | 30.170 | 221.405 | 219.33 | 1.000 |
| 4 | 60.099 | 499.773 | 90.150 | 26.123 | 33.753 | 221.140 | 219.17 | 1.000 |
| 5 | 60.011 | 465.943 | 90.051 | 26.008 | 30.024 | 221.050 | 218.82 | 1.000 |
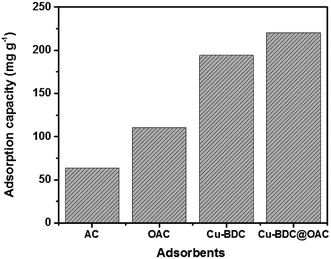
The obtained highest adsorption capacities (mg g−1) of gaseous toluene over activated carbon (AC), oxidized activated carbon (OAC), Cu–BDC and the Cu–BDC@OAC composite in the optimized process conditions were depicted in Fig. 9. It is clearly shown that the Cu–BDC@OAC composite has the highest adsorption capacity in comparison with the rest. In previous surveys, Bingman Lei et al. did a comparative study about the adsorption capacity of CuO-modified activated carbon for the improvement of toluene removal from air. The adsorption capacity of CuO/AC composite was better than for AC (1.2–1.9-fold higher than those of AC). The equilibrium adsorption capacity of CuO/AC 0.3 wt% composite (AC03) was 701.8 mg g−1.27 Zhang et al., reported the adsorption capacities of UiO-66, CTAB-U-0.3, CTAB-U-0.5 and CTAB-U-1 were 151, 177, 275 and 204 mg g−1,47 respectively.
4. Conclusions
In summary, the microporous Cu–BDC@OAC composite was synthesized by in situ incorporation of the Cu–BDC MOF to oxidized activated carbon with terminal –COOH groups. Characterization of this adsorbent showed the larger specific surface area (712 m2 g−1) than that of Cu–BDC MOF and oxidized AC, respectively. Dispersed Cu–O bonds combined with hydrophobic phenyl groups and oxygen-containing functional groups of oxidized AC lead to enhance the surface affinity to toluene and prepare more active adsorption sites. The pore structure of adsorbents was identified to play an important role in the adsorption features of toluene. Micropores appeared a positive effect on the adsorption of toluene. Optimization based on the statistical design of experiments was shown to be a useful tool for predicting and investigating the interaction effects of experimental factors. RSM and the CCD were proper for determining the optimal conditions for toluene adsorption onto the Cu–BDC@OAC composite. An adsorbent mass of 60 mg, a flow rate of 90 mL min−1, a concentration of 500 ppm, relative humidity of 30% and a temperature of 26 °C were found to be the optimized process conditions. The maximum adsorption capacity of toluene onto Cu–BDC@OAC composite was 222.811 mg g−1, which increased by almost 12% and 50% compared with pure Cu–BDC and oxidized AC, respectively. The regeneration of the composite was still up to 78% after three consecutive adsorption–desorption cycles. The higher adsorption capacity and reusability make the microporous Cu–BDC@OAC composite a superior VOCs adsorbent.Conflicts of interest
The authors state that there is no conflict of interest in this study.Acknowledgements
We gratefully acknowledge Professor Eugenia (Éva) Valsami-Jones, a full Professor at School of Geography, Earth and Environmental Sciences, University of Birmingham, UK, for her valuable comments to improve the paper. This work is financially supported by the Tehran University of Medical Sciences under the PhD thesis scheme (Number: 9421138001) and the INSF, Iran National Science Foundation (grant no. 97025376).References
- A. Berenjian, N. Chan and H. J. Malmiri, Am. J. Biochem. Biotechnol., 2012, 8, 220–229 CrossRef CAS.
- A. Amari, A. Gannouni, M. Chlendi and A. Bellagi, Can. J. Chem. Eng., 2008, 86, 1093–1102 CrossRef CAS.
- M. Lillo-Ródenas, D. Cazorla-Amorós and A. Linares-Solano, Carbon, 2005, 43, 1758–1767 CrossRef.
- J. L. Cadet and K. I. Bolla, Neurol. Clin. Neurosci., Elsevier, 2007, pp. 1477–1488 Search PubMed.
- T. J. Eicher, Clinical Neurotoxicology E-Book: Syndromes, Substances, Environments, 2009, vol. 69 Search PubMed.
- I. Bolla and J. L. Cadet, in Textbook of Clinical Neurology, Elsevier Inc., 3rd edn, 2007 Search PubMed.
- W. J. Mills, B. J. Grigg, F. J. Offermann, B. E. Gustin and N. E. Spingarn, J. Occup. Environ. Hyg., 2012, 9, 95–102 CrossRef.
- M. Bahri, F. Haghighat, H. Kazemian and S. Rohani, Chem. Eng. J., 2017, 313, 711–723 CrossRef CAS.
- S. Jafari, F. Ghorbani-Shahna, A. Bahrami and H. Kazemian, Microporous Mesoporous Mater., 2018, 268, 58–68 CrossRef CAS.
- J. S. Devinny, M. A. Deshusses and T. S. Webster, Biofiltration for air pollution control, CRC Press, 2017 Search PubMed.
- R. Iranpour, H. H. Cox, M. A. Deshusses and E. D. Schroeder, Environ. Prog., 2005, 24, 254–267 CrossRef CAS.
- Y. Jianming, L. Wei, C. Zhuowei, J. Yifeng, C. Wenji and C. Jianmeng, J. Hazard. Mater., 2014, 268, 14–22 CrossRef.
- Z. Shareefdeen, Biotechnology for odor and air pollution control, Springer Science & Business Media, 2005 Search PubMed.
- C. Kennes, E. R. Rene and M. C. Veiga, J. Chem. Technol. Biotechnol., 2009, 84, 1419–1436 CrossRef CAS.
- M. Zang, C. Zhao, Y. Wang, X. Liu, Y. Cheng and S. Chen, Appl. Surf. Sci., 2019, 483, 355–362 CrossRef CAS.
- F.-J. Ma, S.-X. Liu, D.-D. Liang, G.-J. Ren, F. Wei, Y.-G. Chen and Z.-M. Su, J. Solid State Chem., 2011, 184, 3034–3039 CrossRef CAS.
- Y. Zhou, L. Zhou, X. Zhang and Y. Chen, Microporous Mesoporous Mater., 2016, 225, 488–493 CrossRef CAS.
- Y.-J. Lee, Y.-J. Chang, D.-J. Lee and J.-P. Hsu, J. Taiwan Inst. Chem. Eng., 2018, 93, 176–183 CrossRef CAS.
- N. E. Tari, A. Tadjarodi, J. Tamnanloo and S. Fatemi, J. Porous Mater., 2015, 22, 1161–1169 CrossRef CAS.
- L. Zhu, X. Jia, H. Bian, T. Huo, Z. Duan, Y. Xiang and D. Xia, New J. Chem., 2018, 42, 3840–3850 RSC.
- X.-W. Liu, T.-J. Sun, J.-L. Hu and S.-D. Wang, J. Mater. Chem. A, 2016, 4, 3584–3616 RSC.
- O. Duman and E. Ayranci, Sep. Sci. Technol., 2006, 41, 3673–3692 CrossRef CAS.
- E. Ayranci and O. Duman, Chem. Eng. J., 2010, 156, 70–76 CrossRef CAS.
- O. Duman and E. Ayranci, J. Hazard. Mater., 2010, 176, 231–238 CrossRef CAS.
- O. Duman, S. Tunc and T. G. Polat, Microporous Mesoporous Mater., 2015, 210, 176–184 CrossRef CAS.
- G. Hotová, V. Slovák, O. S. Soares, J. L. Figueiredo and M. F. Pereira, Carbon, 2018, 134, 255–263 CrossRef.
- B. Lei, B. Liu, H. Zhang, L. Yan, H. Xie and G. Zhou, J. Environ. Sci., 2020, 88, 122–132 CrossRef.
- H. Kalavathy, I. Regupathi, M. G. Pillai and L. R. Miranda, Colloids Surf., B, 2009, 70, 35–45 CrossRef.
- A. Yaumi, M. A. Bakar and B. Hameed, Energy, 2018, 155, 46–55 CrossRef CAS.
- M. A. Ahsan, V. Jabbari, M. T. Islam, R. S. Turley, N. Dominguez, H. Kim, E. Castro, J. A. Hernandez-Viezcas, M. L. Curry and J. Lopez, Sci. Total Environ., 2019, 673, 306–317 CrossRef CAS.
- Y. Li, J. Miao, X. Sun, J. Xiao, Y. Li, H. Wang, Q. Xia and Z. Li, Chem. Eng. J., 2016, 298, 191–197 CrossRef CAS.
- O. R. Heravizadeh, M. Khadem, R. Nabizadeh and S. J. Shahtaheri, Chem. Pap., 2018, 72, 3057–3068 CrossRef CAS.
- M. Arulkumar, P. Sathishkumar and T. Palvannan, J. Hazard. Mater., 2011, 186, 827–834 CrossRef CAS.
- J. Goel, K. Kadirvelu, C. Rajagopal and V. Garg, Carbon, 2005, 1, 197–200 CrossRef.
- S. Biniak, G. Szymański, J. Siedlewski and A. Światkowski, Carbon, 1997, 35, 1799–1810 CrossRef CAS.
- X. Zhao, X. Zeng, Y. Qin, X. Li, T. Zhu and X. Tang, Chemosphere, 2018, 206, 285–292 CrossRef CAS.
- R. S. Kumar, M. Raja, M. A. Kulandainathan and A. M. Stephan, RSC Adv., 2014, 4, 26171–26175 RSC.
- M. Z. Alam, S. A. Muyibi and J. Toramae, J. Environ. Sci., 2007, 19, 674–677 CrossRef CAS.
- H. Kakaei, M. Beygzadeh, F. Golbabaei, M. R. Ganjali, M. Jahangiri and S. J. Shahtaheri, New J. Chem., 2019, 43, 11575–11584 RSC.
- Y. Jia and K. Thomas, Langmuir, 2000, 16, 1114–1122 CrossRef CAS.
- Y. Li, T. Täffner, M. Bischoff and B. Niemeyer, Int. J. Chem. Eng., 2012, 2012, 1–6 CrossRef.
- H. Zaitan, M. H. Manero and H. Valdés, J. Environ. Sci., 2016, 41, 59–68 CrossRef CAS.
- Q. Hu, J. J. Li, Z. P. Hao, L. D. Li and S. Z. Qiao, Chem. Eng. J., 2009, 149, 281–288 CrossRef CAS.
- C. G. Carson, K. Hardcastle, J. Schwartz, X. Liu, C. Hoffmann, R. A. Gerhardt and R. Tannenbaum, Eur. J. Inorg. Chem., 2009, 16, 2338–2343 CrossRef.
- K. Huang, Y. Xu, L. Wang and D. Wu, RSC Adv., 2015, 5, 32795–32803 RSC.
- Y.-J. Li, Y.-L. Wang and Q.-Y. Liu, Inorg. Chem., 2017, 56, 2159–2164 CrossRef CAS.
- X. Zhang, Y. Yang, L. Song, J. Chen, Y. Yang and Y. Wang, J. Hazard. Mater., 2019, 365, 597–605 CrossRef CAS.
- W. Zhang, Z. Qu, X. Li, Y. Wang, D. Ma and J. Wu, J. Environ. Sci., 2012, 24, 520–528 CrossRef CAS.
- E. Biemmi, C. Scherb and T. Bein, J. Am. Chem. Soc., 2007, 129, 8054–8055 CrossRef CAS.
- M. Wen, G. Li, H. Liu, J. Chen, T. An and H. Yamashita, Environ. Sci.: Nano, 2019, 6, 1006–1025 RSC.
- H. Mao, D. Zhou, Z. Hashisho, S. Wang, H. Chen, H. H. Wang and M. J. Lashaki, RSC Adv., 2015, 5, 36051–36058 RSC.
- M. Li, Y. Li, W. Li, F. Liu, X. Qi, M. Xue, Y. Wang and C. Zhao, Environ. Sci. Pollut. Res., 2019, 1–14 Search PubMed.
- H. Zhou, S. Gao, W. Zhang, Z. An and D. Chen, RSC Adv., 2019, 9, 7196–7202 RSC.
- W. Chen, L. Duan and D. Zhu, Environ. Sci. Technol., 2007, 41, 8295–8300 CrossRef CAS.
- C. L. Mangun, Z. Yue, J. Economy, S. Maloney, P. Kemme and D. Cropek, Chem. Mater., 2001, 13, 2356–2360 CrossRef CAS.
- K.-J. Kim, C.-S. Kang, Y.-J. You, M.-C. Chung, M.-W. Woo, W.-J. Jeong, N.-C. Park and H.-G. Ahn, Catal. Today, 2006, 111, 223–228 CrossRef CAS.
- M. Özacar and İ. A. Şengil, Bioresour. Technol., 2005, 96, 791–795 CrossRef.
- S. Ghorai and K. Pant, Chem. Eng. J., 2004, 98, 165–173 CrossRef CAS.
- I. Ahmed and S. H. Jhung, J. Hazard. Mater., 2015, 283, 544–550 CrossRef CAS.
- Z. Zhao, S. Wang, Y. Yang, X. Li, J. Li and Z. Li, Chem. Eng. J., 2015, 259, 79–89 CrossRef CAS.
- N. A. Khan and S. H. Jhung, J. Hazard. Mater., 2017, 325, 198–213 CrossRef CAS.
- M. A. Bezerra, R. E. Santelli, E. P. Oliveira, L. S. Villar and L. A. Escaleira, Talanta, 2008, 76, 965–977 CrossRef CAS.
| This journal is © The Royal Society of Chemistry 2020 |

