 Open Access Article
Creative Commons Attribution 3.0 Unported Licence
Thermal property and structural molecular dynamics of organic–inorganic hybrid perovskite 1,4-butanediammonium tetrachlorocuprate †
Ma Byong Yoona,
Won Jun Leeb and
Ae Ran Lim *ac
*ac
aDepartment of Science Education, Jeonju University, Jeonju 55069, Korea. E-mail: aeranlim@hanmail.net; arlim@jj.ac.kr
bDepartment of Polymer Science and Engineering, Kumoh National Institute of Technology, Gumi 39177, Korea
cAnalytical Laboratory of Advanced Ferroelectric Crystals, Jeonju University, Jeonju 55069, Korea
First published on 21st September 2020
Abstract
We investigate the thermal behaviour and physical properties of the crystals of the organic inorganic hybrid perovskite [(NH3)(CH2)4(NH3)]CuCl4. The compound's thermal stability curve as per thermogravimetric analysis exhibits a stable state up to ∼495 K, while the weight loss observed near 538 K corresponds to partial thermal decomposition. The 1H nuclear magnetic resonance (NMR) chemical shifts for NH3 change more significantly with temperature than those for CH2, because the organic cation motion is enhanced at both ends of the organic chain. The 13C NMR chemical shifts for the ‘CH2-1’ units of the chain show an anomalous change, and those for ‘CH2-2’ (units closer to NH3) are shifted sharply. Additionally, the 14N NMR spectra reflect the changes of local symmetry near TC (=323 K). Moreover, the 13C T1ρ values for CH2-2 are smaller than those for CH2-1, and the 13C T1ρ data curve for CH2-1 exhibits an anomalous behaviour between 260 and 310 K. These smaller T1ρ values at lower temperatures indicate that 1H and 13C in the organic chains are more flexible at these temperatures. The NH3 group is attached to both ends of the organic chain, and NH3 forms a N–H⋯Cl hydrogen bond with the Cl ion of inorganic CuCl4. When H and C are located close to the paramagnetic Cu2+ ion, the T1ρ value is smaller than when these are located far from the paramagnetic ion.
I. Introduction
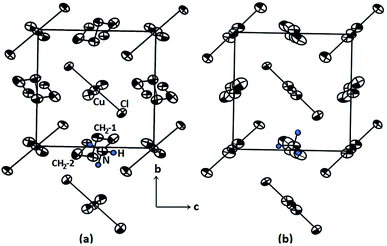
The search for new and improved functional materials in recent years has resulted in considerable progress in the synthesis of many families of organic–inorganic compounds. The properties and structural phase transition of these compounds are related to their structures and the interaction of the cationic units with complex anionic sublattices. One such group of hybrid compounds, whose structure can be expressed by the general formula [NH3(CH2)4NH3]MX4 (M = divalent metal ion and X = Cl, Br) is known to crystallise in a 2D perovskite-like structure, and these compounds are usually referred to as organic–inorganic hybrid perovskites or organic–metal-halide composites.1–6 These perovskites combine the advantages of both organic and inorganic materials in a single molecular scale.1,7,8 In particular, in the diammonium hybrid perovskite with its formula of [NH3(CH2)4NH3]MX4, the NH3 group is attached to both ends of the organic chain.3,7,8 At the end of the organic part of the chain, the ammonium ion forms a N–H⋯X hydrogen bond with the halide ion of the metallic inorganic layer.9 These perovskite hybrids tend to exhibit a number of phase transitions such as order-disorder transitions. Here, we note that the properties of organic–inorganic hybrid perovskites depend on the organic cation, divalent metal, and halogen ion, and thus, it is necessary to investigate the ‘structure-directing’ properties of these new materials. In general, 2D hybrid perovskites can find use in the fields of energy, optoelectronics, photonics, and catalysis in green chemistry applications.9–13The compound [(NH3)(CH2)4(NH3)]CuCl4, or 1,4-butanediammonium tetrachlorocuprate, with M = Cu and X = Cl, undergoes a reversible phase transition at 325 K (=TC)14 between the two monoclinic phases II and I. The transition can be explained by order-disorder mechanisms involving a model of twisted conformation chains, which was introduced to explain the decrease in interlayer distance with increasing temperature from X-ray diffraction experiment. From structural considerations, these results can be explained by the conformational change of organic chains from the left-handed conformation in phase II to an all-trans conformation in phase I.14 The structural geometry of [(NH3)(CH2)4(NH3)]CuCl4 in the room-temperature phase II and high-temperature phase I are represented in Fig. 1(a) and (b), respectively. The crystal structure at room temperature is monoclinic, corresponding to space group P21/c. The unit cell dimensions are a = 9.270 Å, b = 7.600 Å, c = 7.592 Å, β = 103.14°, and Z = 2.14,15 Structural cohesion is achieved via N–H⋯Cl hydrogen bonds. [(NH3) (CH2)4(NH3)]CuCl4 is composed of alternating inorganic CuCl42− layers and organic [NH3(CH2)4NH3]2+ sheets. The CuCl42− layers are sandwiched by [NH3(CH2)4NH3]2+ cations, which possess centrosymmetrical chains with left-handed conformations at both ends, thereby forming the organic sheets. Above 325 K, the symmetry changes to that of a monoclinic structure with space group P21/c, and the corresponding lattice constants are a = 10.420 Å, b = 7.442 Å, c = 7.225 Å, β = 93.46°, and Z = 2.15
In the context of the property measurements of such compounds, Snively et al. conducted magnetic susceptibility measurements of [(NH3)(CH2)4(NH3)]CuCl4 powdered and single-crystals in the temperature range of 4 to 200 K.16,17 They reported that the interplanar superexchange interaction along the linear Cu–Cl–Cl–Cu path exhibits a significantly stronger Cu–Cu-distance dependence than that along the Cu–Cl–Cu path. This crystal structure has been reported in phases I and II by Garland et al.18 Subsequently, the phase transitions occurring in the perovskite-type 2D molecular composite [(NH3)(CH2)4(NH3)]CuCl4 have been studied by means of differential scanning calorimetry (DSC), X-ray diffraction (XRD),11 and electron paramagnetic resonance (EPR).14,19,20
Understanding the structural dynamics of organic–inorganic hybrid perovskite [(NH3)(CH2)4(NH3)]CuCl4 is essential for their advanced use as new materials. Here, we study the structural dynamics of the organic–inorganic hybrid perovskite [(NH3) (CH2)4(NH3)]CuCl4 via magic angle spinning (MAS) nuclear magnetic resonance (NMR) and static NMR experiments. The chemical shifts and spin–lattice relaxation times in the rotating frame T1ρ in the low- and high-temperature phases are measured by means of MAS 1H NMR and cross-polarisation (CP)/MAS 13C NMR to understand the role of the organic cation in this crystal. The 14N NMR spectra of the compound in the laboratory frame are also obtained as a function of temperature. We use these results to discuss the structural dynamics of the NH3–CH2–CH2–CH2–CH2–NH3 chain below and above the phase transition temperature TC. In particular, an examination of the hydrogen bonding of N–H⋯Cl between the Cu–Cl layer and the alkylammonium chain within [(NH3)(CH2)4(NH3)]CuCl4 can provide important insights into the operational mechanism as regards potential applications.
II. Experimental method
Crystals of [(NH3)(CH2)4(NH3)]CuCl4 were prepared by mixing equimolar amounts of NH2(CH2)4NH2·2HCl and CuCl2 in aqueous solution and allowing the resulting mixture to slowly evaporate. The light-green-coloured crystals grew as rectangular parallelepipeds with dimensions of 5 mm × 5 mm × 1 mm.The crystal structure of [(NH3)(CH2)4(NH3)]CuCl4 was determined with a X-ray diffraction system, using a Cu-Kα radiation source at the KBSI, Seoul Western Center. DSC (TA, DSC 25) experiments were carried out at a heating rate of 10°C min−1 in the temperature range of 190 to 600 K in a nitrogen-gas atmosphere. Thermogravimetry analysis (TGA) experiments were conducted using a thermogravimetric analyser (TA Instruments) under conditions identical to those of DSC over a temperature range of 300 to 680 K. The DSC and TGA experiments were performed by using crystal sample quantities of 6.23 and 7.53 mg, respectively.
Solid-state MAS NMR investigations of the [(NH3)(CH2)4(NH3)]CuCl4 crystals were conducted by using a 400 MHz Avance II+ Bruker NMR spectrometer at the same facility. The MAS 1H NMR and CP/MAS 13C NMR experiments were performed at the Larmor frequencies of ω0/2π = 400.13 and 100.61 MHz, respectively. Solid samples were packed into 4 mm-diameter zirconia rotors and closed off using Vespel caps. The samples were spun at 10 kHz MAS by using dry nitrogen gas. The 1H and 13C NMR chemical shifts were obtained with the use of tetramethylsilane (TMS) as a standard. The T1ρ data for 1H and 13C were obtained by applying a π/2 pulse, immediately followed by a long spin-locking pulse phase-shifted by π/2 with respect to the π/2 pulse. The width of the π/2 pulse used for T1ρ measurements was 3.3 μs, which yields the frequency of the rotating frame as ω1 = 75.75 kHz. The T1ρ data were obtained by varying the length of the spin-locking pulse. In addition, the 14N NMR spectra of a [(NH3)(CH2)4(NH3)]CuCl4 single-crystal were obtained at the Larmor frequency of ω0/2π = 28.90 MHz in the laboratory frame. The 14N resonance frequency was referenced with NH3NO3 as the standard sample. The 14N NMR spectrum was obtained by the application of the following solid-state echo sequence: 8 μs–tau (16 μs)–8 μs–tau (16 μs). The temperature change was maintained within the error range of ±0.5 K by adjusting the nitrogen gas flow and heater current.
III. Results and discussion
The powder X-ray diffraction pattern of [(NH3)(CH2)4(NH3)]CuCl4 at 300 K is described in the ESI,† and this data is consistent with previously reported results.14 Fig. 2 shows the DSC curve of the [(NH3)(CH2)4(NH3)]CuCl4 crystals obtained with the heating rate of 10°C min−1. An endothermic signal corresponding to the previously reported14 II–I phase transition is detected at 323 K. In addition, a very large exothermic peak is observed at 538 K. To understand the origins of this peak, we performed TGA experiments; these results are also shown in Fig. 2. In the TGA curve, a stable state is observed up to ∼495 K, whereas a weight loss is observed at higher temperatures, which represents partial thermal decomposition. Here, we note that [(NH3)(CH2)4(NH3)]CuCl4 crystals show the weight loss with temperature increase. From the TGA experimental results and possible chemical reactions, we compared the weight loss. The weight loss of 12% around 538 K obtained from the DSC experiment is consistent with the calculated decomposition of HCl moieties. From the figure, we note that the weight sharply decreases between 500 and 650 K, with a corresponding weight loss of 67% near 650 K.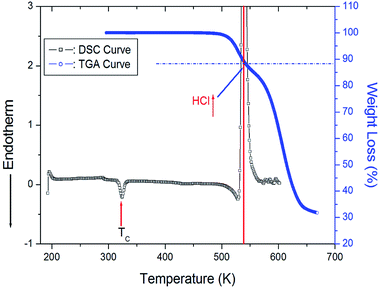 | ||
| Fig. 2 Differential Scanning Calorimetry (DSC) and thermogravimetric analysis (TGA) curves of [(NH3)(CH2)4(NH3)]CuCl4. | ||
Next, we acquired the MAS 1H NMR spectrum of the [(NH3)(CH2)4(NH3)]CuCl4 crystals at various temperatures (Fig. 3). In the figure, we can observe two resonance signals for 1H. The spinning sidebands corresponding to CH2 are indicated by open circles, and those of NH3 are indicated by crosses. At 300 K, the 1H NMR chemical shifts for CH2 and NH3 are observed at δ = 2.73 ppm and δ = 11.86 ppm, respectively. Below 300 K, the 1H resonance signal bonded to CH2 mostly merges with the 1H resonance signal bonded to NH3, which makes it difficult to distinguish the two signals. In addition, the 1H resonance signal for CH2 is related to the number of bonded protons, which means that the signal exhibits a stronger intensity and wider linewidth than the corresponding ones for NH3. The 1H NMR chemical shifts according to the temperature exhibit a greater change for NH3 than CH2. These results indicate that NH3 is temperature-sensitive.
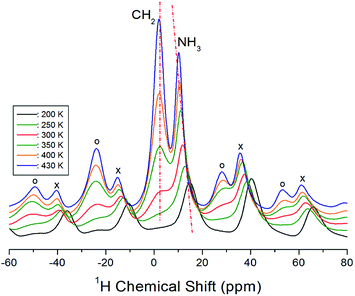 | ||
| Fig. 3 MAS 1H NMR spectra for CH2 and NH3 of [(NH3)(CH2)4(NH3)]CuCl4 at various temperatures (spinning sidebands for CH2 and NH3 are indicated by open circles and crosses, respectively). | ||
Next, we measured the MAS 1H NMR spectrum at various temperatures, and the intensity change for the delay time was observed to obtain the spin–lattice relaxation time in the rotating frame (T1ρ) for 1H at each temperature. Normally, the T1ρ data can be obtained as the slope of the intensity or the ratio of the area of the resonance signal to the delay time. The change in the proton magnetisation intensity in terms of T1ρ is expressed as below:21–23
P(τ) = P(0)![[thin space (1/6-em)]](https://www.rsc.org/images/entities/char_2009.gif) exp(−τ/T1ρ), exp(−τ/T1ρ),
| (1) |
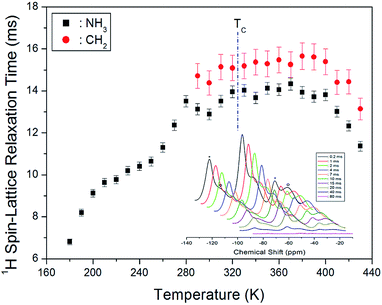 | ||
| Fig. 4 1H NMR spin-lattice relaxation times T1ρ for CH2 and NH3 ions of [(NH3) (CH2)4(NH3)]CuCl4 as a function of temperature (inset: 1H NMR spectrum at several delay times at 300 K). | ||
The CP/MAS 13C NMR chemical shifts measured at various temperatures are shown in Fig. 5. In the study, the MAS 13C NMR spectrum for TMS was recorded at 38.3 ppm at 300 K, and this value was calibrated to determine the chemical shift in 13C. Here, the two inner CH2 groups of the four CH2 ones are together designated as CH2-1, and the two CH2 units close to the NH3 ones are designated as CH2-2. We note from the figure that the 13C chemical shifts for CH2-1 (far from NH3) are different from those for CH2-2, which is closer to NH3. In the 13C NMR spectra obtained for CH2-1 and CH2-2, two unusual resonance lines are observed between 260 and 310 K. At 300 K, the two resonance signals for CH2-1 are recorded at chemical shifts of δ = 38.44 and 59.56 ppm. Furthermore, the signal of δ = 98.23 ppm corresponds to CH2-2. The 13C chemical shifts for CH2-1 exhibit an anomalous change with increase in temperature, whereas those for CH2-2 shift abruptly with increasing temperature, as shown in Fig. 6. The two resonance lines between 260 and 310 K correspond to CH2-1, and hitherto unreported anomalous phenomena are observed in this temperature range.
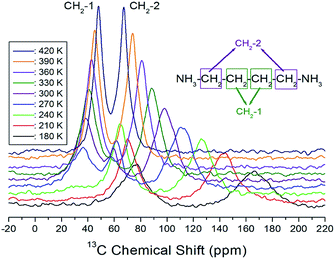 | ||
| Fig. 5 In situ MAS 13C NMR spectra for CH2-1 and CH2-2 of [(NH3)(CH2)4 (NH3)]CuCl4 as a function of temperature. | ||
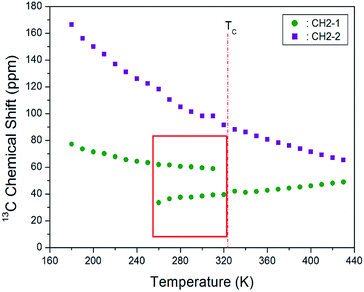 | ||
| Fig. 6 MAS 13C chemical shifts for CH2-1 and CH2-2 of [(NH3)(CH2)4 (NH3)]CuCl4 at low temperature phase II and high temperature phase I. | ||
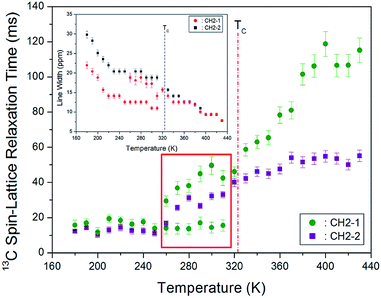
We next remark that line broadening in the MAS 13C NMR spectra is influenced by relaxation processes such as the motional modulations of the chemical shift anisotropy and dipolar carbon-proton coupling. Fig. 7 shows the 13C full-width at half-maximum (FWHM) linewidth of [(NH3)(CH2)4(NH3)]CuCl4. The 13C NMR line shapes vary from the Gaussian type at lower temperatures to the Lorentzian shape at higher temperatures. The appearance of these two-component spectra is caused by difference in different molecular motions. The linewidth near the phase transition temperature TC shows a monotonic decrease, thereby indicating the presence of motional narrowing at high temperatures.
The spin–lattice relaxation time in the rate of relaxation is due to spin–lattice interactions in the rotating frame. The 13C T1ρ relaxations are not influenced by spin diffusion because of the small dipolar coupling which arises from the low natural abundance and large separation of the nuclei. Under these conditions, we next analysed differences in the chain motions. The integration change of the 13C NMR spectrum obtained for various delay times was measured, and all the decay curves for CH2-1 and CH2-2 were plotted by using a single exponential function. From the slope of their recovery traces, the 13C T1ρ data were obtained for CH2-1 and CH2-2 as a function of temperature, as shown in Fig. 7. It can be observed that although no change in the T1ρ value is observed near TC, T1ρ above TC abruptly increases with increasing temperature. The 13C T1ρ values for CH2-1 and CH2-2 at lower temperatures (below TC) are nearly identical; however, the 13C T1ρ values for CH2-2 close to NH3 at high temperatures are smaller than that for CH2-1. At high temperatures, smaller 13C T1ρ values for CH2-2 are more flexible than the CH2-1. Just as the 13C resonance lines for CH2-1 exhibited anomalies between 260 and 310 K, the 13C T1ρ also exhibits two different sets of values. The relaxation time for Arrhenius-type random motions with correlation time τC is described in term of slow motions; for τC ≪ ωL, T1ρ ∼ τC = τ0![[thin space (1/6-em)]](https://www.rsc.org/images/entities/char_2009.gif) exp(−Ea/kBT), where ωL denotes the Larmor frequency and Ea the activation energy.
exp(−Ea/kBT), where ωL denotes the Larmor frequency and Ea the activation energy.
The 14N NMR spectrum in the laboratory frame was next measured in the temperature range from 180 to 430 K by using the solid-state echo method at the Larmor frequency of 28.90 MHz by means of static NMR. The two resonance lines are obtained by spin number I = 1,24,25 and the resonance frequency around TC (=323 K) changes as shown in Fig. 8. The observed change in the 14N resonance frequency with temperature is due to structural geometry change, which means a change in the quadrupole coupling constant. The linewidth at 300 K is ∼44 ppm, and this spectrum is relatively broader than the 1H and 13C NMR spectra. The 14N resonance frequency decreases almost continuously until 270 K, while that of the 14N signal between 280 and 310 K exhibits an anomalous pattern. Similar to the anomaly of the 13C resonance line observed between 260 and 310 K, an abnormal phenomenon is observed in the 14 N resonance line in this region. At 320 K near TC, there is only one 14N resonance line, and at temperatures >320 K, no resonance lines are observed. At the transition point of 323 K, the 14N NMR lines merge into one line. This single 14N resonance line indicates that there is no electric field gradient (EFG) tensor at the N site in phase I because of site symmetry. The EFG tensor changes around the N site, which indicates a change in the structural configuration around the N site near TC.
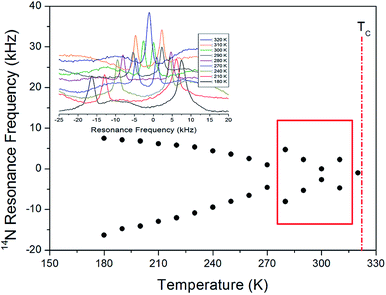 | ||
| Fig. 8 14N resonance frequency of [(NH3) (CH2)4(NH3)]CuCl4 single crystal as a function of temperature (inset: in situ 14N resonance frequency at several temperatures). | ||
IV. Conclusions
In this study, we investigated the thermal behaviour and physical properties of organic–inorganic hybrid perovskite [(NH3)(CH2)4(NH3)]CuCl4 crystals. The structural dynamics of [(NH3)(CH2)4(NH3)]CuCl4 with emphasis on the role of the [(NH3)(CH2)4(NH3)] cation, were discussed by MAS 1H NMR, MAS 13C NMR, and static 14N NMR as a function of temperature. Firstly, we found that the TGA curve exhibited stability until 495 K, and the observed weight loss of 12% near 538 K was due to the partial thermal decomposition of HCl moieties.Secondly, the 1H NMR chemical shift of NH3 for crystallographic environments changed more significantly with temperature than that for CH2 because the [(NH3)(CH2)4(NH3)] cation motion is enhanced at both ends of the cation of the NH3 group. The 13C NMR chemical shifts for CH2-1 showed an anomalous change, and those for CH2-2 shifted sharply to lower values when compared with that of CH2-1. The 13C chemical shifts of the CH2-2 unit (closer to the N–H⋯Cl bond) sharply changed relative to those of CH2-1. In addition, the 14N NMR spectra reflected the changes in the local symmetry of the crystal near TC.
The 1H T1ρ values for CH2 and NH3 slightly increased with temperature increase. Moreover, the 13C T1ρ value for CH2-2 was smaller than that of CH2-1, and the 13C T1ρ value for CH2-1 exhibited an anomalous trend between 260 and 310 K. At low temperatures, the 1H and 13C T1ρ values were smaller than at high temperatures. Smaller T1ρ values at lower temperatures indicate that 1H and 13C in the organic chains are more flexible at these temperatures. Moreover, the 13C of CH2-2 close to NH3 of the organic chain is more flexible than the 13C of CH2-1 between the four CH2 sites. The NH3 group is attached to both ends of the organic chain, and it forms a N–H⋯Cl hydrogen bond with the Cl ion of the inorganic CuCl4. The T1ρ value is smaller when H and C are located close to the paramagnetic Cu2+ ion than when far away. Additionally, the NH3 groups are coordinated by CuCl4, and thus, atomic displacements in the environment of the 14N nuclei with temperature are correlated with CuCl4. We also note here that detailed studies are required to examine the anomalies observed in the range of 260 to 310 K.
Here, we compared the phase transition temperatures, decomposition temperatures, crystal structures, space groups, lattice constants, and spin-lattice relaxation times of the previously reported [C2H5NH3]2CuCl4 (ref. 26–35) and those of [NH3(CH2)4NH3]CuCl4 examined in this study; this is summarised in Table 1. The difference between the two crystals is only the presence of organic cation. The two compounds have four and one phase transition temperatures, respectively. The decomposition temperature of [NH3(CH2)4NH3]CuCl4 is higher than that of [C2H5NH3]2CuCl4, and the [NH3(CH2)4NH3]CuCl4 has a high thermal stability. Furthermore, the 1H and 13C T1ρ values in [C2H5NH3]2CuCl4 are slightly different from those for [NH3(CH2)4NH3]CuCl4. Although the two crystals have same anions, the molecular motions according to the 13C bond lengths of the (C2H5NH3) cation in [C2H5NH3]2CuCl4 and [NH3(CH2)4NH3] cation in [NH3(CH2)4NH3]CuCl4 are different. The above results suggest that the molecular motions obtained from 1H and 13C T1ρ will be considered as good examples of potential applicability.
| [C2H5NH3]2CuCl4 | [NH3(CH2)4NH3]CuCl4 | |
|---|---|---|
| TC (K) | 236, 330, 357, 371 (ref. 26–31) | 325 (ref. 14) |
| Td (K) | 430 | 495 |
| Structure | Orthorhombic32–34 | Monoclinic14,15 |
| Space group | Pbca | P21/c |
| Lattice constant | a = 7.47 | a = 9.270 |
| (Å) | b = 7.35 | b = 7.600 |
| c = 21.18 | c = 7.592 | |
| β = 103.14° | ||
| 1H T1ρ (ms) | 7–20 (ref. 35) | 6–16 |
| 13C T1ρ (ms) | 2–200 | 10–120 |
Conflicts of interest
There are no conflicts to declare.Acknowledgements
This research was supported by the Basic Science Research program through the National Research Foundation of Korea, funded by the Ministry of Education, Science, and Technology (grant numbers 2018R1D1A1B07041593 and 2016R1A6A1A03012069).References
- S. Gonzalez-Carrero, R. E. Galian and J. Perez-Prieto, Part. Part. Syst. Charact., 2015, 32, 709 CrossRef CAS.
- W. Liu, J. Xing, J. Zhao, X. Wen, K. Wang, L. Peixiang and Q. Xiong, Adv. Opt. Mater., 2017, 5, 1601045 CrossRef.
- M. F. Mostafa, S. S. El-khiyami and S. K. Abdel-Aal, J. Mol. Struct., 2017, 1127, 59 CrossRef CAS.
- P. Mondal, S. K. Abdel-Aal, D. Das and S. K. Manirul Islam, Catal. Lett., 2017 DOI:10.1007/s10562-017-2112-7.
- S. K. Abdel-Aal, Solid State Ionics, 2017, 303, 29 CrossRef CAS.
- M. Yuan, L. N. Quan, R. Comin, G. Walters, R. Sabatini and O. Voznyy, et al., Nat. Nanotechnol., 2016, 11, 872 CrossRef CAS.
- Z. Cheng and J. Lin, CrystEngComm, 2010, 12, 2646 RSC.
- D. B. Mitzi, Chem. Mater., 1996, 8, 791 CrossRef CAS.
- S. K. Abdel-Aal, G. Kocher-Oberlehner, A. Ionov and R. N. Mozhchil, Appl. Phys. A, 2017, 123, 531 CrossRef.
- S. K. Abdel-Aal and A. S. Abdel-Rahman, J. Cryst. Growth, 2017, 457, 282 CrossRef CAS.
- A. M. Al-Amri, S.-F. leung, M. Vaseem, A. Shamim and J.-H. He, IEEE Trans. Electron Devices, 2019, 66, 2657 CAS.
- A. M. Al-Amri, B. Cheng and J.-H. He, IEEE Trans. Nanotechnol., 2019, 18, 1 CAS.
- C.-H. Lin, C.-Y. Kang, T.-Z. Wu, C.-L. Tsai, C.-W. Sher, X. Guan, P.-T. Lee, T. Wu, C.-H. Ho, H.-C. Kuo and J.-H. He, Adv. Funct. Mater., 2010, 30, 1909275 CrossRef.
- T. Maris, N. B. Chanh, J.-C. Bissey, N. Filloleau, S. Flandrois, R. Zouari and A. Daoud, Phase Transitions, 1998, 66, 81 CrossRef.
- T. Maris, G. Bravic, N. B. Chanh, J. M. Leger, J. C. Bissey, A. Villesuzanne, R. Zouari and A. Daoud, J. Phys. Chem. Solids, 1996, 57, 1963 CrossRef CAS.
- L. O. Snively, G. F. Tuthill and J. E. Drumheller, Phys. Rev. B: Condens. Matter Mater. Phys., 1981, 24, 5349 CrossRef CAS.
- L. O. Snively, J. E. Drumheller and K. Emerson, Phys. Rev. B: Condens. Matter Mater. Phys., 1981, 23, 6013 CrossRef CAS.
- J. K. Garland, K. Emerson and M. R. Pressprich, Acta Crystallogr., Sect. C: Cryst. Struct. Commun., 1990, 46, 1603 CrossRef.
- J.-C. Bissey, R. Berger, P. Beziade, N.-B. Chanh, T. Maris, R. Zouari and A. Daoud, Solid State Commun., 1996, 97, 669 CrossRef CAS.
- T. M. Kite, J. E. Drumheller and K. Emerson, J. Magn. Reson., 1982, 48, 20 CAS.
- A. Abragam, The Principles of Nuclear Magnetism, Oxford University press, 1961 Search PubMed.
- J. L. Koenig, Spectroscopy of Polymers, Elsevier, New York, 1999 Search PubMed.
- R. K. Harris, Nuclear Magnetic Resonance Spectroscopy, Pitman Pub., UK, 1983 Search PubMed.
- J. Seliger, R. Blinc, H. Arend and R. Kind, Z. Physik B, 1976, 25, 189 CrossRef CAS.
- S. Mulla-Osman, D. Michel and Z. Czapla, Phys. Status Solidi B, 2003, 236, 173 CrossRef CAS.
- V. Kapustianyk, V. Rudyk and M. Partyka, Phys. Status Solidi B, 2007, 244, 2151 CrossRef CAS.
- V. B. Kapustianik, V. V. Bazhan and Yu. M. Korchak, Phys. Status Solidi B, 2002, 234, 674 CrossRef CAS.
- W. Kleemann, F. J. Schafer, E. Karajamaki, R. Laiho and T. Levola, Physica B, 1983, 119, 269 CrossRef CAS.
- V. Kapustianik, Yu. Korchak, I. Polovinko, R. Tchukvinskyi, Z. Czapla and S. Dacko, Phys. Status Solidi B, 1998, 207, 95 CrossRef CAS.
- C. B. . Mohamed, K. Karoui, F. Jomni, K. Guidara and A. B. . Rhaiem, J. Mol. Struct., 2015, 1082, 38 CrossRef CAS.
- I. R. Jahn, K. Knorr and J. Ihringer, J. Phys.: Condens. Matter, 1989, 1, 6005 CrossRef CAS.
- B. Kundys, A. Lappas, M. Viret, V. Kapustianyk, V. Rudyk, S. Semak, Ch. Simon and I. Bakaimi, Phys. Rev. B: Condens. Matter Mater. Phys., 2010, 81, 224434 CrossRef.
- P. Zolfaghari, G. A. de Wijs and R. A. de Groot, J. Phys.: Condens. Matter, 2013, 25, 295502 CrossRef CAS.
- J. P. Steadman and R. D. Willett, Inorg. Chim. Acta, 1970, 4, 367 CrossRef CAS.
- A. R. Lim and Y. L. Joo, RSC Adv., 2018, 8, 34110 RSC.
Footnote |
| † Electronic supplementary information (ESI) available. See DOI: 10.1039/d0ra06551j |
| This journal is © The Royal Society of Chemistry 2020 |

