 Open Access Article
Synthesis and characterization of MOFs constructed from 5-(benzimidazole-1-yl)isophthalic acid and highly selective fluorescence detection of Fe(III) and Cr(VI) in water†
Bin Zhub,
Guimei Huanga,
Yanni Hea,
Jisheng Xiea,
Tao Hea,
Junli Wang*a and
Ziao Zong *a
*a
aSchool of Laboratory Medicine, Youjiang Medical University for Nationalities, Baise, 533000 Guangxi, China. E-mail: zongziao_yy@163.com; 396107666@qq.com
bCollege of Chemistry and Chemical Engineering, Ocean University of China, Qingdao, 266100, Shandong, China
First published on 22nd September 2020
Abstract
In this work, four novel metal–organic frameworks [Cd(bipa)]n (1), {[Zn2(bipa)2]·2C2H5OH}n (2), {[Co(bipa)]·C2H5OH}n (3), {[Ni(bipa)2]·2DMA}n (4), (H2bipa = 5-(benzimidazole-1-yl)isophthalic acid) were successfully synthesized under solvothermal conditions. Complexes 1–4 were characterized by powder X-ray diffraction, elemental analysis, infrared spectroscopy and thermogravimetric analysis. Interestingly, the coordination patterns and 3D network structures of complexes 1–3 are very similar, while complex 4 is relatively unique. Complexes 1–2 exhibit potential fluorescent properties. Complex 1 can selectively and sensitively detect trace Fe(III) and Cr(VI) in water by fluorescence quenching detection, and the quenching mechanism is further discussed.
1. Introduction
Metal ions have played an extremely important role in industrial production and biological metabolism.1 Chromium is an indispensable metal material in leather production, electroplating, printing and dyeing, metallurgy and in the nuclear industry.2–6 A large amount of chromium ions are discharged into rivers with industrial wastewater, which seriously affects the ecological environment and human health. Chromium ions with different chemical valences have different physical and biochemical characteristics.7–10 Cr(III) has low toxicity and high stability, which is beneficial to the metabolism of fat and protein in mammals.11 Cr(III) is hundreds of times more active than Cr(VI), which is a strong carcinogen and teratogen, and could accumulate in water, animals and plants in large quantities causing catastrophic effects on the entire ecological chain and food chain.12–16 Similarly, Fe(II) is indispensable for human life activities, and which is mainly used as important carrier for oxygen transmission by hemoglobin in human blood.17,18 The content of Fe(III) is an important criterion for evaluating water quality, whose lack or excess will threaten the health of organisms.19,20 At present, the methods for detecting iron and chromium ions in water mainly include ICP-MS,21 atomic absorption spectroscopy,22 voltammetry,23 and fluorescence spectrophotometry.24,25 Compared with other detection methods, the fluorescence method based on chemical sensing has the advantages of fast detection speed, high sensitivity, and simple instrument operation.26,27Metal organic framework material (MOF) is a new type of inorganic–organic hybrid material with multiple functions.28 Due to its ultra-high specific surface area and controllable pore size,29,30 it has been widely used in catalysis, adsorption and gas storage.31–33 In recent years, because both the inorganic and organic parts of MOF can provide a platform for generating light, the light emission caused by the metal–ligand charge transfer can increase the multi-dimensional light emitting function, the short response time, and the long luminous life.34,35 Great progress has been made in using MOF as a fluorescence sensor to detect various metal ions.36–39
In this study, we chose 5-(benzimidazole-1-yl)isophthalic acid as the ligand, because the asymmetric arrangement of carboxyl groups on the conjugated benzene ring system can promote the transfer of electrons. Therefore, transition metal complexes constructed have some special fluorescence properties. Based on this, four novel complexes [Cd(bipa)]n (1), {[Zn2(bipa)2]·2C2H5OH}n (2), {[Co(bipa)]·C2H5OH}n (3), {[Ni(bipa)2]·2DMA}n (4), (H2bipa = 5-(benzimidazole-1-yl)isophthalic acid) were synthesized under solvothermal conditions. Because of the excellent fluorescence performance of complex 1, we initially explored its performance in detecting iron and chromium ions in water by fluorescence quenching effect.
2. Experimental section
2.1 Materials and physical measurements
More detailed information on instruments and materials is listed in the ESI.†2.2 Synthesis of [Cd(bipa)]n (1)
Complex 1 was prepared by mixing H2bipa (0.0348 g, 0.1 mmol), Cd(NO3)2·4H2O (0.0308 g, 0.1 mmol) and 8 mL of DMA–H2O (v/v = 6![[thin space (1/6-em)]](https://www.rsc.org/images/entities/char_2009.gif) :
:![[thin space (1/6-em)]](https://www.rsc.org/images/entities/char_2009.gif) 2) stirring for 0.5 h in air. Then the solution was transformed into the Teflon-lined stainless steel vessel, sealed, heated to 130 °C for 3 days, and cooled to room temperature (5 °C h−1). Colorless block crystals with a yield of 61.3% were obtained through the cooling rate of 5 °C h−1. Elemental analysis (%) calcd for C15H8CdN2O4: C, 45.88; H, 2.05; N, 7.13. Found (%): C, 45.65; H, 1.98; N, 7.25. IR (KBr pellet, cm−1): 1639 (s), 1558 (s), 1507 (m), 1425 (s), 1381 (s), 1241 (m), 1174 (w), 1108 (w), 1012 (w), 922 (w), 754 (s), 595 (w), 452 (m).
2) stirring for 0.5 h in air. Then the solution was transformed into the Teflon-lined stainless steel vessel, sealed, heated to 130 °C for 3 days, and cooled to room temperature (5 °C h−1). Colorless block crystals with a yield of 61.3% were obtained through the cooling rate of 5 °C h−1. Elemental analysis (%) calcd for C15H8CdN2O4: C, 45.88; H, 2.05; N, 7.13. Found (%): C, 45.65; H, 1.98; N, 7.25. IR (KBr pellet, cm−1): 1639 (s), 1558 (s), 1507 (m), 1425 (s), 1381 (s), 1241 (m), 1174 (w), 1108 (w), 1012 (w), 922 (w), 754 (s), 595 (w), 452 (m).
2.3 Synthesis of {[Zn2(bipa)2]·2C2H5OH}n (2)
Complex 2 was prepared by mixing H2bipa (0.0348 g, 0.1 mmol), Zn(NO3)2·6H2O (0.0297 g, 0.1 mmol) and 8 mL of C2H5OH–H2O (v/v = 1![[thin space (1/6-em)]](https://www.rsc.org/images/entities/char_2009.gif) :
:![[thin space (1/6-em)]](https://www.rsc.org/images/entities/char_2009.gif) 2) stirring for 0.5 h in air. Then the solution was transformed into the Teflon-lined stainless steel vessel, sealed, heated to 130 °C for 3 days, and cooled to room temperature (5 °C h−1). Light yellow transparent crystals with a yield of 67.6% were obtained. Elemental analysis (%) calcd for C34H28N4O10Zn2: C, 52.13; H, 3.60; N, 7.15. Found (%): C, 51.98; H, 3.65; N, 7.03. IR (KBr pellet, cm−1): 1659 (s), 1595 (m), 1507 (m), 1456 (m), 1397 (s), 1307 (m), 1241 (m), 1174 (w), 1055 (w), 926 (m), 750 (s), 591 (w), 532 (w), 458 (m).
2) stirring for 0.5 h in air. Then the solution was transformed into the Teflon-lined stainless steel vessel, sealed, heated to 130 °C for 3 days, and cooled to room temperature (5 °C h−1). Light yellow transparent crystals with a yield of 67.6% were obtained. Elemental analysis (%) calcd for C34H28N4O10Zn2: C, 52.13; H, 3.60; N, 7.15. Found (%): C, 51.98; H, 3.65; N, 7.03. IR (KBr pellet, cm−1): 1659 (s), 1595 (m), 1507 (m), 1456 (m), 1397 (s), 1307 (m), 1241 (m), 1174 (w), 1055 (w), 926 (m), 750 (s), 591 (w), 532 (w), 458 (m).
2.4 Synthesis of {[Co(bipa)]·C2H5OH}n (3)
A mixture of Co(NO3)2·6H2O (0.0291 g, 0.1 mmol), H2bipa (0.028 g, 0.1 mmol), and 8 mL of DMA–H2O–C2H5OH (v/v = 3![[thin space (1/6-em)]](https://www.rsc.org/images/entities/char_2009.gif) :
:![[thin space (1/6-em)]](https://www.rsc.org/images/entities/char_2009.gif) 3:2) were stirred for 0.5 hour in air. And then the solution was transformed into the Teflon-lined stainless steel vessel, sealed, and heated to 110 °C for 3 days. Subsequently, the vessel was cooled to the room temperature at the degree of 5 °C h−1. Violet block crystals were collected with the yield of 69.3% (based on H2bipa). Elemental analysis (%) calcd for C17H14CoN2O5: C, 53.00; H, 3.66, N, 7.27%. Found: C, 53.22; H, 3.59; N, 7.36%. IR (KBr disk, cm−1): 1670 (s), 1633 (s), 1500 (m), 1456 (m), 1397 (m), 1306 (w), 1240 (m), 1188 (m), 1016 (m), 904 (w), 739 (w), 626 (w), 530 (w).
3:2) were stirred for 0.5 hour in air. And then the solution was transformed into the Teflon-lined stainless steel vessel, sealed, and heated to 110 °C for 3 days. Subsequently, the vessel was cooled to the room temperature at the degree of 5 °C h−1. Violet block crystals were collected with the yield of 69.3% (based on H2bipa). Elemental analysis (%) calcd for C17H14CoN2O5: C, 53.00; H, 3.66, N, 7.27%. Found: C, 53.22; H, 3.59; N, 7.36%. IR (KBr disk, cm−1): 1670 (s), 1633 (s), 1500 (m), 1456 (m), 1397 (m), 1306 (w), 1240 (m), 1188 (m), 1016 (m), 904 (w), 739 (w), 626 (w), 530 (w).
2.5 Synthesis of {[Ni(bipa)2]·2DMA}n (4)
The synthesis step of complex 4 was similar to that of complex 3, only the Co(NO3)2·6H2O (0.0291 g, 0.1 mmol) was replaced with the Ni(NO3)2·6H2O (0.029 g, 0.1 mmol). The obtained green block crystals were centrifuged (yield: 54.4% based on H2bipa). Elemental analysis (%) calcd for C38H34N6NiO10: C, 57.53; H, 4.32; N, 10.59%. Found: C, 57.39; H, 4.21, N, 10.48%. IR (KBr disk, cm−1): 1675 (s), 1630 (s), 1592 (m), 1502 (m), 1458 (m), 1406 (m), 1308 (w), 1249 (w), 1183 (m), 1015 (m), 917 (m), 744 (m), 531 (m), 474 (w).2.6 X-ray crystal structure determination
The detailed single crystal diffraction method is shown in the ESI.† Crystallographic data for the complexes are given in Table 1. Selected bond lengths and angles for the complex are listed in Table S1.† CCDC number: 2008172 for 1, 2008119 for 2, 1911216 for 3, 1834432 for 4.†| a R1 = Σ‖Fo| − |Fc‖/Σ|Fo|, wR2 = [Σw(Fo2 − Fc2)2]/[Σw(Fo2)2]1/2. | ||||
|---|---|---|---|---|
| Complex | 1 | 2 | 3 | 4 |
| Empirical formula | C15H8CdN2O4 | C34H28N4O10Zn2 | C17H14CoN2O5 | C38H34N6NiO10 |
| Mr | 392.63 | 783.34 | 385.22 | 793.42 |
| T (K) | 170 | 170 | 173 | 173 |
| Crystal system | Monoclinic | Monoclinic | Monoclinic | Monoclinic |
| Space group | P21/c | P21/c | P21/c | C2/c |
| a/Å | 11.1911(4) | 21.6550(6) | 10.8442(14) | 22.951(5) |
| b/Å | 13.7660(4) | 10.8019(3) | 10.7281(14) | 10.686(2) |
| c/Å | 13.1938(4) | 15.3693(4) | 15.432(2) | 16.444(3) |
| α (°) | 90 | 90 | 90 | 90.000 |
| β (°) | 108.267(1) | 108.4690(10) | 108.456(3) | 118.415(4) |
| γ (°) | 90 | 90 | 90 | 90.000 |
| V (Å3) | 1930.16(11) | 3409.95(16) | 1703.0(4) | 3547.3(13) |
| F(000) | 768 | 1600 | 788 | 1648 |
| Z | 4 | 4 | 4 | 4 |
| Rint | 0.0644 | 0.0565 | 0 | 0.072 |
| Dcalcd (Mg m−3) | 1.351 | 1.526 | 1.503 | 1.486 |
| Gof | 1.052 | 1.106 | 1.090 | 1.075 |
| Final R indices [I > 2σ(I)] | R1 = 0.0333, wR2 = 0.0710 | R1 = 0.0458, wR2 = 0.0954 | R1 = 0.0548, wR2 = 0.1570 | R1 = 0.0513, wR2 = 0.0714 |
| R indices (all data) | R1 = 0.0530, wR2 = 0.0780 | R1 = 0.1023, wR2 = 0.1169 | R1 = 0.0710, wR2 = 0.1666 | R1 = 0.0928, wR2 = 0.1256 |
3. Results and discussion
3.1 Crystal structures of complexes 1–3
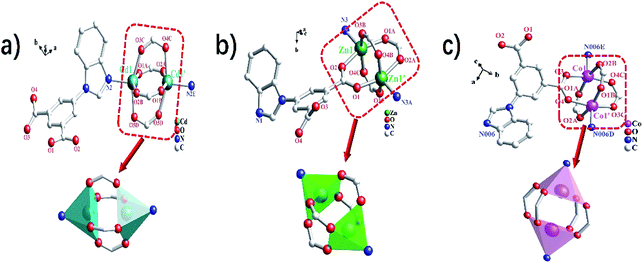
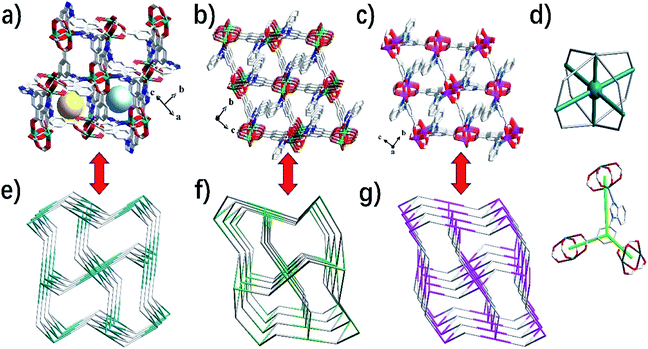
Single crystal X-ray diffraction data indicate that the complexes 1–3 belong to the monoclinic system, and space groups all are P21/c. As shown in Fig. 1a, the asymmetric unit of 1 contains one Cd(II) ion and one bipa2− ligand. The central Cd(II) ion is five-coordinated, completed by one nitrogen atom (N2) and four oxygen atoms (O1A, O2B, O3C and O5D) from five individuals bipa2− ligands, resulting in a slightly distorted square pyramid coordination geometry. The coordination environment of the central atoms and coordination mode of the ligand in complexes 2–3 are basically the same as in complex 1 (Fig. 1b and c). As shown in Table S1,† the Cd–N distance is 2.218(3) Å and the Cd–O distances are in the ranges of 2.208(2)–2.254(2) Å. It is interesting to note that the adjacent Cd ions are linked by four bidentate bridges from the carboxylate group of four bipa2− ligands, resulted in a [Cd2(COO)4] binuclear unit with the Cd⋯Cd distance of 3.1972(5) Å. And each binuclear unit is encircled by six bipa2− ligands and each bipa2− ligand is surrounded via three [Cd2(COO)4] binuclear unit. Finally, a 3D framework is formed by the connection of binuclear units and the bipa2− ligands (Fig. 2a). Complexes 1–3 are isostructural, which form the 3D frame structure with the same connection and growth pattern (Fig. 2b and c). Calculated by PLATON analysis, the effective free volume of 1 is 33.1% (639.2 Å3 out of the 1930.2 Å3 unit cell volume).From the viewpoint of structural topology, the [M2(COO)4] (M = Cd, Zn and Co) binuclear units can be simplified to a 6-connected node in complexes 1–3, while the “Y”-shaped bipa2− ligand linked to 3 adjacent clusters can be regarded as a 3-connected nodes (Fig. 2d). The whole 3D frameworks of 1–3 can be simplified as a novel 2-nodal (6, 3)-connected topology net with (4·62)2(42·610·83) topology (Fig. 2e–g). The topological analysis was produced using the TOPOS program.40
3.2 Crystal structure of {[Ni(bipa)2]·2DMA}n (4)
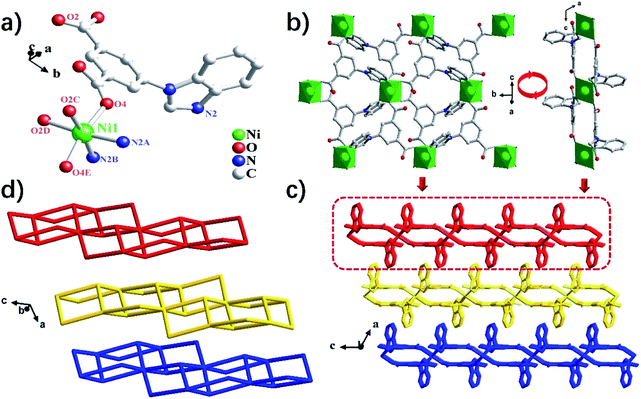
Complex 4 crystallizes in the monoclinic crystal system with the C2/c space group. X-ray structural analysis shows a two-dimensional (2D) network constituted by the Ni(II) ions and the bipa2− dianion. As shown in Fig. 3a, the asymmetric unit of 4 contains one Ni(II) ion, two bipa2− ligands, two lattice DMA molecules. The central Ni(II) ion is hexa-coordinated, completed by two nitrogen atoms (N2A and N2B) and four oxygen atoms (O2C, O2D, O4 and O4E) from six individual bipa2− ligands, resulting in a slightly distorted octahedral coordination geometry. The Ni–N distance is 2.064(2) Å, the Ni–O distances are in the ranges of 2.087(2)–2.119(2) Å (Table S1†). The distance of two adjacent Ni(II) ions is 9.3747(14), 10.2870(15) and 10.6860(21) Å separated by the bipa2− ligand. As shown in Fig. 3b, the Ni(II) ions are bridged by the μ3-bipa2− to generate a 2D framework. Then the two adjacent 2D interpenetrating networks are further interconnected by the Van der Waals forces, resulting in a 2D → 3D parallel network (Fig. 3c).From the viewpoint of structural topology, the Ni(II) ion can be simplified to a 6-connected node. The “Y”-shaped bipa2− ligand can be simplified to a 3-connected node. Thus, the whole 3D framework of 4 can be simplified as a (3, 6)-connected kgd net with (43)2(46·66·83) topology (Fig. 3d).
3.3 Thermal analyses
To better understand the thermal stability of complexes 1–4 their thermal behaviors were performed (Fig. S2†). For complex 1, the weight loss after 35 to 260 °C can be attributed to the loss of a small amount of DMA molecules in the guest, and the main framework begins to decompose above 400 °C. For complex 2, below 228 °C, the 12.4% weight loss (calcd 11.7%) may be due to the removal of two ethanol molecules in the crystal lattice. When the temperature exceeds 370 °C, the frameworks of 2 begin to gradually collapse due to the oxidation of the ligands. Complex 3 displays 20.8% weight loss (calcd 11.9%), in the temperature range of 30–301 °C, results from the complete decomposition of one ethanol melecule. Because of the gradual oxidation of the organic ligands, the structural frameworks of 3 began to collapse when the temperature exceeds 410 °C. For complex 4, the 21.4% weight loss is from 30 to 328 °C, which coincided with calcd 22.1%. This weight loss corresponds to the removal of one DMA molecule. The second weight loss corresponds to the loss of the organic ligands at 328 °C, and then the pyrolysis of the framework took place. The temperature at which the framework structure of complex 4 begins to collapse is significantly earlier than that of 1–3, which may be caused by the coordination mode of dual-core metal being more stable than that of single-core.3.4 Photoluminescent properties of complexes 1–4
MOFs with d10 metal centers are considered to be materials with luminescence potential.41 The solid-state fluorescence spectra of bipa ligand and complexes 1–4 were studied at room temperature. It can be seen from Fig. S3† that the maximum fluorescence emission peak of complex 1–4 is observed at 385 nm, 392 nm, 387 nm and 395 nm, and the maximum emission peak of free bipa ligand is at 368 nm (λex = 275 nm). This can be attributed to the π*–π and π*–n transitions, and the fluorescence of the complex 1–4 can be considered as the fluorescence based on the bipa ligand. Compared with the emission peak of bipa ligand, 1–4 show red shifts of 17 nm, 24 nm, 19 nm and 27 nm, respectively. The red shift may be caused by ligand-to-metal charge transfer (LMCT).423.5 Optical properties of complexes 3–4
It is well known that the optical band gap is one of the reference standards for measuring whether MOFs have potential photocatalytic properties. Herein, the optical absorption and diffuse-reflection spectrum of complexes 1–4 were measured at ambient temperature. As depicted in Fig. 4, the solid-state UV spectrum of complexes 1–4 showed the maxima absorption at 280 nm, 255 nm, 278 nm and 275 nm, respectively. The energy band gaps of complexes 1–4 can be calculated according to the formula: Eg = 1240/λ (where λ is the wavelength and Eg is the band energy gap). The Eg of complexes 1–4 obtained by extrapolation of the linear portion of the absorption edges were estimated to be 3.72 eV, 3.20 eV, 3.87 eV and 3.81 eV.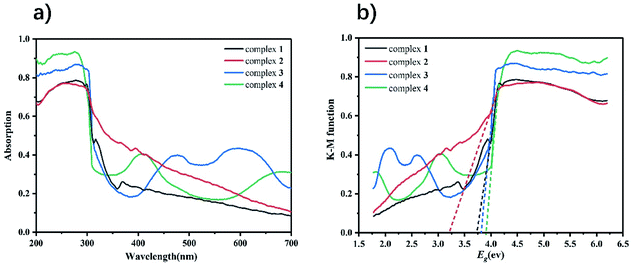 | ||
| Fig. 4 (a) UV-vis diffuse reflectance spectra of complexes 1–4; (b) Kubelka–Munk-transformed diffuse reflectance spectra of complexes 1–4. | ||
3.6 Pore characterization and stability test of complex 1
The porosity of complex 1 was tested by N2 adsorption and desorption at 77 K (Fig. 5a). The results show that the isotherm is a type IV adsorption isotherm, and the hysteresis loop belongs to the H3 type in the IUPAC classification. The hysteresis loop is closed at a relative pressure of 0.71. By the Brunauer–Emmett–Teller (BET) method, the specific surface area of complex 1 is 47.8 m2 g−1, and the average pore diameter is 4.5 nm. By comparing the PXRD patterns before and after the experiments of sensing Fe3+, Cr2O72− and CrO42−, it can be judged that the complex 1 maintains the structural integrity and good phase purity (Fig. 5b).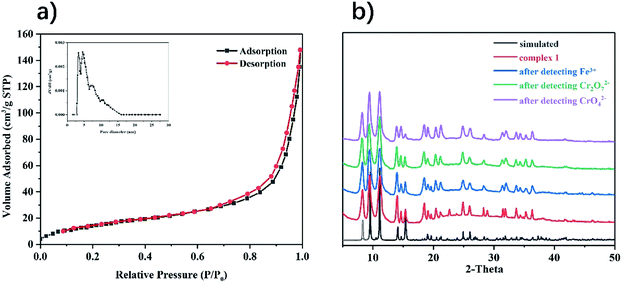 | ||
| Fig. 5 (a) Nitrogen adsorption and desorption isotherms for complex 1; (b) PXRD spectra of complex 1 before and after detection. | ||
3.7 Detection of Fe3+
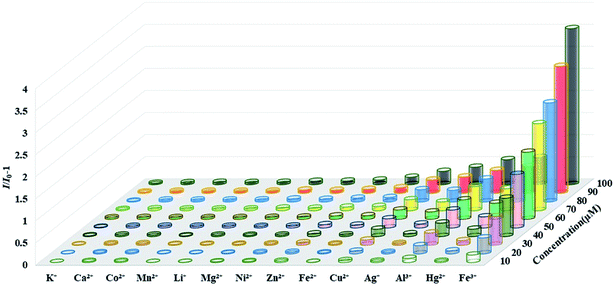
Based on the excellent fluorescent properties of complex 1, we explored 1 as a selective and sensitive fluorescent probe to detect metal ions in water. 3 mg of powder samples of complexes 1 were added to 5 mL of FeCl2 and MNOx solutions with the concentration of 1 mM (M = K+, Ca2+, Co2+, Mn2+, Mg2+, Li+, Zn2+, Ni2+, Al3+, Hg2+, Ag+, Cu2+ and Fe3+), sonicated for 15 min to obtain a stable suspension, and then detected their fluorescence intensities. As shown in Fig. S4,† compared with the aqueous solution of complex 1, the complex solutions with different metal cations show a certain degree of fluorescence quenching. In the solution of Fe3+, the fluorescence intensities of complex 1 were completely quenched. In order to avoid the accidental results of the experiment, three repeated experiments showed that it is still complex 1 that exhibits the highest fluorescence quenching efficiency in the solution of Fe3+ (97.8%). The fluorescence quenching abilities of metal ions solutions to complex 1 are in turn: Fe3+ > Cu2+ > Ag+ > Hg2+ > Al3+ > Ni2+ > Fe2+ > Zn2+ > Li+ > Mg2+ > Mn2+ > Co2+ > Ca2+ > K+.To further investigate the sensitivity of complex 1 in detecting Fe3+, that is, the effect of concentrations of Fe3+ on the fluorescence intensity of 1, aqueous solutions of different concentrations of Fe3+ were prepared. As concentrations of Fe3+ gradually increased, the fluorescence intensities of the complex 1 decreased (Fig. 6). In addition, the fluorescence quenching constant of 1 can be calculated using the Stern–Volmer equation: I0/I − 1 = Ksv[M] (where, I0 is the fluorescence intensity of complex in water, I is the fluorescence intensity of complex in the solution with a certain concentration of ion, [M] is ion concentration, Ksv is quenching constant).43 It can be calculated that in the low concentration range of 0–40 μM, there is a good linear relationship between the fluorescence intensity of 1 and the concentration of Fe3+ (R2 = 0.9945), and the quenching constants Ksv are 2.21 × 10⁴ M−1. Ksv is comparable to other fluorescent MOFs of the same type used to detect Fe3+, which makes complex 1 a competitive candidate (Table S2†). The limit of detection of 1 was calculated as 1.36 × 10 μM by the equation LOD = 3σ/Ksv (σ is the standard deviation of 5 blank experiments for the fluorescence intensity of complex 1). Fluorescence titration experiments were also performed on other metal ions in the range of 0 to 100 μM, the experimental results showed that the effect of changes in the concentrations of other metal ions on the fluorescence intensity of complex 1 is negligible (Fig. S5–S16†). In all metal ions, Fe3+ showed the highest fluorescence quenching efficiency to complex 1 at different concentrations (Fig. 7). Those results indicated that complex 1 has good selectivity and high sensitivity in detecting Fe3+.
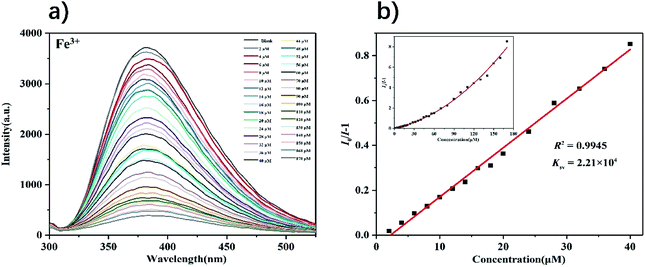 | ||
| Fig. 6 (a) Fluorescence spectra of complex 1 in the presence of various concentrations of Fe3+ (λex = 275 nm); (b) S–V plot of complex 1 upon incremental addition of Fe3+ ions. | ||
In the detection of iron ions in actual water samples, interference by other metal ions is inevitable. Therefore, the anti-interference performance of iron ions coexisting with other metal ions in water is evaluated by measuring the fluorescence intensity of complex 1 in the mixed metal ion solution. In the presence of 100 μM interfering ions, the decrease in the fluorescence intensity of complex 1 is negligible (Fig. S17†). It is worth noting that after adding the equivalent of iron ions, the fluorescence intensity decreases sharply. Those results clearly showed that complex 1 can be used as a fluorescent probe to sensitively and selectively detect iron ions in water, and the influence of the presence of other interfering mate ions can be ignored. As can be seen from Fig. S18a,† the fluorescence intensity of complex 1 reached a stable level in about 8 s after adding different concentrations of Fe3+, which indicated that the complex 1 can quickly identify Fe3+. After each fluorescence experiment of detecting Fe3+, the solution was centrifuged, the complex 1 powder was washed with ethanol and DMF, and activated for the next experiment. The blank fluorescence intensity of complex 1 after centrifugal, washing and activation can be recovered to the original intensity. After five experiments, the blank fluorescence intensity of complex 1 only decreased by 8.6%, and the quenching efficiency was almost unchanged after adding iron ions (Fig. S18b†). This means that complex 1 can be reused by simply cleaning and activating after each test, which is an important property of functional materials.
3.8 Detection of Cr2O72−and CrO42−
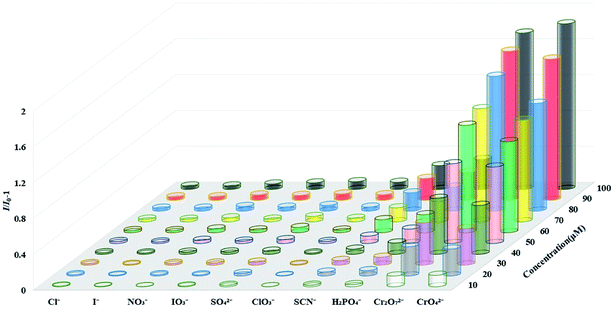
Next, we explored the performance of complex 1 as a fluorescent probe to recognize anions in water. Since complex 1 has the highest fluorescence intensity in the solution of K+ ion, 3 mg of complex 1 powder was dispersed in 5 mL of a series of potassium salt solutions with the concentration of 1 mM (Cl−, I−, NO3−, SO42−, ClO3−, IO3−, H2PO4−, SCN−, Cr2O72− and CrO42−). As shown in Fig. S19,† the fluorescence intensities of complex 1 were completely quenched in solutions of Cr2O72− and CrO42−, while only slight changes in other anion solutions. The fluorescence titration experiment of complex 1 detecting Cr2O72− and CrO42− were completed by recording the intensities of the fluorescence response of complex 1 after gradually increasing the concentrations of anions. The experiment result shows that as the concentrations of Cr2O72− and CrO42− gradually increased, the fluorescence intensities of complex 1 decreased accordingly (Fig. 8 and 9). From the Stern–Volmer equation (vide supra), the quenching constants for Cr2O72− and CrO42− in the concentration range of 0–60 μM are 1.73 × 10⁴ M−1 and 1.63 × 10⁴ M−1 respectively. Compared with other MOFs with the same function, complex 1 has an advantage in detecting Cr2O72− and CrO42− in water (Table S2†). Fluorescence titration experiments were carried out in other anion solutions, the fluorescence intensities of complex 1 changed very little within 100 μM concentrations (Fig. S20–S27†). Compared to other anion solutions, complex 1 showed the highest quenching efficiency in solutions of Cr2O72− and CrO42− at different concentrations (Fig. 10).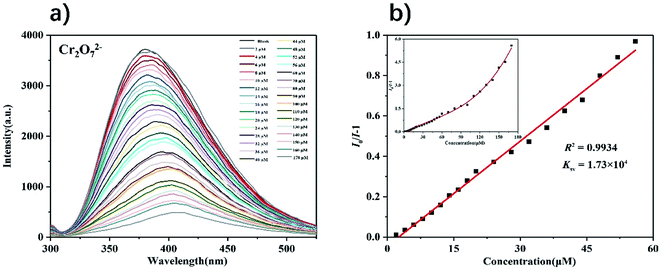 | ||
| Fig. 8 (a) Fluorescence spectra of complex 1 in the presence of various concentrations of Cr2O72− (λex = 275 nm); (b) S–V plot of complex 1 upon incremental addition of Cr2O72−. | ||
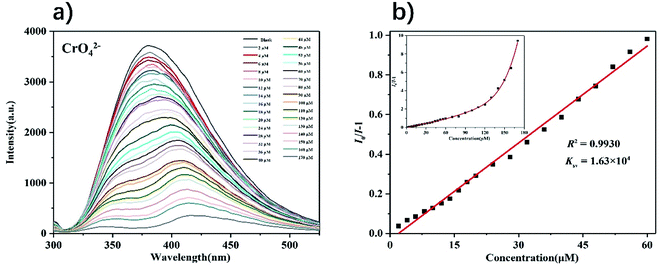 | ||
| Fig. 9 (a) Fluorescence spectra of complex 1 in the presence of various concentrations of CrO42− (λex = 275 nm); (b) S–V plot of complex 1 upon incremental addition of CrO42−. | ||
Similarly, the interference of other competing anions in the detection of Cr2O72− and CrO42− in water is inevitable. Taking Cr2O72− as an example, the anti-interference study of hexavalent chromium ion was carried out. After adding 100 μM of competitive anion solutions, the fluorescence intensities of complex 1 changed little, and then decreased significantly after adding an equivalent solution of Cr2O72− (Fig. S28†). From Fig. S29a,† the fluorescence intensity of complex 1 reached a stable level in about 13 s after adding different concentrations of Cr2O72−. Follow the same procedure as above to recover and reuse the complex 1 for the detection of hexavalent chromium ion. After five cycles of experiments, the fluorescence intensity of complex 1 only decreased by about 10%, and the quenching efficiency after adding the solution of Cr2O72− was still nearly 100% (Fig. S29b†). The above experimental results basically verify that the complex has high selectivity, high sensitivity and reusability for detecting hexavalent chromium ions in water.
3.9 Sensing mechanism
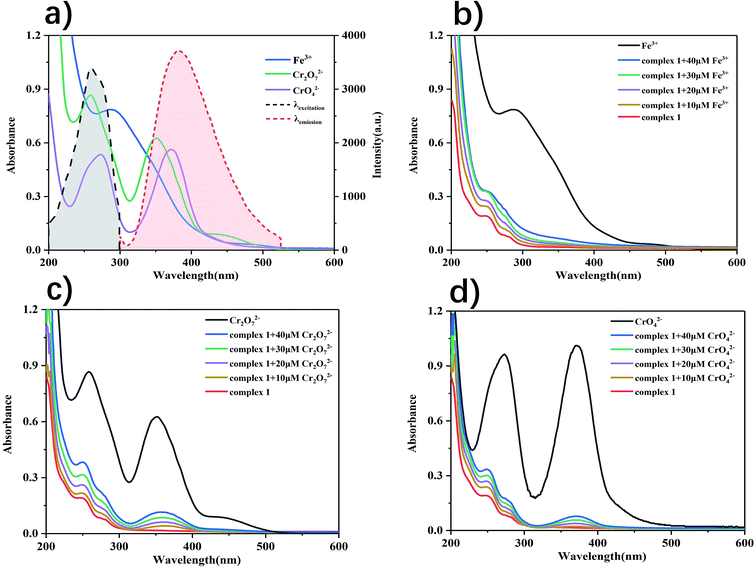
The mechanism by which Fe3+, Cr2O72− and CrO42− causes the fluorescence quenching of complex 1 may be as follows. By comparing the FT-IR spectrum of the original complex 1 and that recovered from the suspension containing Fe3+, Cr2O72− and CrO42−, it shows that there is no obvious change (Fig. S30†). Which indicated that the framework structure of the complex 1 remains intact, and there is no chemical bonding during this process. Moreover, the resonance energy transfer between analyte and complex promotes fluorescence quenching.44 Ultraviolet absorption spectra of metal ions and anions were measured (Fig. S31†). The result is that there are large overlaps between the fluorescence emission spectrum of complex 1 and UV absorption spectra of Fe3+, Cr2O72− and CrO42−, and there is almost no overlap with other ions (Fig. 11a).Therefore, Fe3+, Cr2O72− and CrO42− exhibited the strongest absorption of the emission light of complex 1. In order to further verify this mechanism, UV absorption titration experiments revealed that there was significant absorption enhancement by gradually adding the concentrations of Fe3+, Cr2O72− and CrO42− to complex 1 (0–40 μM). As can be seen from Fig. 11b–d, a rapid and significant increase in absorption was observed due to the increased absorption after the addition of Fe3+, Cr2O72− and CrO42−, the excitation light of complex 1 was weakened, resulting in fluorescence quenching. Thus, the high selectivity and sensitivity quenching response of complex 1 to Fe3+, Cr2O72− and CrO42− should be attributed to resonance energy transfer.
4. Conclusions
In summary, we synthesized four novel metal–organic frameworks [Cd(bipa)]n (1), {[Zn2(bipa)2]·2C2H5OH}n (2), {[Co(bipa)]·C2H5OH}n (3), {[Ni(bipa)2]·2DMA}n (4). Complexes 1–2 exhibit potential fluorescent properties. Fluorescence experiments show that complex 1 has a good application prospect for the detection of Fe3+, Cr2O72− and CrO42− in water with high selectivity and sensitivity.Conflicts of interest
There are no conflicts to declare.Acknowledgements
This work was supported by the Fundamental Research Funds for the Guangxi Natural Science Foundation Program (Grant No. 2019GXNSFBA245086).References
- B. Saha and C. Orvig, Coord. Chem. Rev., 2010, 254, 2959–2972 CrossRef CAS.
- K. H. Cheung and J.-D. Gu, Int. Biodeterior. Biodegrad., 2007, 59, 8–15 CrossRef CAS.
- J. G. Sandana Mala, D. Sujatha and C. Rose, Microbiol. Res., 2015, 170, 235–241 CrossRef CAS.
- P. Sun, Z.-T. Liu and Z.-W. Liu, Ind. Eng. Chem. Res., 2009, 48, 6882–6889 CrossRef CAS.
- J. Barnhart, Regul. Toxicol. Pharmacol., 1997, 26, S3–S7 CrossRef CAS.
- D. Park, Y.-S. Yun, J. Y. Kim and J. M. Park, Chem. Eng. J., 2008, 136, 173–179 CrossRef CAS.
- B. Qiu, C. Xu, D. Sun, Q. Wang, H. Gu, X. Zhang, B. L. Weeks, J. Hopper, T. C. Ho, Z. Guo and S. Wei, Appl. Surf. Sci., 2015, 334, 7–14 CrossRef CAS.
- E. Agrafioti, D. Kalderis and E. Diamadopoulos, J. Environ. Manage., 2014, 133, 309–314 CrossRef CAS.
- Y. Ma, W.-J. Liu, N. Zhang, Y.-S. Li, H. Jiang and G.-P. Sheng, Bioresour. Technol., 2014, 169, 403–408 CrossRef CAS.
- H. Gu, S. B. Rapole, J. Sharma, Y. Huang, D. Cao, H. A. Colorado, Z. Luo, N. Haldolaarachchige, D. P. Young, B. Walters, S. Wei and Z. Guo, RSC Adv., 2012, 2, 11007–11018 RSC.
- K. Choi, S. Lee, J. O. Park, J.-A. Park, S.-H. Cho, S. Y. Lee, J. H. Lee and J.-W. Choi, Sci. Rep., 2018, 8, 1438 CrossRef.
- A. D. Dayan and A. J. Paine, Hum. Exp. Toxicol., 2001, 20, 439–451 CrossRef CAS.
- S. A. Katz and H. Salem, J. Appl. Toxicol., 1993, 13, 217–224 CrossRef CAS.
- P. Rani, A. Sharma, A. Husain, G. Kumar, H. Kaur, K. K. Bhasin and G. Kumar, CrystEngComm, 2019, 21, 7447–7459 RSC.
- G. Kumar, R. Guda, A. Husain, R. Bodapati and S. K. Das, Inorg. Chem., 2017, 56, 5017–5025 CrossRef CAS.
- S. Mitra, A. Sarkar and S. Sen, Nanotechnol. Environ. Eng., 2017, 2, 11 CrossRef.
- T. Hirayama, Free Radicals Biol. Med., 2019, 133, 38–45 CrossRef CAS.
- J. Wang and K. Pantopoulos, Biochem. J., 2011, 434, 365–381 CrossRef CAS.
- X.-H. Zhou, L. Li, H.-H. Li, A. Li, T. Yang and W. Huang, Dalton Trans., 2013, 42, 12403–12409 RSC.
- C.-X. Yang, H.-B. Ren and X.-P. Yan, Anal. Chem., 2013, 85, 7441–7446 CrossRef CAS.
- W. Huang, J. Jiao, M. Ru, Z. Bai, H. Yuan, Z. Bao and Z. Liang, Sci. Rep., 2018, 8, 8603 CrossRef.
- W.-S. Zhong, T. Ren and L.-J. Zhao, J. Food Drug Anal., 2016, 24, 46–55 CrossRef CAS.
- S. K. Mittal, S. Rana, N. Kaur and C. E. Banks, Analyst, 2018, 143, 2851–2861 RSC.
- K. Qu, J. Wang, J. Ren and X. Qu, Chem.–Eur. J., 2013, 19, 7243–7249 CrossRef CAS.
- J. Li, Q. Wang, Z. Guo, H. Ma, Y. Zhang, B. Wang, D. Bin and Q. Wei, Sci. Rep., 2016, 6, 23558 CrossRef CAS.
- A. Valizadeh, H. Mikaeili, M. Samiei, S. M. Farkhani, N. Zarghami, M. Kouhi, A. Akbarzadeh and S. Davaran, Nanoscale Res. Lett., 2012, 7, 480 CrossRef.
- X. Wei, Z. Zhang and Z. Wang, Microchem. J., 2019, 145, 55–58 CrossRef CAS.
- O. M. Yaghi, M. O'Keeffe, N. W. Ockwig, H. K. Chae, M. Eddaoudi and J. Kim, Nature, 2003, 423, 705–714 CrossRef CAS.
- H.-C. J. Zhou and S. Kitagawa, Chem. Soc. Rev., 2014, 43, 5415–5418 RSC.
- H. Furukawa, N. Ko, Y. B. Go, N. Aratani, S. B. Choi, E. Choi, A. Ö. Yazaydin, R. Q. Snurr, M. O'Keeffe, J. Kim and O. M. Yaghi, Science, 2010, 329, 424 CrossRef CAS.
- J. L. C. Rowsell and O. M. Yaghi, J. Am. Chem. Soc., 2006, 128, 1304–1315 CrossRef CAS.
- D. A. Reed, D. J. Xiao, M. I. Gonzalez, L. E. Darago, Z. R. Herm, F. Grandjean and J. R. Long, J. Am. Chem. Soc., 2016, 138, 5594–5602 CrossRef CAS.
- Y. S. Wei, M. Zhang, R. Zou and Q. Xu, Chem. Rev., 2020 DOI:10.1021/acs.chemrev.9b00757.
- Z. Xiang, C. Fang, S. Leng and D. Cao, J. Food Drug Anal., 2014, 2, 7662–7665 CAS.
- S. Dang, E. Ma, Z.-M. Sun and H. Zhang, J. Mater. Chem., 2012, 22, 16920–16926 RSC.
- B. B. Rath and J. J. Vittal, Inorg. Chem., 2020, 59, 8818–8826 CrossRef CAS.
- Y. Liu, Y. K. Lu, B. Zhang, L. Hou and Y. Y. Wang, Inorg. Chem., 2020, 59, 7531–7538 CrossRef CAS.
- C. H. Liu, Q. L. Guan, X. D. Yang, F. Y. Bai, L. X. Sun and Y. H. Xing, Inorg. Chem., 2020, 59, 8081–8098 CrossRef CAS.
- C. Xu, C. Bi, Z. Zhu, R. Luo, X. Zhang, D. Zhang, C. Fan, L. Cui and Y. Fan, CrystEngComm, 2019, 21, 2333–2344 RSC.
- V. A. Blatov, A. P. Shevchenko and D. M. Proserpio, Cryst. Growth Des., 2014, 14, 3576–3586 CrossRef CAS.
- Z.-Q. Shi, Z.-J. Guo and H.-G. Zheng, Chem. Commun., 2015, 51, 8300–8303 RSC.
- G.-Z. Liu, L.-Y. Xin and L.-Y. Wang, CrystEngComm, 2011, 13, 3013–3020 RSC.
- B. Zhu, Z. Zong, X. Zhang, D. Zhang, L. Cui, C. Bi and Y. Fan, Appl. Organomet. Chem., 2020, 34, e5518 CAS.
- S. Chen, Z. Shi, L. Qin, H. Jia and H. Zheng, Cryst. Growth Des., 2017, 17, 67–72 CrossRef CAS.
Footnote |
| † Electronic supplementary information (ESI) available. CCDC 2008172, 2008119, 1911216 and 1834432. For ESI and crystallographic data in CIF or other electronic format see DOI: 10.1039/d0ra06529c |
| This journal is © The Royal Society of Chemistry 2020 |

