 Open Access Article
DOX sensitized upconversion metal–organic frameworks for the pH responsive release and real-time detection of doxorubicin hydrochloride†
Feng
Tian
 ,
Chen
Xu
,
Mingyue
Xu
,
Haiqing
Gao
,
Ziyi
Xiao
,
Ling
Li
,
Chen
Xu
,
Mingyue
Xu
,
Haiqing
Gao
,
Ziyi
Xiao
,
Ling
Li
 * and
Yingxi
Wang
*
Ministry-of-Education Key Laboratory for the Synthesis and Application of Organic Function Molecules, Hubei University, 430062, People's Republic of China. E-mail: lingli@hubu.edu.cn; 16890202@qq.com
First published on 14th September 2020
Abstract
Drug resistance is a major obstacle in cancer treatment, and designing a material that monitors real-time drug release remains a top priority. In this study, metal–organic frameworks doped with lanthanum and thulium were synthesized and then coated with aminated silica to form La/Tm-MOF@d-SiO2 as a drug carrier. Doxorubicin hydrochloride (DOX) was selected as a drug model, and the drug loading and release were investigated. It was found that the release of DOX under acidic conditions reached an optimal level, indicating the pH-responsiveness of La/Tm-MOF@d-SiO2. Under acidic conditions (pH = 5.8), upconversion fluorescence was generated after loading DOX on La/Tm-MOF@d-SiO2. At pH = 5.8, the longer the drug released, the stronger the upconversion fluorescence. It was found that the upconversion fluorescence intensity is directly proportional to the amount of drug released; thus, the real-time monitoring of DOX release in tumor cells can be performed based on the upconversion fluorescence.
1. Introduction
At present, cancer has become an important factor threatening human health, and chemotherapy is still the most basic way to treat cancer. In order to prevent side effects of chemotherapy, various kinds of functional drug carriers have been designed to load drugs and controllably release them to the cancer cells.1 However, during the use of drug carriers for tumor treatment, there is often a dilemma: when the anti-cancer drugs loaded on drug carriers are not delivered in a sufficient amount to the cancer cells, the cancer cells cannot be completely killed; however, when the dose of the anti-cancer drugs exceeds the actual dose required to kill the cancer cells, over-treatment occurs, leading to drug resistance, which is one of the important factors resulting in the failure of anticancer drugs in clinical practice.2 During the development and clinical application of anticancer drugs, the therapeutic effect of these drugs is directly related to the drug concentration–time correlation in the tissue.3 Therefore, the real-time monitoring of drug concentrations during chemotherapy is necessary.However, the traditional methods of analyzing and detecting the concentration of drugs in cells and tissues are significantly complicated; for examples, high-pressure liquid chromatography (HPLC) was adopted to determine the concentrations of drugs;4,5 however, it could not provide the exact relationship between the concentration of drug and time of drug release to monitor the release of drug. Therefore, there is a need to design a smart drug carrier that can monitor the real-time release of drugs. At present, there are many types of synthetic materials, such as molecular sieves, micelles, liposomes, and dendrimers,6–9 that can be used as controlled release carriers; however, only few of them can be used for the real-time monitoring of drug release.
Although many studies have been reported on the design and development of drug carriers, strategies for the real-time monitoring of targeted intracellular drug release are still in their infancy.10 In this regard, the most widely used strategies are simulation experiments using fluorescent drugs as models and doxorubicin as an important drug of choice.11 Indeed, this strategy has obvious limitations. During the release process, the fluorescence of DOX will be disturbed by the autofluorescence of the organism. The fluorescence of these fluorescent markers overlaps with the autofluorescence of biological tissues; this results in a significant background and reduced sensitivity in deep-tissue imaging. In order to solve the abovementioned autofluorescence problem, upconversion fluorescence materials are designed because the pump laser beam emitted by them is blue and can be easily filtered from the red-shifted autofluorescence.12,13 Therefore, designing a novel drug carrier that can monitor drug release using upconversion fluorescence is important.
Metal–organic frameworks (MOFs) are a kind of periodic network structures of three-dimensional porous materials and a broad category of crystal materials. Due to the high porosities and large specific surface areas of MOF materials, a larger amount of drug can be loaded on these materials; therefore, the development of these MOF materials for application in the fields of drug carriers and drug release is being promoted.14,15 In our previous study, MOFs co-doped with lanthanide metal ions have demonstrated unique fluorescence properties. The mutual activation between two different metal ions can make MOFs have higher application performance.16 Fe/La-MOFs produce a unique fluorescence as compared to those generated by Fe-MOFs and La-MOFs; Gd/Tm-MOFs produce upconversion fluorescence. Due to the antenna effect, the Ln-MOF can overcome the problem of weak light absorption of lanthanide ions due to the forbidden f–f transitions and has high photoluminescence efficiency, a unique narrow band, and long luminous lifetime.17
On the other hand, dye-sensitized upconversion typically involves the use of organic dye molecules anchored on a nanoparticle surface for the implementation of an antenna effect.18 Organic dyes with both absorption and emission in the visible range provide alternative possibilities for the direct sensitization of luminescent lanthanide ions to produce upconversion fluorescence. DOX has a strong absorption peak at 475 nm and a strong fluorescence peak at 585 nm.19 Therefore, it is expected that the combination of DOX with the MOFs co-doped with lanthanide metal ions will produce upconversion fluorescence.
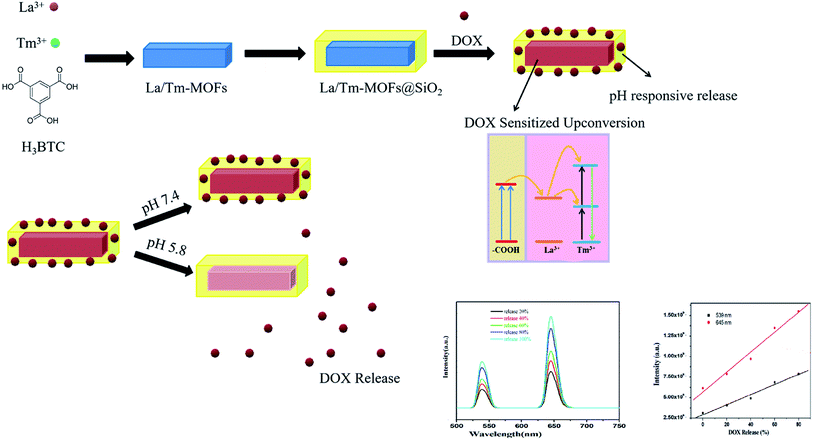
Inspired by this, La3+ and Tm3+ were selected to form La/Tm-MOFs. In recent years, silica substrates have attracted extensive research interest due to their excellent physicochemical stability, non-toxicity, adjustable particle size, high surface area, and easy surface functionalization.20 During the drug-delivery process, the silica matrix can maximize the bioavailability of drugs, minimize the toxicity of the drugs to normal cells, and enable the use of encapsulated biomolecules by its external environment such that the response of the trapped molecules to an external analyte can be monitored.21,22 Because the microenvironment of cancer cells is different from that of normal cells, measuring the relative concentration of substances in the cell microenvironment is helpful for early cancer diagnosis.23,24 In order to endow the La/Tm-MOFs with high drug-loading capacity and pH-responsiveness, they were wrapped with aminated porous silicon to form La/Tm-MOF@SiO2. After DOX loading, the interaction between –COOH of DOX and surface La3+ ions will permit the transfer of excitation energy across the organic/inorganic interface. The excited sensitized La3+ will then interact with the activator Tm3+ ions to produce upconversion fluorescence by classical energy transfer.
In a weakly acidic surrounding, the DOX loaded on the amino surface of the aminated porous silicon is released, whereas the doxorubicin loaded on the MOFs based on coordination is protected by the silicon layer and is not released. Some doxorubicin molecules in the MOFs are agglomerated by hydrogen bonding, which cannot achieve energy transfer. However, in an acidic medium, the agglomeration phenomenon weakens due to protonation, and more doxorubicin molecules can coordinate with La3+, which is beneficial for energy transfer. As a result, the real-time monitoring of drug release can be performed by the increased upconversion fluorescence (Scheme 1).
2. Experimental
2.1. Materials and instruments
Lanthanum nitrate (LaNO9·6H2O), thulium(III) chloride hexahydrate (TmCl3·6H2O), and trimesic acid (H3BTC) were purchased from Shanghai Macklin Biochemical Co., Ltd. Concentrated hydrochloric acid (HCl, 36.0–38.0%), polyvinylpyrrolidone (PVP, K-30), ammonium hydroxide (NH3·H2O, 25.0–28.0%), tetraethyl orthosilicate (TEOS), (3-aminopropyl)triethoxysilane (APTES), doxorubicin (DOX), ethanol absolute, diethyl ether, and acetone were purchased from the Aladdin Chemistry, Co. (Shanghai) and used as received. PEG-SH was obtained from DingGuo Chang Sheng Biotech. Co., Ltd. Disodium hydrogen phosphate dodecahydrate (Na2HPO4·6H2O) was purchased from Sinopharm Chemical Reagent Co., Ltd. Aqueous solutions were prepared with deionized water. All other chemicals used in this study were of analytical grade, obtained from commercial suppliers, and used without further purification unless otherwise noted.Powder X-ray diffraction (XRD) patterns were obtained using a D8 Advance X-ray diffractometer (Bruker Company, Germany). Fourier transform infrared (FTIR) spectra were acquired using a Spectrum One FTIR spectrophotometer (PerkinElmer, USA) at room temperature. Morphologies of the samples were observed using a JSM-6510 LV scanning electron microscope (SEM, JEOL, Japan). Fluorescence measurements were conducted by an LS55 fluorescence spectrometer (PerkinElmer, America).
2.2. Synthesis
La-MOFs were prepared by a hydrothermal method. Typically, 0.3249 g of La(NO3)3·6H2O was sonicated in 15 mL of deionized water, and 0.2101 g of H3BTC was sonicated in 15 mL of absolute ethanol. After this, the abovementioned two solutions were completely dissolved, and the mixture was transferred to a Teflon reaction vessel followed by reaction at 120 °C for 12 h. After 12 h, the white precipitate was separated by a centrifuge, washed three times with deionized water and absolute ethanol, and then placed in an oven at 60 °C for drying.Tm-MOFs were prepared by a hydrothermal method. Herein, 0.0383 g of TmCl3·6H2O was sonicated in 4 mL of deionized water, and 0.0210 g of H3BTC was sonicated in 8 mL of absolute ethanol. After this, the abovementioned two solutions were completely dissolved, and the mixture was transferred to a Teflon reactor followed by reaction at 140 °C for 24 h. After 24 h, the white precipitate was separated by a centrifuge, washed three times with deionized water and absolute ethanol, respectively, and then placed in an oven at 60 °C for drying.
La/Tm-MOFs were prepared by a hydrothermal method. Typically, 0.23826 La(NO3)3·6H2O was sonicated in 11 mL of absolute ethanol, 0.0102 g of TmCl3·6H2O was sonicated in 4 mL of absolute ethanol, and 0.2101 g of H3BTC was sonicated in 15 mL of absolute ethanol. Subsequently, the abovementioned three solutions were completely dissolved, and the mixture was transferred to a Teflon reactor followed by reaction at 140 °C for 24 hours and cooling to room temperature. The precipitate was separated by a centrifuge, repeatedly washed three times with deionized water and absolute ethanol, then placed in an oven at 60 °C for drying, and stored for use in the next step. Different conditions for the controlled synthesis of La/Tm-MOFs are provided in Table 1.
| Sample no. | RE3+ (mmol) | BTC (mmol) | NaAc (g) | PVP (g) | Temperature/°C | Time/h |
|---|---|---|---|---|---|---|
| La/Tm-MOFs-1 | 0.1 | 0.1 | 0.05 | 0 | 140 | 24 |
| La/Tm-MOFs-2 | 0.1 | 0.1 | 0.1 | 0 | 140 | 24 |
| La/Tm-MOFs-3 | 0.1 | 0.1 | 0.2 | 0 | 140 | 24 |
| La/Tm-MOFs-4 | 0.1 | 0.1 | 0 | 0.001 | 140 | 24 |
| La/Tm-MOFs-5 | 0.1 | 0.1 | 0 | 0.004 | 140 | 24 |
| La/Tm-MOFs-6 | 0.1 | 0.1 | 0.05 | 0.004 | 140 | 24 |
| La/Tm-MOFs-7 | 0.1 | 0.1 | 0.06 | 0.004 | 140 | 24 |
| La/Tm-MOFs-8 | 0.1 | 0.1 | 0.07 | 0.004 | 140 | 24 |
| La/Tm-MOFs-9 | 0.1 | 0.1 | 0.08 | 0.004 | 140 | 24 |
The La/Tm-MOFs were modified with d-SiO2 for amino functionalization. At first, 0.109 g of La/Tm-MOF sample and 0.5 g of CTAB were sonicated in 15 mL of absolute ethanol, 70 mL of deionized water, 0.8 mL of aqueous ammonia, and 15 mL of diethyl ether. After 40 minutes, a stir bar was added to the solution, the beaker containing the solution was placed on a magnetic stirrer, stirred at 1000 rpm for 0.5 h at 10 °C, and a mixture of 2.5 mL of TEOS and 0.1 mL of APTES was quickly added to the abovementioned solution. Stirring was continued for 4 h at 1000 rpm below 10 °C. After 4 h, 1 mL of 37% HCl was added to stop the alkalization reaction. After centrifugation at 4200 rpm for 12 min, the precipitates were separately washed 3 times with a mixture of deionized water, absolute ethanol, and acetone 1![[thin space (1/6-em)]](https://www.rsc.org/images/entities/char_2009.gif) :
:![[thin space (1/6-em)]](https://www.rsc.org/images/entities/char_2009.gif) 1, then placed in an oven at 40 °C for drying, and stored for later use.
1, then placed in an oven at 40 °C for drying, and stored for later use.
2.3. In vitro cell toxicity test
Mouse breast cancer (4T1) cells were cultured in standard cell media in 96-well plates and incubated in 5% CO2 at 37 °C for 24 h. Then, particles at different concentrations were added to the 96-well plates, and culture was continued for 24 h. Cell viability was determined using the CKK-8 (2-(2-methoxy-4-nitrophenyl)-3-(4-nitrophenyl)-5-(2,4-disulfophenyl)-2H-tetrazolium, monosodium salt) assay. Typically, the cells were incubated with 100 mL free DOX and DOX-loaded La/Tm-MOF@d-SiO2 at different concentrations (25, 50, 100, 200, and 500 μg mL−1) in PBS buffer for 24 h. The cells were rinsed three times with PBS, and then, 100 μL of a 0.1 mg mL−1 CKK-8 solution was added to each well followed by incubation for 30 min at 37 °C. Finally, an ELISA reader was used to measure the absorbance of each well at 480 nm. Results are expressed as the percentage of cell viability.2.4. Drug loading and release experiment
Herein, 0.1 g of La/Tm-MOF@d-SiO2 material was added to a 20 mL aqueous solution of doxorubicin hydrochloride (0.5 g L−1). The sample was placed at room temperature and protected from light, and the absorbance of the supernatant was measured at 24 h, 48 h, and 72 h using an ultraviolet spectrophotometer at its maximum absorption wavelength of 460 nm; moreover, the corresponding concentration was calculated according to the working curve of doxorubicin hydrochloride (DOX).A semipermeable membrane was placed in a beaker containing deionized water for boiling, and the Na2HPO4·12H2O solution (0.2 M) and the citric acid solution (0.1 M) are configured at buffer solutions of different pH (pH = 3.8, 5.8, 7.4) according to different volume ratios. Subsequently, 0.1 g of the MOF with drugs of known quality was loaded onto the boiled semipermeable membrane. After adding the buffer, the ends of the semipermeable membrane were sealed. Then, 20 mL of the buffer solution was added to a culture flask, and the semipermeable membrane was placed in this culture flask; after this, the culture flask was placed in a THZ-series constant temperature culture shaker to achieve a constant temperature condition of 37 °C for simulating the temperature of the human body. The buffer solution in the culture flask was withdrawn at certain intervals to measure the absorbance at 460 nm until the absorbance of the buffer solution in the culture flask became stable; the substantially unchanged absorbance indicated complete drug release.
2.5. Upconversion fluorescence detection
Typically, 0.1 g of MOF containing drugs of known quality was loaded onto the boiled semipermeable membrane. After adding buffer, the ends of the semipermeable membrane were sealed. Then, 20 mL of the buffer solution was added to a culture bottle, and the semipermeable membrane was placed in this culture bottle; after this, the culture bottle was put in the shaker to maintain the stability of the culture medium. The material in the culture flask was withdrawn every 2 hours, and the fluorescence value was measured at the excitation wavelength of 985 nm after drying the material. Subsequently, a product that released a certain amount of doxorubicin at the release times of 0 h, 20 h, 40 h, 60 h, and 80 h was taken, dried, and centrifuged, and the supernatant was used to measure the upconversion fluorescence.3. Result and discussion
3.1. Characterization results
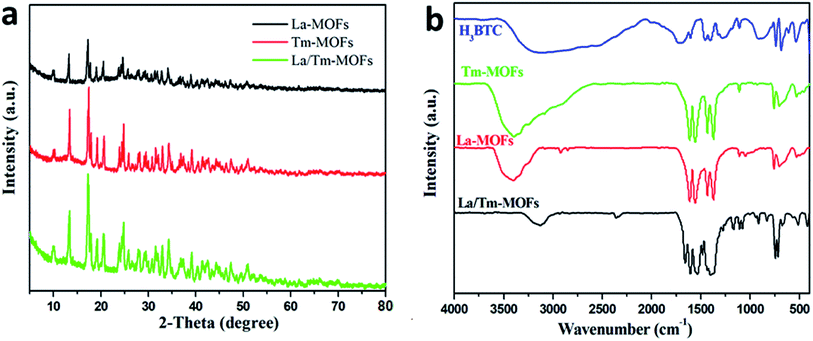
The XRD patterns of La-MOFs, Tm-MOFs, and La/Tm-MOFs are shown in Fig. 1(a). The peaks of the three MOFs are approximately the same. Because both lanthanum and thulium are lanthanide metals and the ligand is the same, their crystal forms are mostly the same, and consequently, the positions of their peaks are generally similar.Fig. 1(b) shows the infrared spectra of H3BTC, La-MOFs, Tm-MOFs, and La/Tm-MOFs. The peaks at 1508–1623 cm−1 are the characteristic peaks of the asymmetric carboxylic acid groups of H3BTC. The characteristic peaks of the symmetrical carboxylic acid groups of H3BTC were observed at 1384 cm−1 and 1405 cm−1. After the addition of metal ions, these characteristic peaks became more pronounced and sharp; this confirmed the exact interaction between the metal ions and the ligand. The peaks of the La/Tm-MOFs at 1000–1300 cm−1 are different from those of the La-MOFs and Tm-MOFs; this indicates that the La/Tm-MOF material is not a mixture of the La-MOFs and Tm-MOFs but a new MOF material.
The effects of the reaction conditions on the synthesis of La/Tm-MOFs was explored, as shown in Fig. 2. The effect of NaAc is shown in Fig. 2(a–c). With an increase in the amount of NaAc, the La/Tm-MOF crystals gradually showed a uniform rod-like morphology. Since the amount of NaAc controlled the size of the sample, a relatively uniform morphology could be obtained because of the improvement in the coordination between RE3+ and organic ligands.
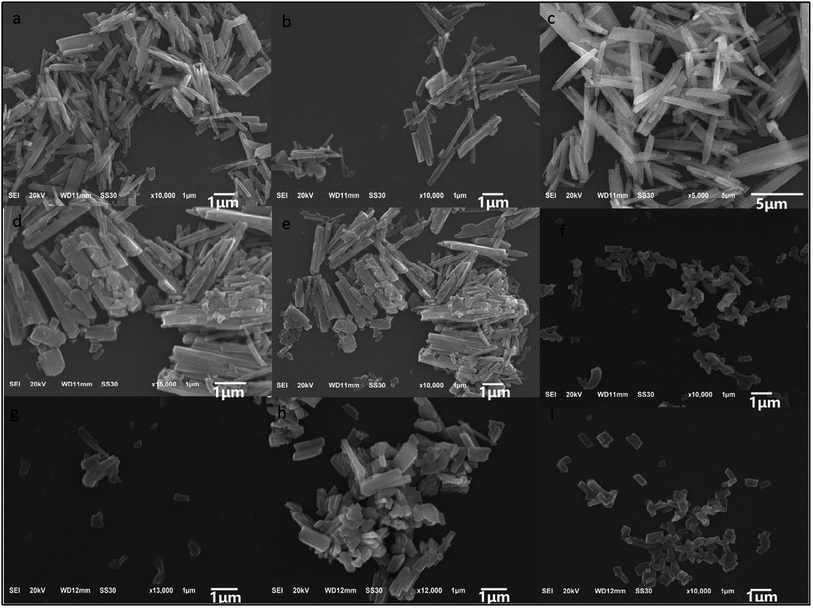 | ||
| Fig. 2 SEM images of different La/Tm-MOF particles synthesized at 140 °C in 24 h with the addition of PVP and NaAc in different amounts. In all the samples, the amount of both La3+ and Tm3+ was 1 mmol, and the amount of BTC was 1 mmol. (a–c) Show the images of the La/Tm-MOFs-1, La/Tm-MOFs-2, and La/Tm-MOFs-3 particles synthesized by varying the amount of NaAc, respectively. (d and e) Show the images of the La/Tm-MOFs-4 and La/Tm-MOFs-5 particles synthesized by varying the amount of PVP, respectively. (f–i) Show the images of the La/Tm-MOFs-6, La/Tm-MOFs-7, La/Tm-MOFs-8, and La/Tm-MOFs-9 particles, respectively, obtained by varying the amount of NaAc and keeping the amount of PVP constant, as presented in Table 1. | ||
The effect of the amount of PVP on the morphology of the La/Tm-MOF particles is shown in Fig. 2(d and e). As the amount of PVP was increased, the morphology of the particles tended to be uniform. Due to the electrostatic repulsion or spatial effect, the surface-adjusting molecules of PVP adsorbed on the surface of specific crystals; this significantly reduced the growth rate and limited the size level of the crystal. La/Tm-MOFs-9 was selected for the subsequent experiments because it had a uniform stick-like structure (as shown in Fig. S1†).
The structure of the La/Tm-MOF nanoparticles was further confirmed by EDX, as shown in Fig. 3. The composition of the La/Tm-MOFs can be clearly determined from the EDX elemental mapping data. The La, Tm, C, and O elements are evenly distributed; this indicates that the La/Tm-MOF materials have been successfully synthesized.
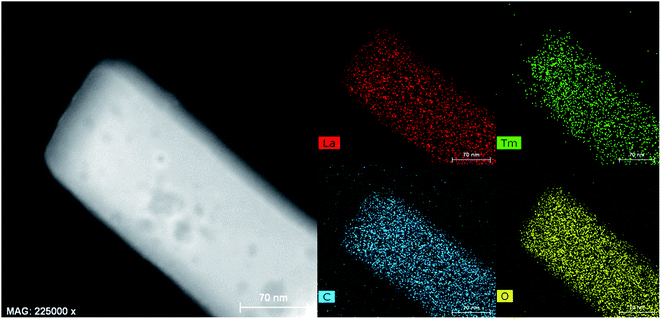 | ||
| Fig. 3 EDX elemental mapping of the La/Tm-MOFs. Elemental distribution of La, Tm, C, and O in the La/Tm-MOFs. | ||
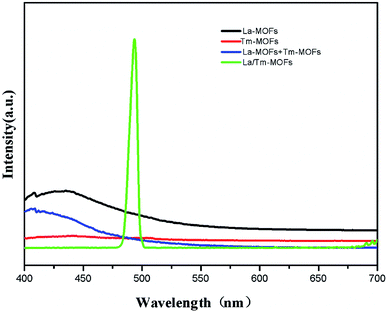
In order to examine the effect of the co-doping of Tm3+ and La3+, the fluorescence properties of the La-MOFs, Tm-MOFs, the mixture of La-MOFs and Tm-MOFs, and La/Tm-MOFs were investigated, as shown in Fig. 4.
The Tm-MOFs and La-MOFs had no fluorescence, and the mixture of La-MOFs and Tm-MOFs exhibited no fluorescence properties. In comparison, the La/Tm-MOFs showed a strong fluorescence emission at 568 nm. This proves that the La/Tm-MOF material is not a simple mixture of Tm-MOFs and La-MOFs, but a new kind of heterometallic MOFs formed through the co-coordination of Tm3+ and La3+ with H3BTC. The fluorescence of the lanthanide clusters is mainly derived from the f–f electronic transition. However, there are no 4f electrons in La3+; therefore, the La-MOFs exhibit zero or negligible fluorescence. However, the coupling interactions between the lanthanide and transition metal ions (f–d) are substantially stronger than the f–f interactions, and the introduction of 3d–4f heterometallic units into an MOF makes the energy levels more controllable, resulting in high efficiency and photoluminescence of the MOF. The possible mechanism of fluorescence is energy transfer from the excited levels of Tm3+ to the nearby levels of La3+. Upon the 3d–4f energy transfer, Tm3+ activates the luminescence properties of La3+. These observations show that the successful co-doping of Tm3+/La3+ into an MOF improves the fluorescence properties of the MOF. This finding further proves the successful synthesis of the La/Tm-MOFs.
3.2. Cell viability and drug loading/release of La/Tm-MOF@d-SiO2
On basis of the La/Tm-MOFs with an optimal morphology, La/Tm-MOF@d-SiO2 was prepared, and the EDX elemental mapping of La/Tm-MOF@d-SiO2 is shown in Fig. S2.† The uniform distribution of La, Tm, and Si illustrates the successful synthesis of La/Tm-MOF@d-SiO2. In order to investigate the possibility of La/Tm-MOF@d-SiO2 as a drug carrier, cell viability was examined, and the results are shown in Fig. 5. It can be clearly observed that the cell viability of the La/Tm-MOF@SiO2 solution at different concentrations is above 95%, which proves that the La/Tm-MOF@d-SiO2 material has low cytotoxicity and is suitable as a drug carrier.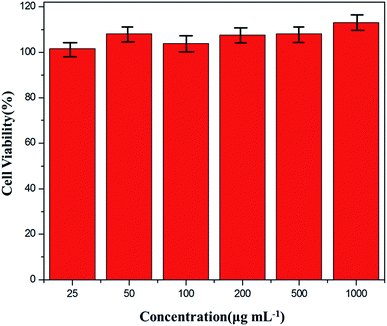 | ||
| Fig. 5 Cell viability of the La/Tm-MOF@d-SiO2 solution containing La/Tm-MOF@d-SiO2 at various concentrations. The error bar is the standard deviation of three experiments. | ||
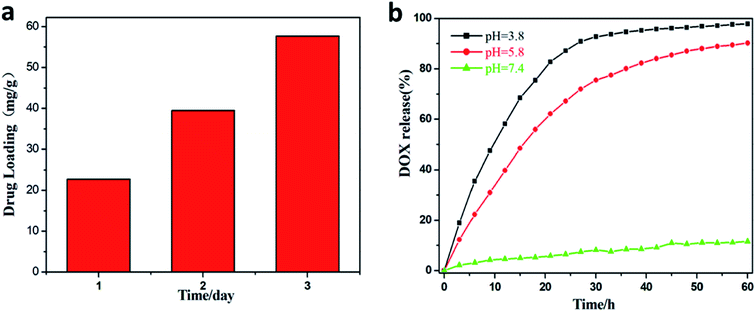
The loading and release of DOX were examined, and the results are shown in Fig. 6. The drug loadings on the first, second, and third days were 22.5 mg g−1, 40 mg g−1, and 57.5 mg g−1, respectively. In Fig. 6(b), it can be noticed that the drug is hardly released at pH = 7.4, and at pH 3.8 and 5.8, the release of the drug is very rapid. This is due to the fact that in an acidic environment, due to the protonation of the hydroxyl group of DOX and the amino group of La/Tm-MOF@d-SiO2, the hydrogen bond between DOX and the carrier is broken, and DOX is released. Therefore, La/Tm-MOF@d-SiO2 can be applied as a pH-responsive cancer drug carrier.
3.3. Upconversion fluorescence
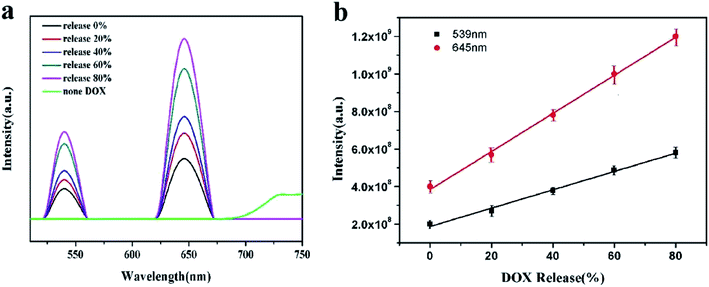
The upconversion fluorescence changes of La/Tm-MOF@d-SiO2 after drug loading are shown in Fig. 7(a). It is clear that there is no upconversion fluorescence of La/Tm-MOF@d-SiO2 at the excitation wavelength of 985 nm. After drug loading, two peaks appeared at 539 nm and 645 nm. The appearance of these peaks can be explained by the DOX-sensitized upconverted fluorescence. The mechanism is shown in Fig. S3.† After DOX loading, the interaction between –COOH of DOX and surface La3+ ions permits the transfer of excitation energy across the organic/inorganic interface. The excited sensitized La3+ then interacts with the activator Tm3+ ions to produce upconversion fluorescence via the classical energy transfer.In addition, with the release of DOX, the intensity of the upconversion fluorescence increases. The reason is mainly related to the molecular association of DOX molecules. In order to confirm our inference, the particle size of DOX under different pH conditions was examined, as shown in Fig. S4.† It can be noticed that as the pH decreases, the size of the molecules gradually decreases. The carboxyl groups in the DOX molecule can associate with each other to form a macromolecule through hydrogen bonding. When the pH value is lowered, the protonation of the hydroxyl group of DOX becomes stronger, and the number of macromolecules formed by hydrogen bonding and the particle sizes are reduced. Therefore, the interaction between –COOH of DOX and surface La3+ ions is more likely to occur and will permit the transfer of more excitation energy across the organic/inorganic interface. As a result, the intensity of the upconversion fluorescence will increase.
At pH 5.8, the DOX loaded on the amino surface of aminated porous silicon is released, and agglomeration of the DOX molecules loaded on the MOFs by hydrogen bonding weakens due to the protonation of the hydroxyl group of DOX. The longer the release time, the longer the protonation time; as a result, more doxorubicin molecules can coordinate with La3+, which is beneficial for energy transfer.
The amount of DOX released by the shell of La/Tm-MOF@d-SiO2 is proportional to the release time; therefore, a relationship between the fluorescence intensity and the amount of drug released can be established, as shown in Fig. 7(b). The release amount of DOX is positively correlated with the upconversion fluorescence intensity at 539 nm and 645 nm. The corresponding linear equations are as follows:
| I539 = 3.84 × 10⁸ + 1.015 × 10⁷ (W%) R2 = 0.99771 |
| I645 = 1.874 × 10⁸ + 4.885 × 10⁶ (W%) R2 = 0.99352 |
Therefore, the amount of drug released can be determined by the fluorescence intensity, which can be used for real-time monitoring of drug release.
4. Conclusion
In this study, cerium and lanthanum were doped into MOFs to form new mixed metal MOFs, and SiO2 was wrapped in the outer layer of MOFs and finally functionalized. The successful doping of lanthanum and cerium has been proved by scanning electron microscopy, fluorescence imaging, EDX elemental analysis and other methods. The excellent fluorescence performance provides the basis for the fluorescence imaging of MOFs. The encapsulation of the outer aminated SiO2 endows the drug carrier with not only controllable drug release, but also pH-responsive drug release under specific acidic conditions. Drug release can be monitored in real time through the change of fluorescence intensity; this provides new ideas for the treatment of cancer.Conflicts of interest
There are no conflicts to declare.Acknowledgements
This work was supported by Ministry of Education Key Laboratory for the Synthesis and Application of Organic Function Molecules.References
- Q. G. Zhao, J. Wang, Y. P. Zhang, J. Zhang, A. N. Tang and D. M. Kong, J. Mater. Chem. B, 2018, 6, 7898 RSC.
- R. Pérez-Tomás, Curr. Med. Chem., 2016, 13, 1859 CrossRef.
- A. Rousseau and P. Marquet, Fundam. Clin. Pharmacol., 2002, 16, 253 CrossRef CAS.
- Z. H. Ge, Z. L. Wang and M. J. Wei, Eur. Spine J., 2008, 17, 1482 CrossRef PubMed.
- X. G. Zhang, J. Miao, M. W. Li, S. P. Jiang, F. Q. Hu and Y. Z. Du, J. Zhejiang Univ., Sci., B, 2008, 9(6), 506 CrossRef CAS.
- H. Yu and Q. Z. Zhai, Microporous Mesoporous Mater., 2009, 123, 298 CrossRef CAS.
- K. Kataoka, A. Harada and Y. Nagasaki, Adv. Drug Delivery Rev., 2001, 47, 113 CrossRef CAS.
- D. C. Litzinger and L. Huang, Biochim. Biophys. Acta, 1922, 1113, 204 Search PubMed.
- R. Esfand and D. A. Tomalia, Drug Discovery Today, 2001, 6(8), 427 CrossRef CAS.
- B. Singco, L. H. Liu, Y. T. Chen, Y. H. Shih, H. Y. Huang and C. H. Lin, Microporous Mesoporous Mater., 2015, 8, 17 Search PubMed.
- W. H. Chen, X. Yu, W. C. Liao, Y. S. Sohn, A. Cecconello, A. Kozell, R. Nechushtai and I. Willner, Adv. Funct. Mater., 2017, 27(37), 1702102 CrossRef.
- Y. N. Liu, C. Zhang, C. Xu, C. X. Lin, K. K. Sun, J. Wang, X. L. Chen, L. Li, A. K. Whittaker and H. B. Xu, Dalton Trans., 2018, 47, 11253 RSC.
- M. H. Alkahtani, F. S. Alghannam, C. Sanchez, C. L. Gomes, H. Liang and P. R. Hemmer, Nanotechnology, 2016, 27(48), 485501 CrossRef.
- C. Y. Sun, C. Qin, C. G. Wang, Z. M. Su, S. Wang, X. L. Wang, G. S. Yang, K. Z. Shao, Y. Q. Lan and E. B. Wang, Adv. Mater., 2011, 23, 5629 CrossRef CAS PubMed.
- J. D. Rocca, D. M. Liu and W. B. Lin, Acc. Chem. Res., 2011, 44(10), 957 CrossRef PubMed.
- C. X. Lin, B. Chi, C. Xu, C. Zhang, F. Tian, Z. S. Xu, L. Li, A. K. Whittaker and J. Wang, J. Mater. Chem. B, 2019, 7, 6612 RSC.
- S. Y. Wang, L. Shan, Y. Fan, J. Jia, J. N. Xu and L. Wang, J. Solid State Chem., 2017, 245, 132 CrossRef CAS.
- X. D. Wang, R. R. Valiev, T. Y. Ohulchanskyy, H. Ågren, C. H. Yang and G. Y. Chen, Chem. Soc. Rev., 2017, 46, 4150 RSC.
- H. Y. Wang, Q. J. Lu, Y. L. Liu, H. Li, Y. Y. Zhang and S. Z. Yao, Sens. Actuators, B, 2017, 250, 429 CrossRef CAS.
- Y. J. Cheng, J. J. Hu, S. Y. Qin, A. Q. Zhang and X. Z. Zhang, Biomaterials, 2020, 232, 119738 CrossRef CAS.
- S. Angelos, M. Liong, E. Choi and J. I. Zink, Chem. Eng. J., 2008, 137, 4 CrossRef CAS.
- Y. T. Lim, J. K. Kim, Y. Noh, M. Y. Cho and B. H. Chung, Small, 2009, 5(3), 324 CrossRef CAS PubMed.
- C. X. Lin, H. L. He, Y. Q. Zhang, M. Y. Xu, F. Tian, L. Li and Y. X. Wang, RSC Adv., 2020, 10, 3084 RSC.
- X. Du, L. Xiong, S. Dai, F. Kleitz and S. Z. Qiao, Adv. Funct. Mater., 2014, 24, 7627 CrossRef CAS.
Footnote |
| † Electronic supplementary information (ESI) available. See DOI: 10.1039/d0ra06417c |
| This journal is © The Royal Society of Chemistry 2020 |

