
 Open Access Article
 This Open Access Article is licensed under a Creative Commons Attribution-Non Commercial 3.0 Unported Licence
Heteroleptic Re(CO)2+ and Re(CO)3+ complexes with α-diimines: similarities and differences in their luminescence properties
Andrzej Kapturkiewicz *,
Anna Kamecka and
Olga Grochowska
*,
Anna Kamecka and
Olga Grochowska
Institute of Chemical Sciences, Siedlce University of Natural Sciences and Humanities, 3 Maja 54, 08-110 Siedlce, Poland. E-mail: andrzej.kapturkiewicz@uph.edu.pl; Tel: +48-25-643-10-97
First published on 11th August 2020
Abstract
The photophysical properties of two series of phosphorescent rhenium(I) complexes, [Re(CO)2(N^N)(tpp)2]+ and [Re(CO)3(N^N)(tpp)]+ with carbon monoxide (CO), triphenylphosphine (tpp) and α-diimine (N^N) ligands have been investigated in deoxygenated acetonitrile solution at room temperature and in solid methanol/ethanol 1![[thin space (1/6-em)]](https://www.rsc.org/images/entities/char_2009.gif) :1 matrices at 77 K. The complexes display moderate to strong phosphorescence which is related to the N^N ligand modulated metal-to-ligand charge-transfer S0 ← 3*MLCT or intraligand S0 ← 3*LC transitions. Luminescence properties of the investigated series have been found to be very similar but some intrinsic differences between them are clearly seen. Whereas the [Re(CO)2(N^N)(tpp)2]+ series shows MLCT emission in both temperature regimes studied, the [Re(CO)3(N^N)(tpp)]+ series exhibits intrinsic changes in its emission character when the measurement temperature is lowered from 298 to 77 K. In both investigated series, their emission characteristics are strongly affected by the nature of coordinated α-diimine N^N ligands. The observed trends, changes in the radiative kr and non-radiative knr deactivation rate constants, have been compared with those found for the previously investigated [Re(CO)3(N^N)(Cl)], [Re(CO)3(N^N)(CH3CN)]+, and [Re(CO)2(N^N)(dppv)]+ series (dppv = cis-1,2-bis(diphenylphosphino)-ethene). Similarities and differences in the spectroscopic and photophysical properties of five series of the Re(CO)3+ and Re(CO)2+ complexes have been analyzed in the view of results from DFT and TD-DFT computation and the emission band-shape analyses performed according to the Marcus–Jortner formalism.
:1 matrices at 77 K. The complexes display moderate to strong phosphorescence which is related to the N^N ligand modulated metal-to-ligand charge-transfer S0 ← 3*MLCT or intraligand S0 ← 3*LC transitions. Luminescence properties of the investigated series have been found to be very similar but some intrinsic differences between them are clearly seen. Whereas the [Re(CO)2(N^N)(tpp)2]+ series shows MLCT emission in both temperature regimes studied, the [Re(CO)3(N^N)(tpp)]+ series exhibits intrinsic changes in its emission character when the measurement temperature is lowered from 298 to 77 K. In both investigated series, their emission characteristics are strongly affected by the nature of coordinated α-diimine N^N ligands. The observed trends, changes in the radiative kr and non-radiative knr deactivation rate constants, have been compared with those found for the previously investigated [Re(CO)3(N^N)(Cl)], [Re(CO)3(N^N)(CH3CN)]+, and [Re(CO)2(N^N)(dppv)]+ series (dppv = cis-1,2-bis(diphenylphosphino)-ethene). Similarities and differences in the spectroscopic and photophysical properties of five series of the Re(CO)3+ and Re(CO)2+ complexes have been analyzed in the view of results from DFT and TD-DFT computation and the emission band-shape analyses performed according to the Marcus–Jortner formalism.
Introduction
Since the pioneering work of Wrighton and Morse on the luminescent [Re(CO)3(1,10-phenathroline)(Cl)] molecule,1 rhenium(I) complexes have occupied a prominent position in organometallic luminophores with a d6 central metal ion.2–4 Among these, the [Re(CO)3(N^N)(L)]0/+ chelates have attracted special attention due to their rich excited state behaviour that can be widely tuned by modification of the main N^N or ancillary L ligands and the medium or temperature.5–12The photophysical properties of [Re(CO)3(N^N)(L)]0/+ species are governed by the relative energetic position and the interplay of the closely lying excited states of different characters. Particularly, the energy gaps between the excited 3*LC (ligand centred) and 3*MLCT (metal-to-ligand charge-transfer) triplet states are relatively small and allow efficient electronic interaction between them. The excited states of the fac-Re(CO)3+ complexes are mixed and their “real” excited states can be regarded as a superposition of the initial “pure” 3*MLCT and 3*LC components. This leads to monotonic changes in the nature of these emitters from the excited 3*MLCT to 3*LC character when appropriate changes of N^N and/or L ligands are involved. Consequently, the spectroscopic and photophysical properties of [Re(CO)3(N^N)(L)]0/+ complexes may be quite different, even for pretty similar N^N and/or L ligands present in their structures. This is because energies of the “pure” excited 3*LC and 3*MLCT states are affected in different ways.
The above-described behaviour is generally characteristic for many other transition metal complexes consisting d6 ions and N^N ligands13,14 including much less elaborated cis-Re(CO)2+ complexes15–20 as well. The latter, containing monodentate PR3 or bidentate P^P phosphines as ancillary ligands in their [Re(CO)2(N^N)(PR3)2]+ or [Re(CO)2(N^N)(P^P)]+ structures, are emissive in the spectral range consistent with the emission range observed for analogous [Re(CO)3(N^N)(Cl)] complexes. Their emissive properties, however, are noticeably better (higher quantum yields ϕem and longer lifetimes τem of emission) as compared to those found for their [Re(CO)3(N^N)(Cl)] analogues. Thus, the Re(CO)2+ based luminophores can be considered as very promising alternative in a wide range of applications in which the Re(CO)3+ chelates have been already applied. Among them, the most noticeable examples include photocatalysis,21–23 luminescent sensors,24–26 organic light emitting devices27 or dye-sensitized solar cell.28
Luminescence properties of the [Re(CO)2(N^N)(P^P)]+ series20 bearing cis-1,2-bis(diphenylphosphino)-ethene – dppv and different α-diimines as P^P and N^N ligands, have been recently studied in more detail. It has been found that the radiative as well as nonradiative deactivation processes of the excited 3*[Re(CO)2(N^N)(dppv)]+ states are considerably suppressed as compared to the 3*[Re(CO)3(N^N)(Cl)] ones.12 This results in longer τem values and, due to still more pronounced suppression of the nonradiative deactivation, in definitely higher quantum yields ϕem. The observed changes in the τem and ϕem values were found to be connected with lowering of the rate constants describing the radiative kr = ϕem/τem and nonradiative knr = (1 − ϕem)/τem deactivation of the excited 3*MLCT states. This can be attributed to the presence of P^P ligand or/and smaller number of CO group (two instead of three) in the previously investigated [Re(CO)2(N^N)(dppv)]+ complexes. To clarify the occurring issue we have decided to perform a more systematic, comparative study of luminescent Re(CO)3+ and Re(CO)2+ complexes bearing different α-diimine N^N (cf. Fig. 1) and triphenylphosphine – tpp ligands. For the studies reported here, two series of Re(I) chelates, [Re(CO)3(N^N)(tpp)]+ and [Re(CO)2(N^N)(tpp)2]+ were selected because their emission spectral ranges are expected matching these characteristic for their [Re(CO)2(N^N)(dppv)]+, [Re(CO)3(N^N)(Cl)] or [Re(CO)3(N^N)(CH3CN)]+ analogues.12,16,20
 | ||
| Fig. 1 Structures of N^N ligands investigated and their acronyms used in the text. 2,2′-Bipyridine – bpy, and 4,4′-di-tert-butyl-2,2′-bipyridyne – dtbbpy, 1,10-phenanthroline – phen, 2,9-dimethyl-1,10-phenanthroline – 29dmphen, 4,7-dimethyl-1,10-phenanthroline – 47dmphen, 3,4,7,8-tetramethyl-1,10-phenanthroline – tmphen, 5,6-dimethyl-1,10-phenanthroline – 56dmphen, and 4,7-diphenyl-1,10-phenathroline – dpphen, respectively. | ||
Investigations reported in this paper are also devoted to the relationships between the nature of the given MLCT emitter and the kr or knr rate constants characterizing the radiative and non-radiative S0 ← 3*MLCT transitions in the α-diimine complexes. The experimentally observed huge variety in the kr and knr values16,20,29–31 are explainable by the N^N ligand induced changes in the electronic structure of these emitters from the 3*MLCT to more pronounced 3*LC character reflecting different mixing between the “pure” excited LC and MLCT configurations. Within this approximation, one can discuss the anticipated mixing taking into account the states energetically closest. In the simplest case, one can assume that the triplet 3*MLCT configuration interacts with the lowest excited triplet state 3*LC, typically localized within the N^N ligand. Due to the mixing between the “pure” 3*MLCT and 3*LC states, one can describe the resulting “real” emissive state as their superposition with the mixing coefficients cMLCT and cLCT
 | (1) |
Despite of all its approximation, the LC/MLCT mixing approach seems to be applicable in any more quantitative discussion of the luminescent 3*MLCT states including interpretation of the N^N ligand induced changes of the kr and knr values. In the presented work, this has been tested for the [Re(CO)2(N^N)(tpp)2]+ and [Re(CO)3(N^N)(tpp)]+ complexes. The obtained results have been compared with those previously obtained for the [Re(CO)3(N^N)(Cl)], [Re(CO)3(N^N)(CH3CN)]+, and [Re(CO)2(N^N)(dppv)]+ complexes. Spectroscopic and photophysical properties of five series of the Re(CO)3+ and Re(CO)2+ complexes are discussed in the view of their emission band-shape analysis. This work presents also the results from DT and TD-DFT computation performed to clarify the observed similarities and differences.
Results and discussion
S0 → 1*MLCT absorption and S0 ← 3*MLCT/3LC emissions
Fig. 2 and 3 present examples of the room temperature absorption spectra of the studied complexes recorded in acetonitrile solutions. The spectra show superposition of the overlapping bands as characteristic for the transition metal complexes exhibiting typical MLCT features. Whereas, the high-energy bands can be ascribed to the π → π* transitions localized within ligands attached to the central Re(I) core, the lowest energy bands with relatively low intensities can be attributed to the MLCT transitions. Generally, the spectra are very similar to those characterizing other Re(I) complexes with chelating α-diimine ligands. More specifically, the UV-vis spectra characterizing the studied [Re(CO)2(N^N)(tpp)2]+ chelates correspond well to their [Re(CO)2(N^N)(dppv)]+ analogues,20 whereas the [Re(CO)3(N^N)(tpp)]+ complexes exhibit features closer to that found for their [Re(CO)3(N^N)(CH3CN)]+ counterparts.12 This is reasonable because the spectrochemical parameters of tpp and CH3CN ligands are very close one to another.33 The same explanation holds for tpp and dppv ligands that explains resemblances between [Re(CO)3(N^N)(tpp)]+ and [Re(CO)2(N^N)(dppv)]+ series. Additionally, the positions of the CO and phosphine ligands in the spectrochemical series explain the observed bathochromic shift of the MLCT absorption and emission bands between the Re(CO)3+ and Re(CO)2+ complexes reported in this work (cf. data in Table 1). | ||
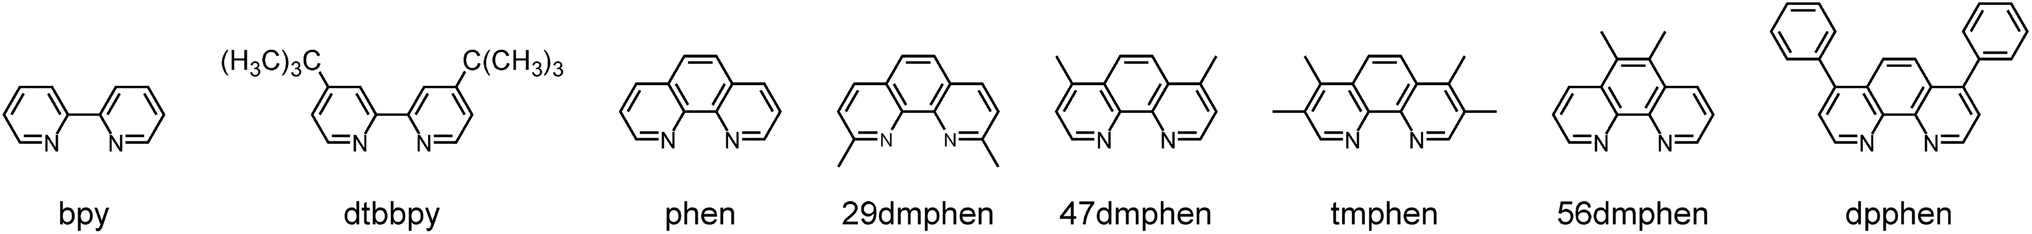
| Fig. 2 Band profiles of the UV-vis absorption and emission spectra recorded for the [Re(CO)2(47dmphen)(tpp)2]+ (top) and [Re(CO)3(47dmphen)(tpp)]+ (bottom) complexes. Room temperature absorption (black lines) in CH3CN solutions. Room temperature (red lines) and 77 K (blue lines) emission in CH3CN solutions and 1:1 CH3OH/C2H5OH matrices, respectively. Dashed lines present expanded the low energy part of the UV-vis absorption. | ||
 | ||
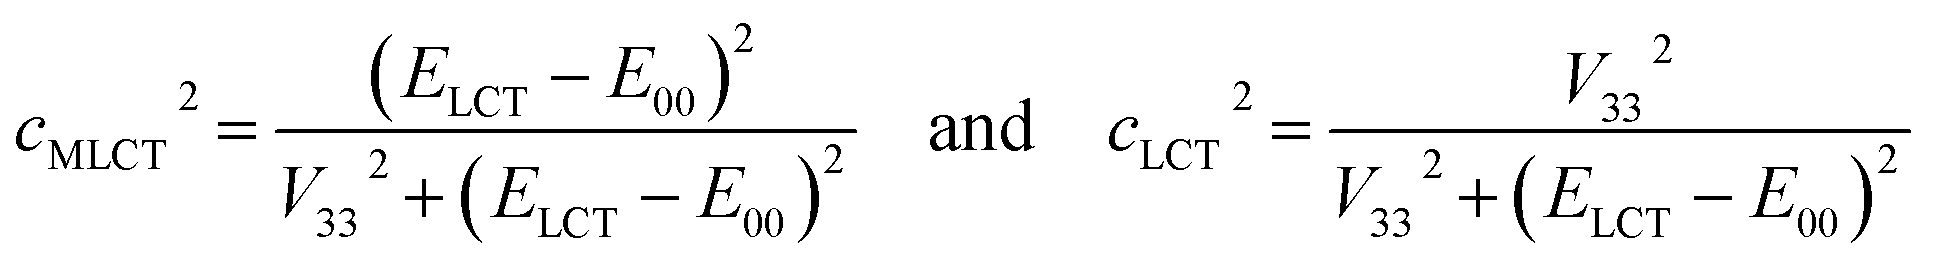
| Fig. 3 Band profiles of the UV-vis absorption and emission spectra recorded for the [Re(CO)2(bpy)(tpp)2]+ (top) and [Re(CO)3(bpy)(tpp)]+ (bottom) complexes. Room temperature absorption (black lines) in CH3CN solutions. Room temperature (red lines) and 77 K (blue lines) emission in CH3CN solutions and 1:1 CH3OH/C2H5OH matrices, respectively. Dashed lines present expanded the low energy part of the UV-vis absorption. | ||
:1 glasses at 77 K). Absorption maxima ![[small nu, Greek, tilde]](https://www.rsc.org/images/entities/i_char_e0e1.gif) maxabs and molar extinction coefficients εM of MLCT bands. Emission maxima maxem, emission quantum yields ϕem, and emission lifetimes τem of S0 ← T1 transitions
maxabs and molar extinction coefficients εM of MLCT bands. Emission maxima maxem, emission quantum yields ϕem, and emission lifetimes τem of S0 ← T1 transitions
| Ligand N^N | Absorption at 298 K | Emission at 298 K | Emission at 77 K | ||||
|---|---|---|---|---|---|---|---|
| maxabs/cm−1 |
εM/M−1 cm−1 | maxem/cm−1 |
ϕem | τem /μs | maxem/cm−1 |
τem/μs | |
| a For [Re(CO)3(phen)(tpp)]+ and [Re(CO)3(dpphen)(tpp)]+ complexes bi-exponential emission decays were observed. Values given in parentheses are the normalized amplitudes of the short-lived and long-lived components of emission decays. | |||||||
| [Re(CO)2(tmphen)(tpp)2]+ | 27050 |
5.6 × 10³ | 17100 |
0.52 | 21.6 | 18450 |
38 |
| [Re(CO)2(47dmphen)(tpp)2]+ | 26300 |
5.0 × 10³ | 17000 |
0.33 | 10.4 | 18050 |
31 |
| [Re(CO)2(29dmphen)(tpp)2]+ | 25000 |
2.7 × 10³ | 15950 |
0.045 | 0.43 | 17600 |
7.5 |
| [Re(CO)2(phen)(tpp)2]+ | 27050 |
3.8 × 10³ | 16150 |
0.20 | 4.6 | 17800 |
22 |
| [Re(CO)2(56dmphen)(tpp)2]+ | 24250 |
3.9 × 10³ | 16200 |
0.19 | 3.7 | 18050 |
18 |
| [Re(CO)2(dpphen)(tpp)2]+ | 23250 |
7.1 × 10³ | 15700 |
0.24 | 6.8 | 16950 |
25 |
| [Re(CO)2(dtbbpy)(tpp)2]+ | 24950 |
3.5 × 10³ | 16100 |
0.080 | 0.95 | 18200 |
15 |
| [Re(CO)2(bpy)(tpp)2]+ | 24250 |
2.8 × 10³ | 15950 |
0.042 | 0.63 | 17950 |
15 |
| [Re(CO)3(tmphen)(tpp)]+ | 27050 |
2.8 × 10³ | 20550, 19350 |
0.070 | 19.9 | 21200, 19750, 18400, 16950 |
480 |
| [Re(CO)3(47dmphen)(tpp)]+ | 27050 |
4.7 × 10³ | 19300 |
0.083 | 9.8 | 21200, 19850, 18450, 17100 |
430 |
| [Re(CO)3(29dmphen)(tpp)]+ | 26600 |
2.4 × 10³ | 19100 |
0.071 | 2.6 | 21450, 20250 |
41 |
| [Re(CO)3(phen)(tpp)]+ | 27050 |
3.3 × 10³ | 18800 |
0.088 | 2.3 | 21600, 20150, 18800 |
42 (0.63), 156 (0.37)a |
| [Re(CO)3(56dmphen)(tpp)]+ | 25850 |
3.1 × 10³ | 19800, 18800 |
0.12 | 56 | 20550, 19200, 17800 |
890 |
| [Re(CO)3(dpphen)(tpp)]+ | 26050 |
6.0 × 10³ | 17650 |
0.36 | 45 | 19750, 18550 |
70 (0.70), 160 (0.30)a |
| [Re(CO)3(dtbbpy)(tpp)]+ | 29050 |
4.0 × 10³ | 18800 |
0.040 | 0.17 | 22400, 21150, 19990 |
13 |
| [Re(CO)3(bpy)(tpp)]+ | 28750 |
3.5 × 10³ | 18400 |
0.040 | 0.29 | 22200, 20700, 19500 |
8.6 |
Both series compared above are similar one to another in quantitative way as well. Although, due to the presence of the overlapping of many intra-ligand bands the high-energy parts of the recorded spectra are barely informative, one can draw some decisive conclusions comparing MLCT regions. Particularly, the overall MLCT intensities are very similar for the given N^N ligand and nearly independent of the remaining ligands attached to the central Re(I) ion (cf. Fig. 4). Fig. 4 presents data for the [Re(CO)2(N^N)(tpp)2]+ and [Re(CO)3(N^N)(tpp)]+ series, but nearly the same relationship between the molar extinction coefficients εM is characteristic for [Re(CO)3(N^N)(Cl)] and [Re(CO)2(N^N)(dppv)]+ pair. Although the above examples concern complexes with sufficient separation of the MLCT and the intra-ligand absorption bands, similar situation seems to take place also for these α-diimine Re(I) complexes, [Re(CO)3(N^N)(CH3CN)]+, where their MLCT bands are partly obscured by the intra-ligand absorption. Thus, one can emphasize very similar intensities of the MLCT absorption band as the characteristic feature of the Re(CO)3+ as well as Re(CO)2+ complexes.
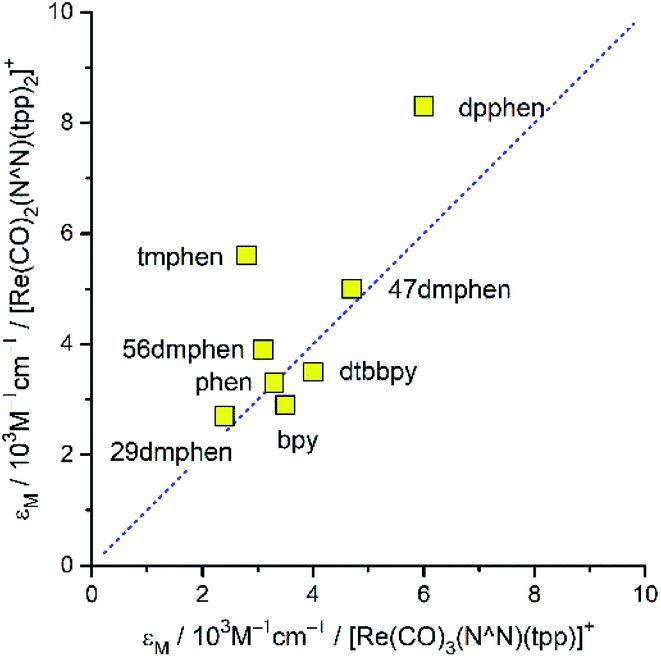 | ||
| Fig. 4 Relation between the values of the molar extinction coefficients characterizing the MLCT band in the UV-vis absorption spectra of the [Re(CO)3(N^N)(tpp)]+) and [Re(CO)2(N^N)(tpp)2]+ complexes in CH3CN solutions. Experimental points are labelled with the N^N ligand abbreviations. The slope and intercept of the dashed line are equal to 1 and 0, respectively. | ||
Although, due to overlapping MLCT and LC bands, a quantitative characterization of the MLCT bands intensities is rather difficult, some estimates are possible taking into account the spectral positions maxabs and spectral width Δ1/2 of these bands. Using so-called the “lazy man's” approximation34,35 one can approximately evaluate “effective” values of the transition dipole moments Mabs describing these bands from the respective extinction coefficient εM data. In nice accordance with the observed similar MLCT bands intensities, a quite small variation of the Mabs values is characteristic for the Re(I) complexes with α-diimine ligands. In most cases, the obtained Mabs values fall into the range of 1.5–2.5 D, somewhat larger Mabs ∼ 3.0 D are characteristic only for the complexes with dpphen ligand. This finding implies nearly constant sum of oscillator strengths f of all S0 → MLCT transitions potentially contributing to the MLCT bands of the discussed Re(I) complexes. One can rationalize the ∑f = const claim assuming that the sum of the oscillator strength of the individual d → *π transitions (dxy → *π, dxz → *π, etc.) is constant as well. Then, independently how the given d orbital(s) will contribute to the occupied molecular orbitals involved in the transitions consisting the MLCT band (HOMO, HOMO−1, etc.), one can expect very similar values of its overall intensity. This expectation is also valid when the configuration interactions would be required for the proper description of the individual MLCT transitions. In the case of discussed Re(I) complexes it seems to be obvious that their UV-vis spectroscopic properties are connected with the presence of low energetically lying 1*MLCT states. Results from the DFT and TD-DFT computations, performed for the ground state optimized geometries (vide infra), confirm this anticipation without any doubts.
All of the Re(I) complexes under study are luminescent both at room temperature and at 77 K. The luminescence spectra recorded for deaerated solutions in CH3CN at 298 K are typically broad and, in most cases, show no vibronic structure. The spectral positions of the emission bands depend on the nature of the N^N ligand present in the structures of the studied [Re(CO)2(N^N)(tpp)2]+ as well as [Re(CO)3(N^N)(tpp)]+ series (cf. data in Table 1). The observed trends in the emission maxima follow that expected for the S0 ← 3*MLCT transitions taking into accounts changes in the electron withdrawing properties of the coordinated N^N ligand. These changes, caused by the presence of the methyl (electron donor) or the phenyl (electron acceptor) substituents attached to the parent phen or bpy ligands, lead to hypsochromic or bathochromic shifts of the emissions, respectively.
Intrinsic differences are, however, characteristic for the emission recorded at 77 K in the CH3OH/C2H5OH matrices. The investigated [Re(CO)2(N^N)(tpp)2]+ complexes exhibit broad and structureless bands. The observed hypsochromic shift allows concluding destabilization of the emissive 3*MLCT states caused by hindered solvent/solute relaxation caused by the extreme viscosity of the low temperature glasses.36,37 The studied [Re(CO)3(N^N)(tpp)]+ complexes demonstrate, however, distinctly different 77 K behaviour exhibiting nicely structured emission bands. Their positions and shapes resemble emissions from the isolated N^N ligands.38–40 Thus, the observed rigidochromism can be related to the temperature induced changes in the nature of the emissive 3*[Re(CO)3(N^N)(tpp)]+ species, from the excited 3*MLCT to the excited intra-ligand 3*LC.
Similarly, as it can be seen in the UV-vis absorption spectra, the emissive properties of the [Re(CO)2(N^N)(tpp)2]+ and [Re(CO)3(N^N)(tpp)]+ complexes depend on the nature of the N^N ligand present in their structure. This is particularly true for the kinetic parameters associated with the radiative and non-radiative deactivations of the excited 3*[Re(CO)2(N^N)(tpp)2]+ and 3*[Re(CO)3(N^N)(tpp)]+ species (cf. data in Table 2). The rate constants for these processes, determined from kr = ϕem/τem and knr = (1 − ϕem)/τem relationships, exhibit large diversity, much larger as compared to the variations of the εM values. This is also true for the transition dipole moments Mem of the S0 ← 3*MLCT emissions as determined using the following relationship
|
kr = (16π3/3hεo)(nmaxem)3|Mem|2
| (2) |
| Ligand N^N | Kinetic parameters | Energetic parameters (from band-shape analysis) | ||||||||
|---|---|---|---|---|---|---|---|---|---|---|
| knr/s−1 | kr/s−1 | Mem/D | V30/eV | E00/eV | λLM/eV | λH/eV | hνH/eV | knr/s−1 (calc)a | ||
| a knr values calculated using E00, λLM, λH, and hνH parameters from performed emission band-shape analyses and V30 values as estimated using the Hush–Mulliken relationship V30 = hcmaxemMem/Δμ. |
||||||||||
| [Re(CO)2(tmphen)(tpp)2]+ | 2.2 × 10⁴ | 2.4 × 10⁴ | 0.08 | 0.011 | 2.23 | 0.28 | 0.22 | 0.15 | 3.1 × 10³ | |
| [Re(CO)2(47dmphen)(tpp)2]+ | 6.4 × 10⁴ | 3.2 × 10⁴ | 0.09 | 0.013 | 2.20 | 0.31 | 0.20 | 0.17 | 7.1 × 10⁴ | |
| [Re(CO)2(29dmphen)(tpp)2]+ | 2.2 × 10⁶ | 1.0 × 10⁵ | 0.18 | 0.024 | 2.04 | 0.38 | 0.18 | 0.20 | 2.7 × 10⁶ | |
| [Re(CO)2(phen)(tpp)2]+ | 1.7 × 10⁵ | 4.3 × 10⁴ | 0.12 | 0.015 | 2.04 | 0.40 | 0.16 | 0.19 | 2.2 × 10⁵ | |
| [Re(CO)2(56dmphen)(tpp)2]+ | 2.2 × 10⁵ | 5.1 × 10⁴ | 0.13 | 0.017 | 2.07 | 0.37 | 0.17 | 0.18 | 1.3 × 10⁵ | |
| [Re(CO)2(dpphen)(tpp)2]+ | 1.1 × 10⁵ | 3.5 × 10⁴ | 0.11 | 0.014 | 2.00 | 0.35 | 0.18 | 0.17 | 1.6 × 10⁵ | |
| [Re(CO)2(dtbbpy)(tpp)2]+ | 9.7 × 10⁵ | 8.4 × 10⁴ | 0.16 | 0.022 | 2.08 | 0.41 | 0.20 | 0.18 | 1.0 × 10⁶ | |
| [Re(CO)2(bpy)(tpp)2]+ | 1.5 × 10⁶ | 6.7 × 10⁴ | 0.15 | 0.019 | 2.02 | 0.43 | 0.18 | 0.19 | 1.1 × 10⁶ | |
| [Re(CO)3(tmphen)(tpp)]+ | 4.7 × 10⁴ | 3.5 × 10³ | 0.03 | 0.004 | 2.55 | 0.11 | 0.28 | 0.17 | 3.6 × 10² | |
| [Re(CO)3(47dmphen)(tpp)]+ | 9.4 × 10⁴ | 8.5 × 10³ | 0.04 | 0.006 | 2.53 | 0.12 | 0.30 | 0.16 | 9.5 × 10² | |
| [Re(CO)3(29dmphen)(tpp)]+ | 3.6 × 10⁵ | 2.7 × 10⁴ | 0.07 | 0.011 | 2.41 | 0.38 | 0.20 | 0.22 | 7.1 × 10⁴ | |
| [Re(CO)3(phen)(tpp)]+ | 4.0 × 10⁵ | 3.8 × 10⁴ | 0.09 | 0.014 | 2.37 | 0.38 | 0.20 | 0.23 | 3.3 × 10⁵ | |
| [Re(CO)3(56dmphen)(tpp)]+ | 1.6 × 10⁴ | 2.1 × 10³ | 0.02 | 0.003 | 2.47 | 0.12 | 0.25 | 0.17 | 1.6 × 10² | |
| [Re(CO)3(dpphen)(tpp)]+ | 1.4 × 10⁴ | 8.0 × 10³ | 0.04 | 0.006 | 2.33 | 0.19 | 0.28 | 0.17 | 1.9 × 10⁴ | |
| [Re(CO)3(dtbbpy)(tpp)]+ | 5.6 × 10⁶ | 2.4 × 10⁵ | 0.22 | 0.036 | 2.39 | 0.42 | 0.24 | 0.22 | 5.3 × 10⁶ | |
| [Re(CO)3(bpy)(tpp)]+ | 3.3 × 10⁶ | 1.4 × 10⁵ | 0.17 | 0.025 | 2.35 | 0.43 | 0.23 | 0.22 | 2.8 × 10⁶ | |
Analysing more deeply the room temperature data for the [Re(CO)2(N^N)(tpp)2]+ and [Re(CO)3(N^N)(tpp)]+ complexes, one can see intrinsic correlation between the determined kr and knr rate constants. Monotonic relationships between these rate constants (cf. Fig. 5) are characteristic for the excited triplet 3*[Re(CO)2(N^N)(tpp)2]+ and 3*[Re(CO)3(N^N)(tpp)]+ states. Very likely, such behaviour, reported previously for other Re(I) complexes,12,20 seems to be a general rule for the α-diimine chelates of Re(CO)3+ and Re(CO)2+ ions. Although the experimental points are somewhat scattered, the found coincidences between knr and kr values allow concluding that all three discussed series of the Re(CO)3+ complexes (with tpp, CH3CN, and Cl− ancillary ligands) are very similar to each other. In an analogous way, one can also postulate close analogy between two [Re(CO)2(N^N)(tpp)2]+ and [Re(CO)2(N^N)(dppv)]+ series.
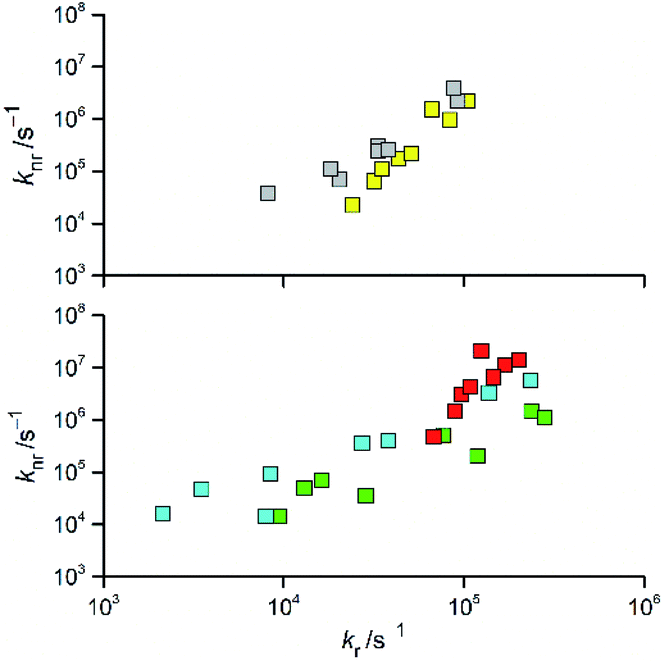 | ||
| Fig. 5 Relations between the values of kr and knr rate constants for the Re(CO)2+ (top) and Re(CO)3+ (bottom) complexes. Data for [Re(CO)2(N^N)(tpp)2]+ (yellow symbols), [Re(CO)2(N^N)(dppv)]+ (grey symbols),20, [Re(CO)3(N^N)(tpp)]+ (cyan symbols), [Re(CO)3(N^N)(CH3CN)]+ (green symbols),12 and [Re(CO)3(N^N)(Cl)] (red symbols)12 complexes in CH3CN solutions at room temperature. | ||
Band-shape analysis of the S0 ← 3*MLCT emission spectra
The observed kr vs. knr relations point to noticeable association between the radiative and non-radiative S0 ← 3*MLCT processes as specific for the discussed Re(I) complexes. This finding remains consistent with that expected from close relation between the thermal and optical charge-transfers occurring in so-called inverted Marcus region where these processes are bound one to another. Pursuing the close analogy between them, one can relate their kinetic description to the same set of the energetic parameters associated with the radiative and nonradiative S0 ← 3*MLCT transition.For more quantitative description of these processes one can use a commonly accepted formalism introduced by Marcus41–43 and developed further by many other authors.44,45 A moderately simple approach, based on the separation of low frequency λL, medium frequency λM and high frequency λH reorganization energies allows the description of the charge-transfer emission profile, i.e., the emission intensity I(em) vs. the emitted photon energy hcem. In the case of the transition metal complexes exhibiting the MLCT emission, the λM and λH energies are mainly connected with changes of the intra-ligand and the ligand–metal bonds, whereas the λL energy is mostly associated with the solvent shell reorganization. When the semi-classical treatment of the medium-frequency modes together with the classical and quantum treatment of the low frequency and the high frequency modes are applied,32,46 the following expression can be obtained
 | (3) |
Within the same framework, the values of knr rate constants are predictable from the following expression29,47,48
 | (4) |
The λLM term present in eqn (3) and (4), contain contributions from the low frequency (treated classically) and medium frequency (treated semi-classically) reorganization energies. Within these assumptions, one can approximate the resulting effective λLM value as follows32,48
| λLM = λL + λM(hνM/2kBT)coth(hνM/2kBT) | (5) |
Representative examples of the numerical fits, presented in Fig. 6, show that, despite all approximations of the single frequency model applied, one can reproduce quite well the experimental emission profiles of the studied complexes. Emission spectra of the complexes under investigations were fitted by the application of a one-mode Franck–Condon analysis according to eqn (3) with the quantities relevant for their radiative charge-transfer (i.e., E00, λLM, λH, and hνH summarized in Table 2) varied as free fit parameters. It should be noted, however, that the fitted quantities turn out to be somewhat correlated. This leads to numerical uncertainty (±0.02 eV) of their fitted values. Due to approximate character of the applied model, the real uncertainty of the fitted parameters can be slightly larger. Despite that, the obtained energetic quantities give somewhat deeper insight into the nature of the emissive 3*MLCT species.
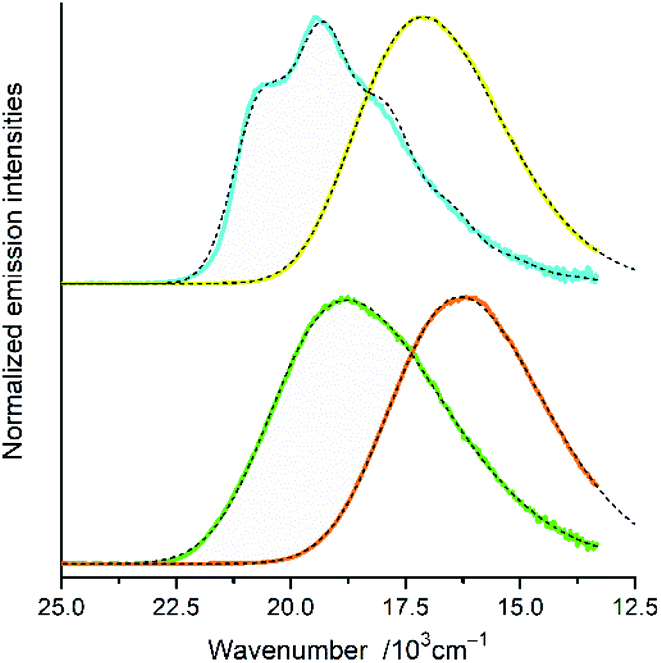 | ||
| Fig. 6 Band profiles of the emission spectra recorded for the [Re(CO)2(tmphen)(tpp)2]+ (yellow line), [Re(CO)2(dtbbpy)(tpp)2]+ (orange line), [Re(CO)3(tmphen)(tpp)]+ (cyan lines), and [Re(CO)3(dtbbpy)(tpp)2]+ (green line), complexes in CH3CN solutions at room temperature. Dashed black lines correspond to the numerical fits according to eqn (5). | ||
In the fitting procedure as used in this work, the applied classical, semi-classical and quantum-mechanical treatment of the low, medium and high frequency modes seems to be justified in the cases of 298 K emissions. One can additionally check this anticipation because the same set of parameters is, according to eqn (4), related to the rate constants of the non-radiative S0 ← 3*MLCT transitions. Thus, one can additionally test the data from band-shape analyses by comparing the experimentally found rate constants knr with those calculated using eqn (4). Such calculations are possible because one can deduce the required V30 values from the experimentally available values of the MLCT emission maxima maxem and the transition dipole moments Mem. Without going into details of the interaction between the coupled S0 and 3*MLCT states, one can estimate the V30 values using the Mulliken–Hush relationship49–52
 | (6) |
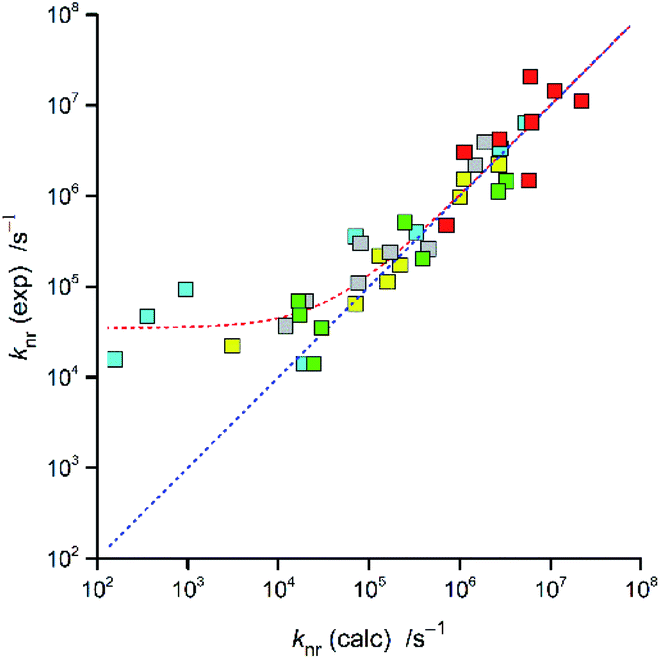
In the case of the discussed Re(I) complexes, one can approximate required Δμ value assuming the whole electron transfer over the distance between the central Re(I) ion and the centre of N^N ligands. Within this approach, one can obtain Δμ = 15 D. Similarly, as it was done in our previous works, this quite reasonable value53,54 was used for estimation of the V30 terms. The obtained V30 values together with the resulted knr rate constants are collected in Table 2. The agreement between the experimentally found and calculated rate constants knr is more than satisfactory for nearly all Re(I) complexes discussed in this work (cf. Fig. 7). In these cases, the discrepancies between the experimentally found and computed values do not exceed a factor of 3–4.
 | ||
| Fig. 7 Relationship between the calculated and experimentally found knr values for the Re(CO)2+ and Re(CO)3+ complexes. Data for [Re(CO)2(N^N)(tpp)2]+ (yellow symbols), [Re(CO)2(N^N)(dppv)]+ (grey symbols),20, [Re(CO)3(N^N)(tpp)]+ (cyan symbols), [Re(CO)3(N^N)(CH3CN)]+ (green symbols),12 and [Re(CO)3(N^N)(Cl)] (red symbols)12 complexes in CH3CN solutions at room temperature. | ||
For some of the [Re(CO)3(N^N)(tpp)]+ complexes (with 47dmphen, 56dmphen, and tmphen ligands) one can see, however, significant discrepancy between the calculated and experimentally found knr values. In the case of these complexes, their largest E00 values may suggest the presence of an additional, thermally activated non-radiative deactivation channel. More specifically, the presence of the excited metal-centred 3*MC state, often contributing to the non-radiative deactivation,55,56 might be operative. However, one can eliminate this option because the expected energy splitting of the Re(I) d and *d orbitals as high as ca. 4 eV can be estimated using the spectrochemical parameters of the ligand present in the [Re(CO)3(N^N)(tpp)]+ complexes. This precludes possible 3*MLCT → 3*MC → S0 deactivation path due to enough large energy gap between the 3*MLCT and 3*MC states. Thus, further work seems to be necessary for any convincing explanation of the appearing issue. Until yet the most of the MLCT emitters analysed as descried above belong to the cMLCT > cLCT class, only for very few examples reported in this work cMLCT ≈ cLCT could be anticipated (vide infra). Therefore, any more systematic data for the MLCT emitters with cMLCT < cLCT would be particularly interesting.
For the complexes under study, the E00 energies found, as expected, depend on the nature of N^N ligand. Smaller E00 values are characteristic for the N^N ligands with stronger electron withdrawing properties. Generally, as it could be expected, the E00 values for the [Re(CO)3(N^N)(tpp)]+ complexes are larger (by ca. 0.30 eV) than those characterizing their [Re(CO)2(N^N)(tpp)2]+ analogues. The fitted hνH values in the range of 0.15–0.23 eV correspond well to averaged contributions from the vibrational modes of the N![[double bond, length as m-dash]](https://www.rsc.org/images/entities/char_e001.gif) C, CC, and C
C, CC, and C![[triple bond, length as m-dash]](https://www.rsc.org/images/entities/char_e002.gif) O bonds stretching in the N^N diimine (1200–1600 cm−1) and CO (1850–2050 cm−1) ligands, correspondingly. For the [Re(CO)2(N^N)(tpp)2]+ complexes, the hνH values (0.15–0.20 eV) are somewhat smaller as compared with their [Re(CO)3(N^N)(tpp)]+ analogues (0.16–0.23 eV). In a similar way, the λH values (0.20–0.30 eV) found for the [Re(CO)3(N^N)(tpp)]+ complexes are somewhat larger than those characterizing their [Re(CO)2(N^N)(tpp)2]+ counterparts (0.16–0.22 eV). One can tentatively attribute the observed differences in the fitted λH and hνH values to reorganization of two or three CO bonds. The found differences in the λH and hνH values explain the experimentally observed differences in the τem values for the Re(CO)2+ and Re(CO)3+ series. The longer τem values characteristic for the Re(CO)2+ complexes are evidently connected with suppression of the knr rate constants caused, in the way characteristic for the inverted Marcus region, by smaller λH and hνH values.
O bonds stretching in the N^N diimine (1200–1600 cm−1) and CO (1850–2050 cm−1) ligands, correspondingly. For the [Re(CO)2(N^N)(tpp)2]+ complexes, the hνH values (0.15–0.20 eV) are somewhat smaller as compared with their [Re(CO)3(N^N)(tpp)]+ analogues (0.16–0.23 eV). In a similar way, the λH values (0.20–0.30 eV) found for the [Re(CO)3(N^N)(tpp)]+ complexes are somewhat larger than those characterizing their [Re(CO)2(N^N)(tpp)2]+ counterparts (0.16–0.22 eV). One can tentatively attribute the observed differences in the fitted λH and hνH values to reorganization of two or three CO bonds. The found differences in the λH and hνH values explain the experimentally observed differences in the τem values for the Re(CO)2+ and Re(CO)3+ series. The longer τem values characteristic for the Re(CO)2+ complexes are evidently connected with suppression of the knr rate constants caused, in the way characteristic for the inverted Marcus region, by smaller λH and hνH values.
For both investigated series, the fitted λLM energies depend on the ELCT − E00 energy gap. The larger the ELCT − E00 term, the larger is the λLM value. The observed trends can be rationalized taking into account the electronic structures of the 3*[Re(CO)2(N^N)(tpp)2]+ and 3*[Re(CO)3(N^N)(tpp)]+ emitters. The smaller the ELCT − E00 term, the larger contribution of the “pure” 3*LC to the wave function of the given emitter is expected. Assuming that the λLM energy is mostly connected with the amount of the “pure” 3*MLCT contribution to the observed “real” 3*MLCT state, one can obtain the following expression
 | (7) |
For the [Re(CO)2(N^N)(tpp)2]+ and [Re(CO)3(N^N)(tpp)]+ series of the Re(I) complexes, the λLM values were fitted according to eqn (7) using λ0LM and V33 as free fit parameters with obtaining good agreement between the experimental and fitted values (cf. Fig. 8). Whereas similar λ0LM values, 0.52 and 0.50 eV are characteristic for the [Re(CO)3(N^N)(tpp)]+ and [Re(CO)2(N^N)(tpp)2]+ series, the fitted V33 values (0.16 and 0.25 eV, respectively) are distinctly different. Such difference in the V33 values seems to be a general rule for the Re(CO)3+ and Re(CO)2+ complexes (cf. data in Table 3). The fits performed according to eqn (7) were done assuming V33 = const within the given complex series. Thus, one should treat the obtained parameters fit parameters as an averaged V33 and λ0LM values.
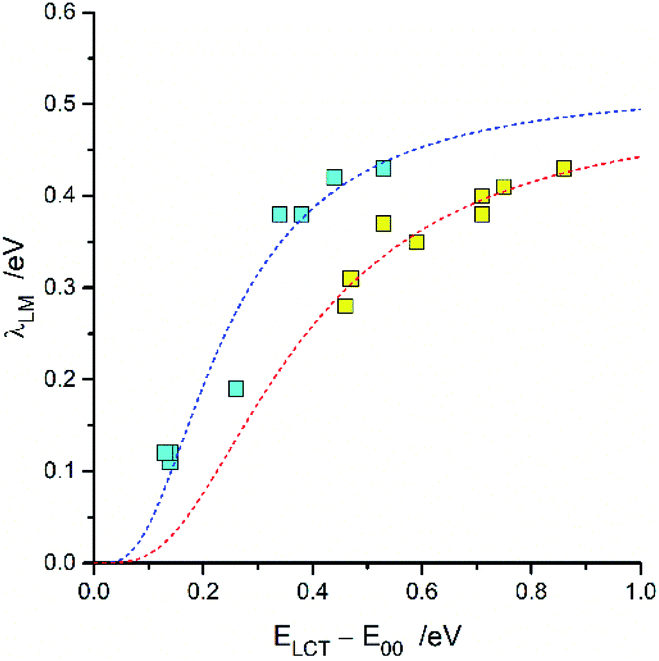 | ||
| Fig. 8 Relationship between the λLM and ELCT − E00 terms for [Re(CO)2(N^N)(tpp)2]+ (yellow symbols) and [Re(CO)3(N^N)(tpp)]+ (cyan symbols) complexes in CH3CN solutions at room temperature. Dashed curves present fits according to eqn (7). | ||
| Complex series | λ0LM | V33 |
|---|---|---|
| a V33 and λ0LM values for the [Re(CO)3(N^N)(Cl)], [Re(CO)3(N^N)(CH3CN)]+, and [Re(CO)2(N^N)(dppv)]+ series obtained analysing previously published data.12,20 | ||
| [Re(CO)2(N^N)(tpp)2]+ | 0.50 | 0.25 |
| [Re(CO)2(N^N)(dppv)]+ | 0.48 | 0.26 |
| [Re(CO)3(N^N)(Cl)] | 0.52 | 0.13 |
| [Re(CO)3(N^N)(CH3CN)]+ | 0.39 | 0.11 |
| [Re(CO)3(N^N)(tpp)]+ | 0.52 | 0.16 |
Similarly to the observed variety of the λLM energies, one could expect the N^N ligand induced changes in the λH and hνH terms. Their values, however, depend rather weakly on the N^N ligand present in the emitters under study. One can rationalize the lack of the significant λH and hνH variation considering possible values of these parameters associated with the S0 ← 3*LC emissions. For these emissions, with well-structured spectra, one can assume very small λLM and relatively large λH values. Then, independently of the cLCT and cMLCT coefficients attributed to the given MLCT emitter, the observed λH values should remain nearly constant. In an analogous way, this explains relatively small changes in the averaged high frequency intra-molecular vibrations.
The fitted λLM values contain contributions from the λL and λM reorganization energies. In a similar way, the λL and λM terms contributing to the overall λLM values are expected to follow analogous relationships. Separation of the both contributions is principally possible but requires some additional data and/or assumptions. Nominally, one can fit the emission band using more advanced model with two quantized modes corresponding to the medium νM and high νH frequency vibrations. However, since the one-mode approximation with expression (5) already gives a satisfactory agreement with experimental spectra the additional parameters do not follow from a free fit. Therefore, some of the fitting parameters (e.g., medium νM and high νH frequencies) should be somewhat arbitrary fixed. Optionally, one can compare the λLM values at distinctly different temperatures (e.g., 77 and 298 K) but this opportunity is not available for the investigated [Re(CO)3(N^N)(tpp)]+ complexes due to changes of their emission character, from the MLCT at 298 K to LC at 77 K. Such comparison, however, is possible for the [Re(CO)2(N^N)(tpp)2]+ complexes exhibiting MLCT emission at both temperatures. This was performed in the manner as described previously for the [Re(CO)2(N^N)(dppv)]+ complexes20 with finding the close analogy between both series of the Re(CO)2+ emitters.
The fitted V33 values together with the E00 energies provides some additional information about the nature of the given MLCT emitter allowing estimation of the cLCT and cMLCT coefficients. The cMLCT coefficients calculated according to eqn (1) with the obtained V33 values comprise the ranges of 0.88–0.96 and 0.66–0.98 for the Re(CO)2+ and Re(CO)3+ series, respectively. This allows classifying nearly all the discussed complexes as the emitters with dominant MLCT nature. Only in some cases, namely the [Re(CO)3(N^N)(CH3CN)]+ or [Re(CO)3(N^N)(tpp)]+ complexes bearing 47dmphen, 56dmphen or tmphen as N^N ligand, comparable contributions from the “pure” 3*LC and 3*MLCT excitations can be anticipated from the estimated cLCT values. This remains in agreement with traces of the vibronic structures observed in the 298 K emission spectra of these complexes.
Nature of the lowest excited triplet state
DFT and TD-DFT computations were performed to obtain a deeper insight into the nature of the emissive 3*[Re(CO)2(N^N)(tpp)2]+ and 3*[Re(CO)3(N^N)(tpp)]+ species. To attain more comparable results, additional computation performed for the all discussed series of the Re(I) complexes were done at the same level of theory. Geometries of the investigated complexes were optimized at the B3LYP level57 for each stationary structure in the ground S0 and the lowest triplet T1 electronic states. Electronic transitions were calculated for the optimized structures using the TD-DFT method.58 Calculation performed in CH3CN solutions were done by means of the polarizable continuum solvation model.59 Combination of Lanl2DZ basis set60 (Re element) and the 3-21G* or 6-31G* basis sets (light elements) were employed in the present computations. Relatively small 3-21G* basis set was applied in the optimizations because, due to flexibility of tpp ligand, optimizations required much more computing time than it could be expected taking into account only number of atoms consisting the given tpp complex. The electronic transitions, however, were afforded using the Lanl2DZ and 6-31G* combination. Such approach was applied successfully for the heteroleptic Ru(II) and Os(II) complexes bearing α-diimine and phosphine ligands.61 Our testing computations performed for selected [Re(CO)3(N^N)(Cl)] complexes provided results compatible with those presented in the literature.62–65 This is particularly true for the shapes of the molecular orbitals and orbital assignment of the lowest excited states. In a similar way, agreement with the literature data for the [Re(CO)3(bpy)(tpp)]+ complex66 was obtain.The performed DFT and TD-DFT computations confirm the MLCT nature of the lowest triplet state anticipated for the discussed complexes. For the optimized T1 geometry, the S0 → T1 transitions are described mainly (with CI coefficients 0.66–0.69) between the HOMO and LUMO orbitals, localized on the Re(I) core and N^N ligand, respectively (cf. data in Table 3). All other computed quantities associated with the S0 → T1 excitation confirm the MLCT nature of their lowest excited triplet state as well. Comparing the bond lengths computed for the optimized S0 and T1 states, one can see expected changes in the metal–ligands and intra-ligands bonds, e.g., shortening of the Re–N bonds and elongation of the Re–P and Re–C bonds. This remains in accordance with increased positive charge on the central Re(I) ion. In a similar way, the computed changes in the CN and CC bond lengths are consistent with the introduction of an additional electron on the π* orbital of the N^N ligand. Congruently, the S0 → T1 transitions lead to changes of the dipole moments characterizing the ground S0 and the excited T1 states. The observed lowering reflects well the charge redistribution associated with the MLCT excitation.
Analysis of the distribution of atomic charges and spin densities in the excited T1 state of the discussed complexes supports intrinsic MLCT nature of these states. Upon inspecting the calculated spin densities for the investigated complexes, one can see that one of the unpaired electrons is localized mainly on the N^N ligand, whereas the second one on the remaining parts of the complexes. The observed ca. 1:1 spin redistribution symmetry is distinctly different from the 2:0 asymmetry expected for the 3*LC excitation localized solely within the N^N ligand. For the discussed complexes, the 1:1 symmetry predictable for “pure” MLCT excitation is, however, to some extent broken. Whereas, the effect is relatively small for the investigated Re(CO)2+ complexes (e.g., 1.13:0.87 for [Re(CO)2(bpy)(dppv)]+ chelate), the spin redistribution is distinctly more dissymmetric for [Re(CO)3(bpy)(tpp)]+ (1.22:0.78) or [Re(CO)3(bpy)(CH3CN)]+ (1.31:0.69) complexes. The computation performed on the same level of theory gave for the prototype [Re(CO)3(bpy)(Cl)] complex nearly theoretical 1.04:0.96 ratio. Reasonably, larger spin redistribution dissymmetry arises from the DFT computation performed for other complexes under investigations. For example, the 1.49:0.51 and 1.31:0.69 ratios were found for the [Re(CO)3(47dmphen)(CH3CN)]+ and [Re(CO)3(47dmphen)(tpp)]+ chelates. Noteworthy, the found differences in the spin redistribution extracted from the DFT computation follow adequately the cLCT coefficients values that can be estimated using data the emission band-shape analysis. Using eqn (1) with affordable V33 and ELCT − E00 one can obtain the cLCT values ranging from 0.15 to 0.71–0.75 for the [Re(CO)3(bpy)(Cl)] and [Re(CO)3(47dmphen)(CH3CN)]+ or [Re(CO)3(47dmphen)(tpp)]+ complexes, respectively. For cLCT = 0.15 one can expect the 1.02:0.98 spin redistribution ratio, whereas for cLCT = 0.75 the 1.56:0.44 dissymmetry is anticipated. Thus, one can conclude nice congruence between the DFT and the band-shape analysis outcomes.
The obtained shapes of the molecular orbitals as well as the resulted orbital assignments of the low energy transitions remain in agreement with the MLCT nature of the low energy bands of the complexes under study. Shapes of their molecular orbitals (cf. Fig. 9) confirm metallic character of their HOMO, HOMO-1 and HOMO-2 levels involved in the low energy electronic transitions. The lowest LUMO orbitals participating in these transitions are essentially π* orbitals localized mainly on the N^N ligand with minor contributions from the Re(I) ion and other components forming the discussed complexes. However, although the HOMO, HOMO−1, and HOMO−2 possess mainly the metallic d orbital character, some contributions from the ligand attached to the Re(I) core are clearly seen. Thus, one can consider the low energy singlet and triplet states of the discussed complexes as the MLCT states with more or less pronounced admixture of the intra-ligand excitations. This is characteristic for the transitions within the singlet as well as the triplet manifolds. Moreover, both these excitation types should be treated as the charge-transfer between the whole Re(CO)3(tpp)+, Re(CO)3(CH3CN)+, Re(CO)3(Cl), Re(CO)2(tpp)2+ or Re(CO)2(dppv)+ fragments to the N^N ligand instead of somewhat oversimplified “pure” dRe(I) → N^N or dRe(II) ← N^N− assignments.
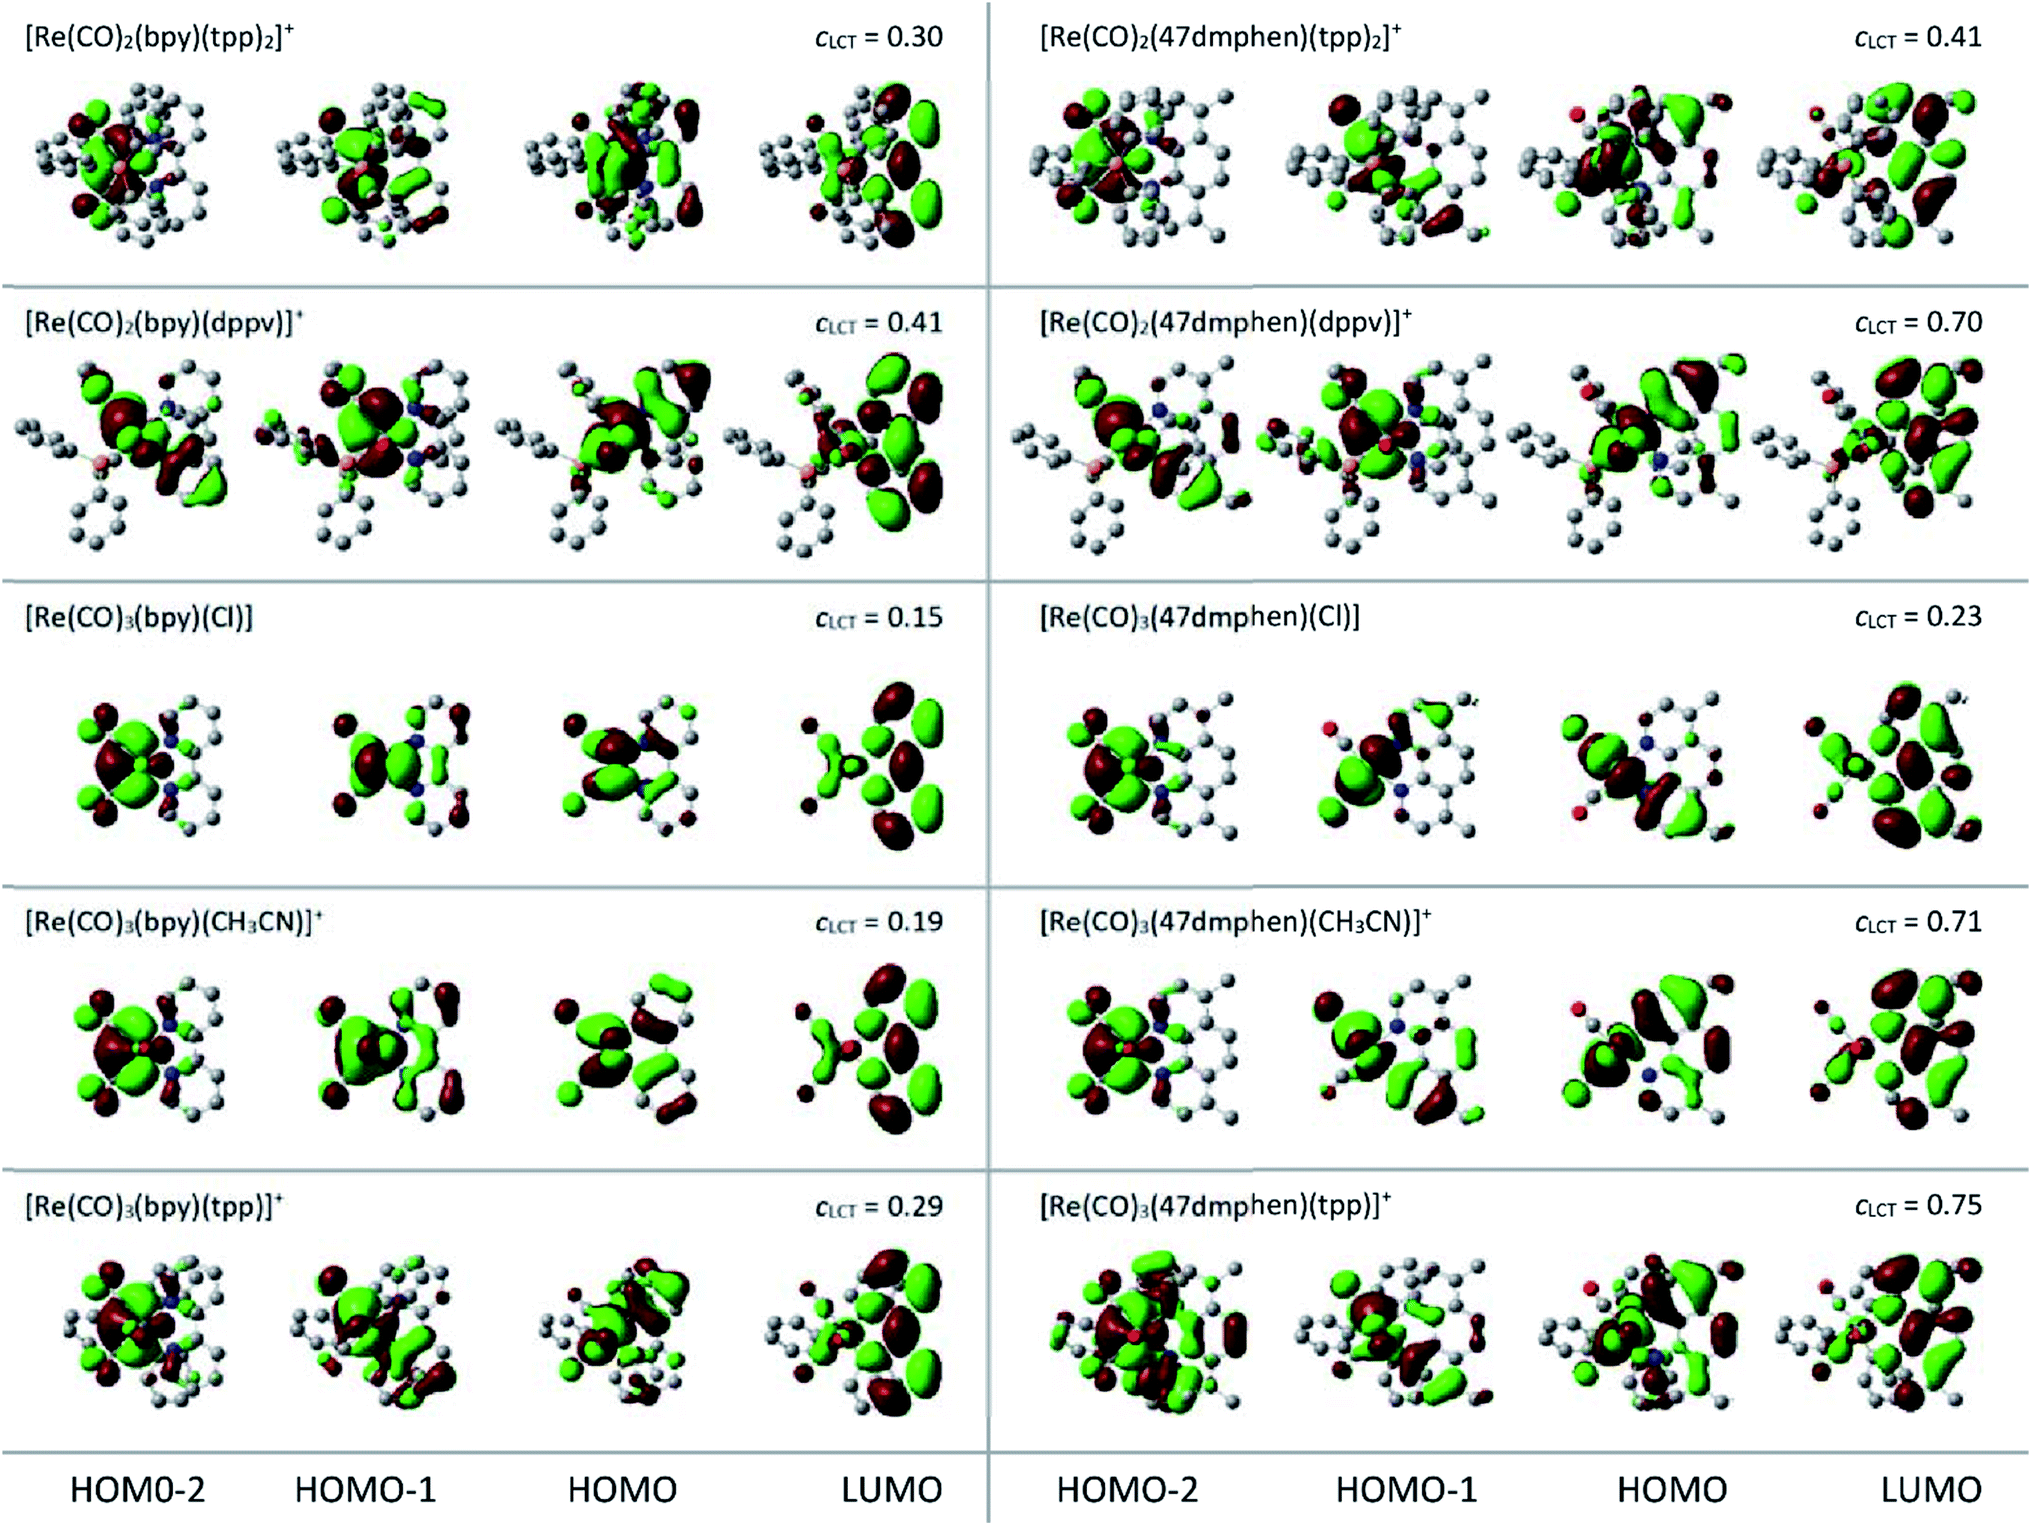 | ||
| Fig. 9 Shapes of the frontier molecular orbitals for the bpy and 47dmphen complexes. Data (for CH3CN solutions) from the TD-DFT computations performed for the lowest triplet states structures optimized in vacuum. Plots views (along z-axis) of the isodensity surfaces with contour value Z = 0.02. | ||
Despite all found similarities, there are some intrinsic differences in properties of the discussed complexes. These include essential variety in the oscillator strengths of the computed vertical electronic transitions from the minima of the S0 potential curves (cf. Fig. 10) as well from the S0 states at the T1 geometries, i.e., at geometry of the Franck–Condon states reached in the S0 ← 3*MLCT emissions (cf. data in Table 4). Such behaviour seems to be associated with different contributions of the individual Re(I) d orbitals to the molecular HOMO, HOMO−1, and HOMO−2 orbitals, respectively. Considering the shapes of the molecular orbitals involved in the individual transition, one can conclude that their symmetries are mainly responsible for the observed changes in the f patterns Nevertheless, the found sums of oscillator strengths f of the transitions with MLCT character remains (for the given N^N ligand) nearly constant over these chelates. The found small variety of the ∑f values (e.g., 0.08–0.12 for the bpy complexes) corresponds well with the observed similar values of the εm coefficients.
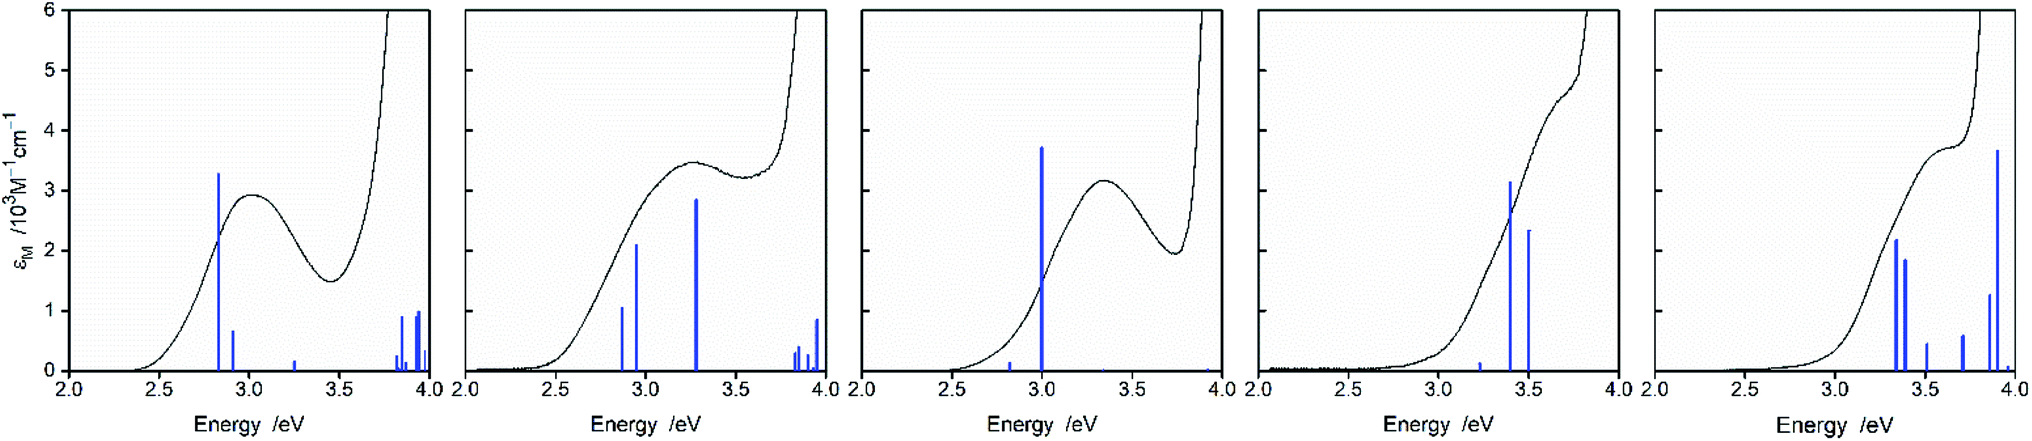 | ||
| Fig. 10 MLCT parts of the UV-vis absorption spectra of the [Re(CO)2(bpy)(tpp)2]+, [Re(CO)2(bpy)(dppv)]+, [Re(CO)3(bpy)(Cl)], [Re(CO)3(bpy)(CH3CN)]+, and [Re(CO)3(bpy)(tpp)]+ complexes (from left to right) in CH3CN solutions. Blue vertical bars correspond to the positions and relative intensities of the electronic transitions as obtained from TD-DFT computations. | ||
| Complex | S0 → T1 | S0 → S1 | S0 → S2 | S0 → S3 | S0 → S4 |
|---|---|---|---|---|---|
| a H/L, H−1/L, H−2/L, H−3/L, H−4/L and H/L+1 denote HOMO → LUMO, HOMO−1 → LUMO, HOMO−2 → LUMO, HOMO−3 → LUMO, HOMO−4 → LUMO and HOMO → LUMO+1 transitions, respectively. | |||||
| [Re(CO)2(bpy)(tpp)2]+ | E = 1.80 | E = 2.27, f = 0.103 | E = 2.63, f = 0.004 | E = 2.99, f = 0.011 | E = 3.44, f = 0.009 |
| 98% H/L | 99% H/L | 99% H−1/L | 99% H−2/L | 82% H/L+1 + 13% H−4/L | |
| [Re(CO)2(bpy)(dppv)]+ | E = 1.85 | E = 2.29, f = 0.044 | E = 2.38, f = 0.010 | E = 2.84, f = 0.076 | E = 3.38, f = 0.004 |
| 94% H/L | 85% H/L+ 10% H−1/L | 89% H−1/L + 9% H/L | 93% H−2/L | 98% H/L+1 | |
| [Re(CO)3(bpy)(Cl)] | E = 1.92 | E = 2.10, f = 0.001 | E = 2.48, f = 0.077 | E = 2.77, f = 0.004 | E = 3.61, f = 0.001 |
| 92% H/L | 99% H/L | 98% H−1/L | 99% H−2/L | 87% H/L+1 + 11% H−3/L+1 | |
| [Re(CO)3(bpy)(CH3CN)]+ | E = 2.09 | E = 2.49, f = 0.000 | E = 2.80, f = 0.004 | E = 2.95, f = 0.120 | E = 3.76, f = 0.250 |
| 78% H/L + 17% H−3/L | 99% H/L | 87% H−2/L + 12% H−1/L | 86% H−1/L + 12% H−2/L | 84% H−3/L + 11% H/L | |
| [Re(CO)3(bpy)(tpp)]+ | E = 2.12 | E = 2.60, f = 0.049 | E = 2.93, f = 0.035 | E = 3.02, f = 0.033 | E = 3.36, f = 0.020 |
| 82% H/L | 93% H/L | 77% H−1/L + 18% H−2/L | 79% H−2/L + 16% H−1/L | 95% H−3/L | |
| [Re(CO)2(47dmphen)(tpp)2]+ | E = 1.81 | E = 2.45, f = 0.148 | E = 2.71, f = 0.032 | E = 2.75, f = 0.017 | E = 3.10, f = 0.000 |
| 92% H/L | 95% H/L | 81% H/L+1 + 13% H−1/L | 82% H−1/L + 16% H/L+1 | 97% H−2/L | |
| [Re(CO)2(47dmphen)(dppv)]+ | E = 1.84 | E = 2.58, f = 0.149 | E = 2.67, f = 0.003 | E = 2.80, f = 0.038 | E = 3.05, f = 0.064 |
| 90% H/L | 86% H/L + 7% H/L+1 | 95% H−1/L | 88% H/L+1 | 92% H−2/L | |
| [Re(CO)3(47dmphen)(Cl)] | E = 1.98 | E = 2.45, f = 0.054 | E = 2.67, f = 0.069 | E = 2.82, f = 0.048 | E = 3.01, f = 0.009 |
| 87% H/L | 82% H/L | 81% H−1/L | 87% H/L+1 | 60% H−2/L + 32% H−3/L | |
| [Re(CO)3(47dmphen)(CH3CN)]+ | E = 2.10 | E = 2.92, f = 0.072 | E = 3.07, f = 0.092 | E = 3.20, f = 0.005 | E = 3.30, f = 0.076 |
| 80% H/L | 69% H/L + 26% H−1/L | 69% H−1/L + 18% H/L | 91% H−2/L | 77% H/L+1, 9% H/L | |
| [Re(CO)3(47dmphen)(tpp)]+ | E = 2.06 | E = 2.90, f = 0.181 | E = 3.14, f = 0.010 | E = 3.23, f = 0.046 | E = 3.28, f = 0.008 |
| 81% H/L | 92% H/L | 88% H−1/L + 11 H/L+1 | 75% H/L+1 + 9% H−1/L | 60% H−2/L + 32% H−3/L | |
For all discussed Re(I) complexes the lowest S0 → T1 transitions involve the HOMO and LUMO orbitals in accordance with their MLCT character. Energies of these transitions, computed at the lowest triplet state geometries, correspond quite well with the experimental hcmaxem values. Although the found agreement (cf. Fig. 11) could be somewhat better, one can regard the differences between experimental and computed values (up to ca. 0.3 eV) as acceptable taking into account low level of the theory. In similar way, the energies of the S0 → 1*MLCT transitions seem to be underestimated with comparable errors (cf. Fig. 10). Thus, one can conclude that the energy gaps between the lowest 3*MLCT and 1*MLCT states (ΔEST) available from the performed TD-DFT computations are, due to cancellation of possible errors, quite sensible values. One can also hypothesise that the TD-DFT energy gaps between T1 and S2 or T1 and S3 states are reasonable as well.
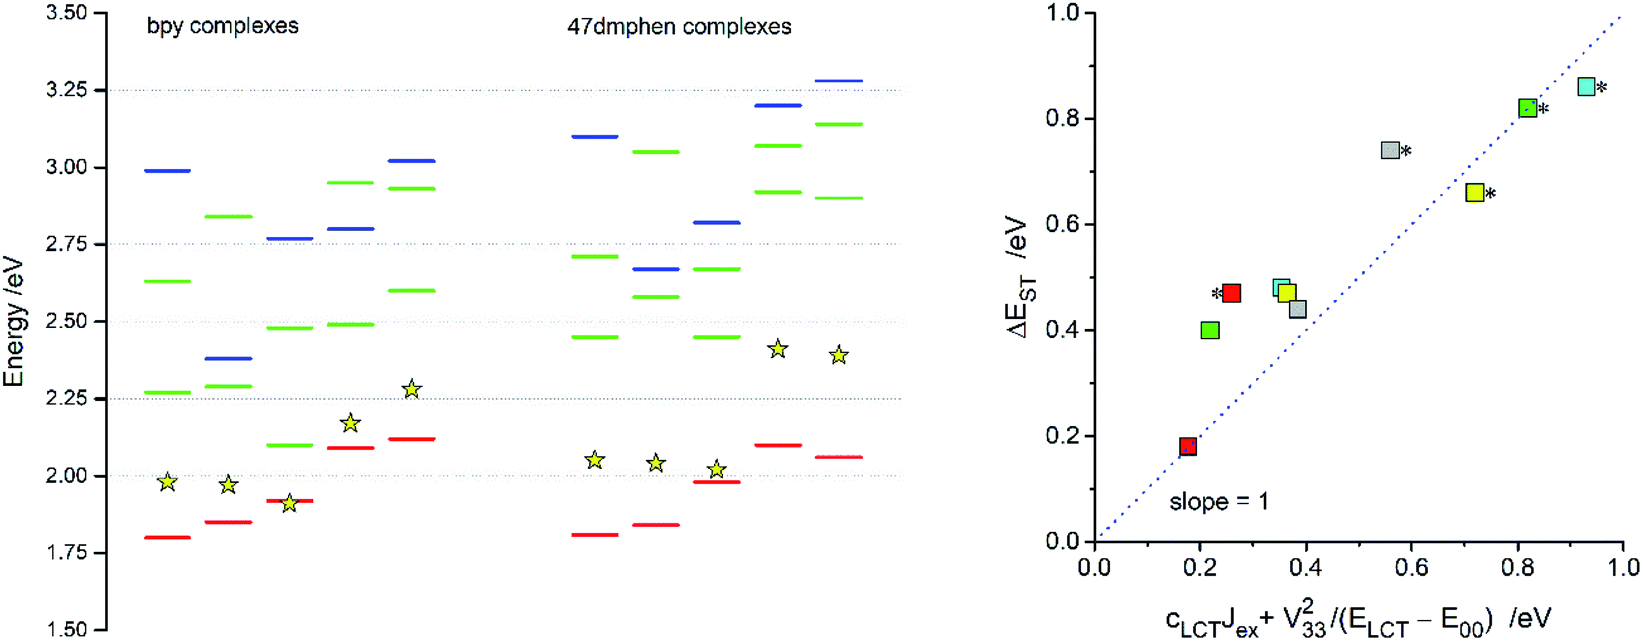 | ||
| Fig. 11 TD-DFT energies of the S0 → T1 (red bars) and S0 → Sn transitions (green and blue bars) for the [Re(CO)2(N^N)(tpp)2]+, [Re(CO)2(N^N)(dppv)]+, [Re(CO)3(N^N)(Cl)], [Re(CO)3(N^N)(CH3CN)]+, [Re(CO)3(N^N)(tpp)]+ complexes (from the left to right). Data for the bpy (left column) and 47dmphen (right column) ligands. Blue bars indicate transitions from these HOMO−1 or HOMO−2 where their metallic character is connected with the Re(I) dxy orbitals whereas green bars correspond to transitions from the HOMO, HOMO−1 or HOMO−2 originated from the dxz and/or dyz orbitals. Yellow star symbols denote the energies of the S0 ← 3*MLCT emissions. Insert presents relation of the TD-DFT energy gaps ΔEST between the lowest excited 3*MLCT and 1*MLCT states to the ΔEST values calculated according to eqn (12). Data for the [Re(CO)2(N^N)(tpp)2]+ (yellow symbols), [Re(CO)2(N^N)(dppv)]+ (grey symbols), [Re(CO)3(N^N)(Cl)] (red symbols), [Re(CO)3(N^N)(CH3CN)]+ (green symbols), [Re(CO)3(N^N)(tpp)]+ (cyan symbols) complexes with 47dmphen (marked with * character) and bpy ligands. | ||
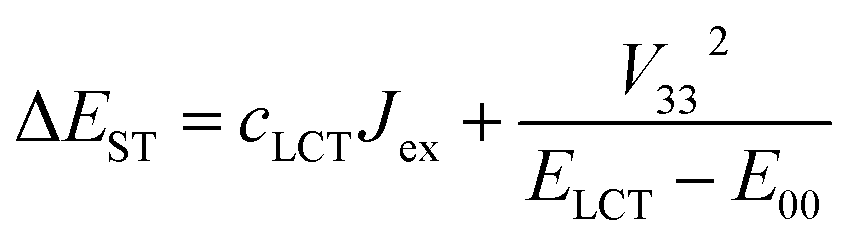
According to the data presented in Table 4, the computed ΔEST values, spanning the range from 0.18 to 0.84 eV, are much larger than one can expect taking into account only electronic interactions between the excited 3*MLCT and 3*LC states. In such a case, due to the electronic interactions within the 1*LC/1*MLCT and 3LC/3*MLCT manifolds, the initial degeneracy of the “pure” 1*MLCT and 3*MLCT states is removed. Thus, one can approximate the appearing energy splitting ΔEST between the “real” 1*MLCT and 3*MLCT states as follows:20
 | (8) |
| ΔEST = V332/(ELCT − E00) | (9) |
With the V33 and E00 quantities available from the emission band-shape analysis, one can estimate the ΔEST terms according to eqn (9). The resulting values, ranging from 0.02 to 0.25 eV, are up to nearly one order of magnitude smaller than the TD-DFT ones. Since such large discrepancy seems only hardly attributable to the possible errors in the V33 and E00 values, some other factors must affect the energy splitting between the lowest 3*MLCT and 1*MLCT states.
Comparing the ΔEST values estimated according to eqn (9) with those from the TD-DFT computations one can find significant correlation. The larger the cLCT coefficient characterizing the given MLCT emitter, the larger is the observed discrepancy. This finding suggests important contributions from the exchange interactions between unpaired electrons of the excited 3*MLCT and 1*MLCT states.67,68 Thus, one can rationalize the observed ΔEST inconsistency taking into account the nature of the ψS and ψT wave functions of the lowest excited S1 and T1 states. If the S1 state is nearly “pure” MLCT state, one can assume localization of the unpaired electrons mainly on the d and π* orbitals. In such a case, with neglecting smaller contributions from other ligand or metal orbitals, one can express the ψS wave function as follows:
| ψS = ψd + ψL | (10) |
| ψT = cMLCTψd + cLCTψH + ψL | (11) |
 | (12) |
Transition dipole moments of S0 ← 3*MLCT emission
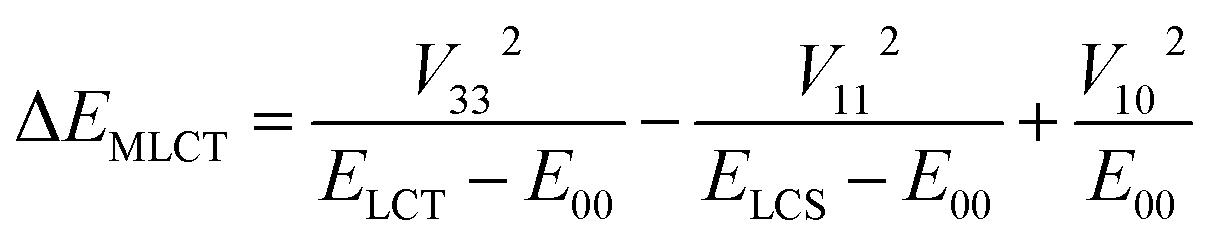
The close analogy between complexes within the Re(CO)3+ and Re(CO)2+ series is also seen in the N^N ligand induced changes in the Mem values (cf. Fig. 12) where the Mem values are plotted against the ELCT − E00 difference. The applied correlation is based on our previous works,12,20,29–31 where following relationship between the Mem and (ELCT − E00)/hcmaxem was introduced
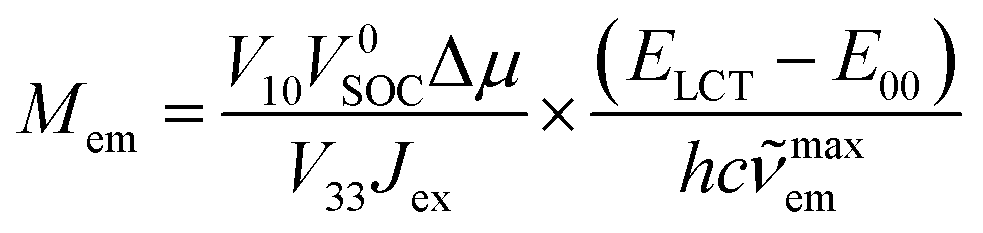
 | (13) |
maxem values when the remaining parameters are constant (or nearly constant) within analysed series of MLCT emitters. This may be expected when the coordinated N^N ligands are varied whereas the central metal ion and other coordinated ligands remain the same. The trend in the Mem values observed for the [Re(CO)2(N^N)(tpp)2]+ series is similar to that found for the [Re(CO)2(N^N)(dppv)]+ one whereas the [Re(CO)3(N^N)(tpp)]+ complexes are more resembling their [Re(CO)3(N^N)(CH3CN)]+ or [Re(CO)3(N^N)(Cl)] counterparts. The found χM slopes for the Re(CO)2+ series are distinctly smaller than those found for the Re(CO)3+ ones.
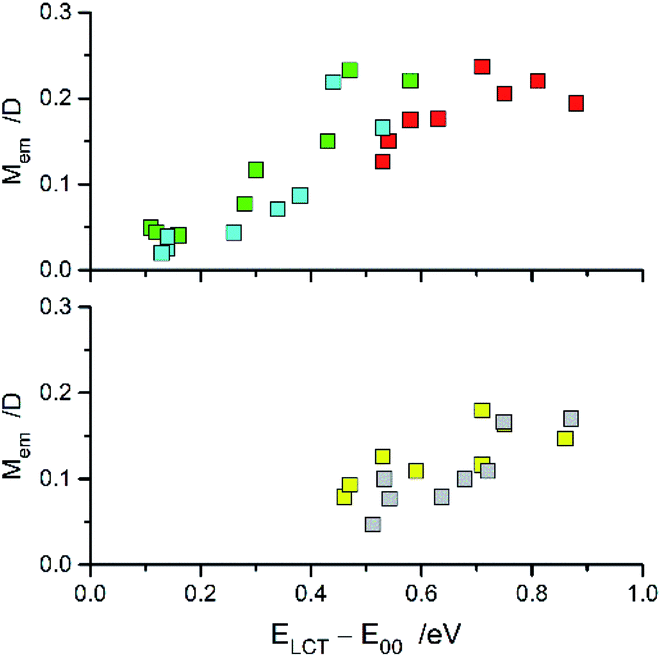 | ||
| Fig. 12 Relationships between the Mem and ELCT − E00 quantities for the Re(CO)3+ (top) and Re(CO)2+ (bottom) complexes. Data for [Re(CO)2(N^N)(tpp)2]+ (yellow symbols), [Re(CO)2(N^N)(dppv)]+ (grey symbols),20, [Re(CO)3(N^N)(tpp)]+ (blue symbols), [Re(CO)3(N^N)(CH3CN)]+ (green symbols),12 and [Re(CO)3(N^N)(Cl)] (red symbols)12 complexes in CH3CN solutions at room temperature. | ||
The above presented findings might suggest applicability of the eqn (12) in the quantitative interpretation of the experimentally found Mem values. Some fundamental reservations, however, allow regarding the observed coincidence as somewhat accidental. These arises because eqn (13) was derived assuming that the intensity borrowing from the lowest excited 1*MLCT state is responsible for the radiative S0 ← 3*MLCT deactivation. Then the transition dipole moment Mem is related to the ΔEST energy gap according to following relationship70
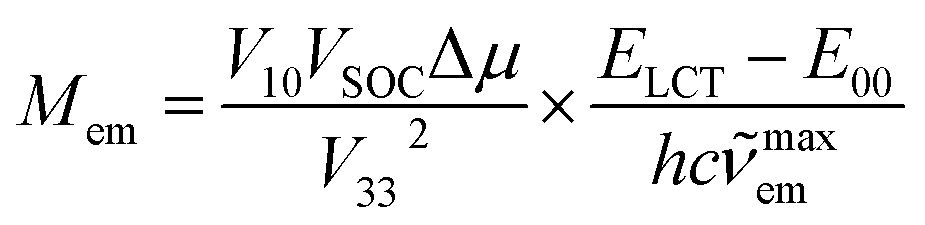
| Mem = M01VSOC/ΔEST | (14) |
|
M01 = ΔμV10/hcmaxem
| (15) |
| VSOC = cMLCTV0SOC | (16) |
 | (17) |
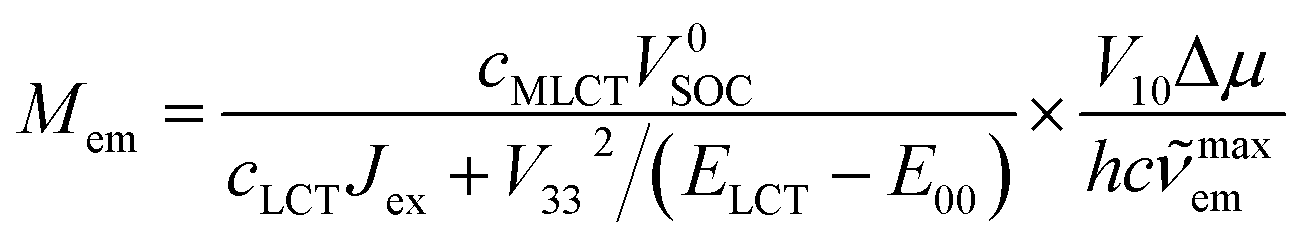
Since the cLCT and cMLCT coefficients are affordable from eqn (1) and typically cLCTJex ≫ V332/(ELCT − E00) one can further simplify eqn (17) to
 | (18) |
The obtained expression, similarly to eqn (13), predicts again linear relationship between the experimentally determinable Mem and (ELCT − E00)hcmaxem quantities. Potentially one could apply eqn (18) in interpretation of the found similarities and variation of the experimentally found Mem values but some doubts appear concerning the spin–orbit coupling induced mixing of the lowest excited 3*MLCT and 1*MLCT states. This is because a 3*MLCT state may couple effectively with a 1*MLCT state if their electronic configurations involve the same π* ligand orbital, but different d metal orbitals.71,72 Thus, the required spin orbit coupling may be only weakly operative. Moreover, in the case of some α-diimine fac-Re(CO)3+ complexes, the oscillator strengths of their lowest S0 → 1*MLCT transitions (cf. data in Table 4) are very low, too low for an effective intensity borrowing responsible for the S0 ← 3*MLCT emission.
Possible mixing between the lowest 3*MLCT state with other singlet states may be treated as any plausible option explaining the experimentally observed Mem values. Then the resulting transition dipole moment Mem of the S0 ← 3*MLCT emission can be expressed as follows70
 | (19) |
The perceived congruity between the band-shape analysis data and results from the performed TD-DFT computation allows considering the TD-DFT data as quite trustworthy. Thus, despite of low level of our computations, one can apply them to discuss the experimental Mem values in more details. Analysing the data collected in Table 4, however, it is rather difficult to find any simple correlation between the Mem and 〈Sn|M|S0〉/[E(Sn) − E(T1)] quantities. According to eqn (17) one can also expect (in some specific cases) the Mem values independent off the oscillator strengths redistribution over tree considered S0 ← 1*MLCT transitions. However, this could be only possible when the numerators 〈1*MLCTn|VSOC|3*MLCT〉 in eqn (19) would be proportional to the denominators E(1*MLCT) − E(3*MLCT). Then, for all three conceivable contributions, the VSOC/ΔE terms remain constant and the resulting Mem values is simply proportional to the sum of 〈1*MLCTn|M|S0〉. Perhaps one can consider this special case as imaginable explanation of the experimental findings, but at the present stage of investigations, it remains as possible but very unlikely opportunity.
The second option is the intensity borrowing from the spin allowed T1 → Tn transitions. In such a case, one can relate the Mem values to the spin–orbit induced coupling between the ground S0 state and Tn states 〈Tn|VSOC|S0〉 and the transition dipole moments of the transitions 〈Tn|M|T1〉 occurring within the triplet manifold70
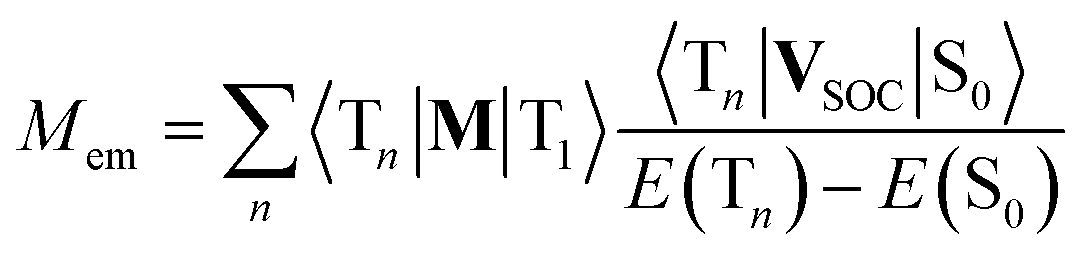 | (20) |
This option is, however, still less credible because the energy gaps E(Tn) − E(S0) are relatively large that should result in distinctly smaller VSOC values. Because values of the 〈Tn|VSOC|S0〉 and 〈Sn|VSOC|T1〉 terms are anticipated to be similar, one could consider this option only for the 〈Tn|M|T1〉 values much larger than their 〈Sn|M|S0〉 complements. This is, however, very unlikely. Thus, one can expect potentially possible intensity borrowing from the T1 → Tn transitions as rather small, most probably too small to explain the experimentally observed Mem values.
Finally, one can also consider a permanent dipole difference contribution arising from the direct spin–orbit coupling induced interactions between the ground S0 and the excited 3*MLCT states. Both involved states are metallic in their character that precludes possibly effective spin–orbit induced interactions between them. In this particular case the Mem values will depend on the differences between the dipole moments, μ(T1) and μ(S0), of the states involved in the S0 ← 3*MLCT transition and the spin–orbit coupling 〈T1|VSOC|S0〉 element responsible for interaction between them70
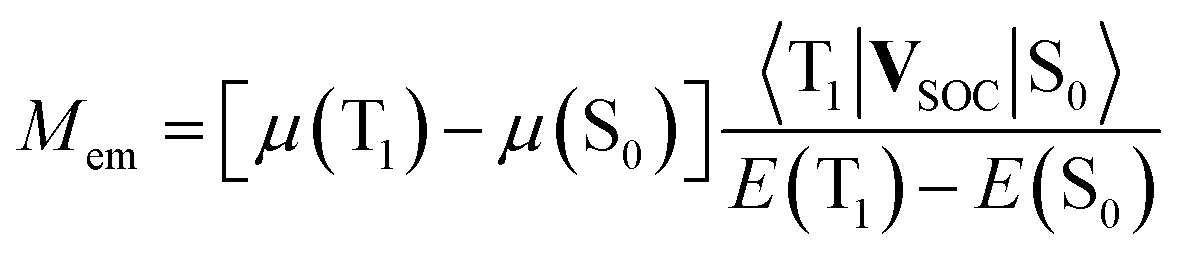 | (21) |
One can attribute the energy gap E(T1) − E(S0) in eqn (21) to the emission maxima hcmaxem of the given S0 ← 3*MLCT transition. For both remaining terms, μ(T1) − μ(S0) and 〈T1|VSOC|S0〉, one can expect their functional dependence on amount of the metallic character in the 3*MLCT emitter. Both considered quantities depend on the value of the cMLCT coefficient. Thus, the μ(T1) − μ(S0) difference is approximately equal to cMLCT2Δμ. Correspondingly, one can approximate the 〈T1|VSOC|S0〉 value as cMLCTV0SOC. With the above remarks, one can simply obtain the following expressions
 | (22) |
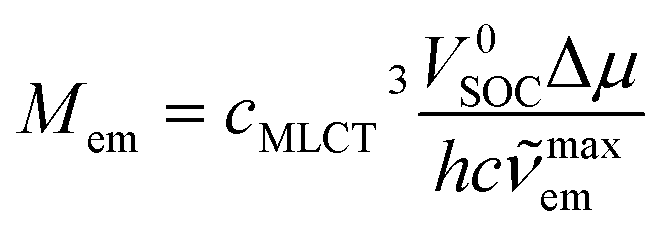
According to eqn (22), one can anticipate the experimental Mem values related to the cMLCT3 factor. In fact a monotonic relationship between Mem and cMLCT seems to be evident (cf. Fig. 13) but, instead of the expected Mem ∼ c3MLCT association, the Mem values can be linearized against cMLCT9. Similarly, as one can see in Fig. 12, the trends in the Mem values reflect the MLCT character of the given emitter. The experimental points are similarly scattered but the picture is more coherent, all five discussed Re(I) series follow the same layout. The larger the cMLCT values in the 3*MLCT state, the larger are the transition dipole moments attributed to the S0 ← 3*MLCT emission. Evidently, the cMLCT coefficient is the most important factor affecting the Mem values. Most probably, the higher MLCT characteristic involved in the singlet and triplet excited states, the spin–orbit coupling is more pronounced. Any exact origin of the observed correlation remains, however, an open question. Thus, one should treat the observed Mem ∼ cMLCT9 relation as an empirical rule. On the other hand, similar correlations, e.g., between the Mem and (ELCT − E00)/hcmaxem values, have been found for in our previous works concerning some Os(II) or Ru(II) complexes.29–31 Preliminary results from our investigations of the cyclometalated Ir(III) complexes [Ir(C^N)2(N^N)]+ suggests that these chelates follow the same trend as well. Thus, the correlations described in this work may have a general meaning and the problem is worthy for further investigations. To obtain an adequate solution, however, one can speculate that it will be necessary to go beyond simple perturbation theory. Very likely, a proper account of the spin–orbit coupling between the ground S0 and the lowest 3*MLCT states will require considerations of the spin-vibronic coupling.73
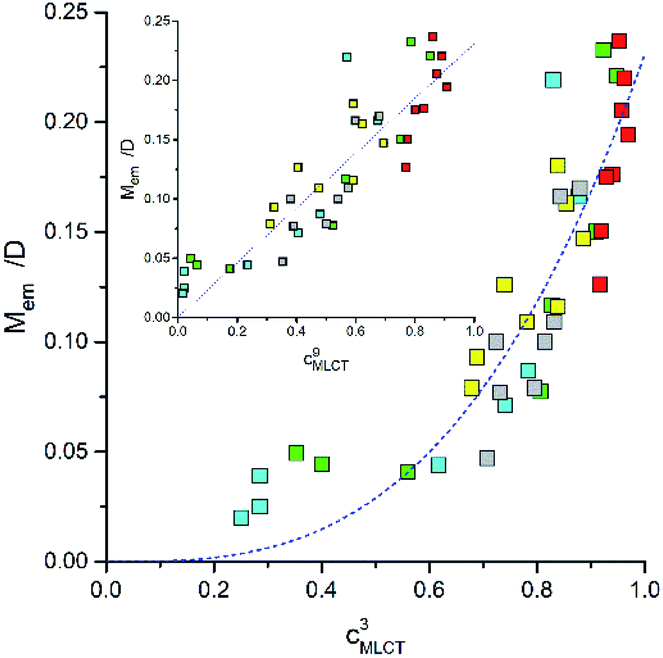 | ||
| Fig. 13 Relationships between the Mem and cMLCT quantities for the Re(CO)2+ and Re(CO)3+ complexes. Data for [Re(CO)2(N^N)(tpp)2]+ (yellow symbols), [Re(CO)2(N^N)(dppv)]+ (grey symbols),20, [Re(CO)3(N^N)(tpp)]+ (blue symbols), [Re(CO)3(N^N)(CH3CN)]+ (green symbols),12 and [Re(CO)3(N^N)(Cl)] (red symbols)12 complexes in CH3CN solutions at room temperature. | ||
Concluding remarks
Comparative studies of the luminescence properties of Re(CO)2+ and Re(CO)3+ α-diimine chelates point to very similar nature of their lowest excited states. In both types of the complexes, their emissions in solutions at room temperature take place from the lowest excited T1 states possessing distinct MLCT character. For most of the complexes discussed in this work, the 77 K emissions in solid matrices exhibit MLCT character as well. In some cases, however, the character of the 77 K emission change from MLCT to LC. Particularly well pronounced temperature effect can be seen for the [Re(CO)3(N^N)(tpp)]+ series where, independently of the coordinated N^N ligand, structured emissions have been recorded.Despite all similarities, the investigated Re(CO)2+ and Re(CO)3+ complexes exhibit some important differences, particularly in the reorganization energies accompanying the electron transfer between the metallic center and the coordinated N^N ligand. Typically, the reorganization energies associated with high and low/medium frequency modes are distinctly smaller for the Re(CO)2+ complexes as compared to the Re(CO)3+ ones. This affects strongly the non-radiative deactivation of the excited 3*MLCT states making the Re(CO)2+ chelates better emissive that is reflected in the higher emission quantum yields and longer emission life-times.
One can regard the reported complexes as well suited for the fundamental studies of the structure/properties relations for the MLCT emitters. In this work, two different approaches, analysis of emission band shapes and TD/TD-DFT computations, have been applied to clarify the observed changes in their luminescence properties as caused by the nature of the main and ancillary ligands. Well congruent results obtained from both applied methodologies shown that the data from band shape analyses are applicable in testing results from the quantum-mechanical computations, and vice versa. Particularly, both applied approaches point to crucial role of the lowest excited state 3*LC localized within the coordinated N^N ligands. Mixing of the “pure” 3*LC and 3*MLCT configurations determines the nature of the given MLCT emitter affecting all quantities associated with the radiative as well as non-radiative S0 ← 3*MLCT transitions.
Results from the performed band shape analyses of the S0 ← 3*MLCT emissions have been applied in the interpretation of the experimentally determined rates of the non-radiative deactivations of the excited 3*MLCT species. In most cases, the theoretically predicted knr values remain in nice agreement with those found experimentally. This confirms a close connection between the radiative and non-radiative deactivation of the excited states with the MLCT character. Intrinsic deviations between calculated and experimental knr values were, however, found for some of the MLCT emitters with large contributions of the 3*LC excitation. Any more detailed explanation of this finding requires further systematic investigations.
Another unclear issue, origin of the electronic coupling between the lowest excited 3*MLCT and the ground S0 state requires further systematic investigations as well. The S0 ← 3*MLCT transitions are, due to spin conservation rule, forbidden processes. They might become possible when the intensity borrowing through the spin–orbit coupling effects cause the mixing between the singlet and triplet states. Analysing the obtained TD-DFT data we are, however, not able to find any S0 → Sn or T1 → Tn transition responsible individually for the required intensity borrowing. At least not one which could be common for all five discussed series of Re(I) complexes with adequate explanation of the N^N ligand induced changes in the Mem values. Perhaps, one should treat each of the analysed MLCT emitters independently but this option seems to be improbable. The latter conclusion is based on the monotonic relationship between the Mem values and cMLCT coefficients characterizing the MLCT character of the given MLCT emitter. Although the found Mem ∼ cMLCT9 correlation looks somewhat amazing, this finding can have a more general meaning because similar behaviour is characteristic for other α-diimine complexes. At the present stage of investigations, however, it is rather difficult to provide any reliable explanation of these findings. Further work in such direction seems to be required for any decisive answer.
Experimental
Materials
Solvent used in UV-vis absorption and emission studies, acetonitrile – ACN, methanol, and ethanol, were of spectroscopic grade purchased from Aldrich. Reagents and analytical grade solvents, used without further purification in performed syntheses and purification of the investigated complexes, were purchased from Trimen, Acros Organics, Sigma-Aldrich or Alfa Aesar companies.Both investigated series, [Re(CO)2(N^N)(tpp)2]+ and [Re(CO)3(N^N)(tpp)]+, have been synthesized in the form of PF6− salts from [Re(CO)3(N^N)(Cl)] precursors1,10,11 prepared according to well-known procedure reacting equimolar mixtures of Re(CO)5Cl and appropriate N^N ligand in refluxing toluene under argon for 4–5 h. The obtained precursors were further converted into [Re(CO)2(N^N)(tpp)2]+⋯PF6− salts by refluxing their deoxygenated o-dichlorobenzene solutions containing TlPF6 as dehalogenation agent and seven fold excess of tpp ligand for 2–4 h in dark.16 After filtering of precipitated TlCl, the reaction mixture was cooled to room temperature and an excess of diethyl ether/hexane mixture was added to precipitate [Re(CO)2(N^N)(tpp)2]+⋯PF6− products. The synthesized complexes were further purified by means of the column chromatography on activated acidic alumina with CH2Cl2/acetone 3:1 v/v mixture as eluent. The [Re(CO)3(N^N)(tpp)]+⋯PF6− salts74 were prepared in a similar way using chlorobenzene as reaction medium. The reaction mixture was heated to 105–110 °C under argon in dark for 3 h. Due to the lower reaction temperature, refluxing of the deoxygenated chlorobenzene solutions containing equimolar amount of [Re(CO)3(N^N)(Cl)] and tpp with slight excess of TlPF6 leads to [Re(CO)3(N^N)(tpp)]+⋯PF6− as main products. Column chromatography, performed on silica gel with CHCl3/CH3OH 100:1 v/v as an eluent, resulted in final separation and purification of these complexes. Identification of all synthesized complexes was done by means of FT-IR, 31P NMR and 1H NMR spectroscopy. Acquired spectroscopic data confirm the expected structures of the synthesized complexes without any doubts. The recorded FT-IR spectra exhibit the presence of two (1919–1931 and 1830–1854 cm−1) or three ((2027–2037, 1935–1954 and 1902–1935 cm−1) sharp and intense absorption band in the νCO stretching region in accordance with the presence of two or three CO ligands in the [Re(CO)2(N^N)(tpp)2]+ or [Re(CO)3(N^N)(tpp)]+ series, respectively. All the investigated complexes exhibit common features in their 31P NMR spectra, exhibiting the presence of characteristic septet signals arising from the PF6− counterions (δ = −144.7 ppm, J ∼ 706 Hz). Additional singlet signals (with singlet-to-septet 2:1 or 1:1 intensity ratio) from the coordinated tpp ligands, in the range of 17–23 ppm for the [Re(CO)2(N^N)(tpp)2]+ or 15–19 ppm for [Re(CO)3(N^N)(tpp)]+ series, correspond to the presence of two or one tpp ligand(s) in the analysed species. The presence of N^N and tpp ligands in these complexes is also nicely reflected in their 1H NMR spectra where the integrated intensities of signals and their positions reproduce nicely the expected numbers of protons. Here the performed syntheses and identification of the synthesized complexes are only briefly mentioned. Any more detailed description will be reported elsewhere.
Instrumentation and procedures
FT-IR, 31P and 1H NMR spectra were acquired using Shimadzu IRAffinity-1 and VARIAN 400-MR spectrometers, respectively. UV-vis absorption spectra were measured using Shimadzu UV 3100 spectrophotometer, whereas corrected steady-state luminescence spectra and emission decays by means of Gilden Photonics FluoroSense and FluoroSense-P fluorimeters. In the case of emission studies, the investigated CH3CN solutions were carefully deaerated by the prolonged saturation with preliminary purified and dried argon.As a quantum yield standard, a solution of quinine sulphate in 0.1 N H2SO4 (ϕref = 0.51)75 was used. The obtained emission quantum yields ϕem were measured with the estimated 10% accuracy. Emission spectra were fitted by means of a least-square method using OriginPro 9.0 software (Origin Lab Corp.) with user-defined functions. The experimental decay curves were analysed by the single-curve method using the reference convolution based on the Marquardt algorithm.76 with the χ2 test and the distribution of residuals serving as the main criteria in the evaluation of fit quality. Emission lifetime τem values, characterizing the recorded decays were measured with the temporal resolution of ca. 0.01 μs. DFT and TD-DFT results presented in this work were obtained with the Gaussian software supported by GaussView 5.0.77
Conflicts of interest
There are no conflicts to declare.Acknowledgements
This work is a part of the research project no. 24/20/B supported by the Siedlce University of Natural Sciences and Humanities.References
- M. Wrighton and D. L. Morse, J. Am. Chem. Soc., 1974, 96, 998 CrossRef CAS.
- R. A. Kirgan, B. P. Sullivan and D. P. Rillema, Top. Curr. Chem., 2007, 281, 45 CrossRef CAS.
- A. Kumar, S.-S. Sun and A. J. Lees, Top. Organomet. Chem., 2010, 29, 1 CAS.
- H. Takeda, K. Koike, T. Morimoto, H. Inumaru and O. Ishitani, Adv. Inorg. Chem., 2011, 63, 137 CrossRef CAS.
- D. J. Stufkens and A. Vlcek Jr, Coord. Chem. Rev., 1998, 177, 127 CrossRef CAS.
- B. D. Rossenaar, D. J. Stufkens and A. Vlcek Jr, Inorg. Chem., 1996, 35, 2902 CrossRef CAS.
- L. Wallace, D. C. Jackman, D. P. Rillema and J. W. Merkert, Inorg. Chem., 1995, 34, 5210 CrossRef CAS.
- L. Sacksteder, M. Lee, J. N. Demas and B. A. DeGraf, J. Am. Chem. Soc., 1993, 115, 8230 CrossRef CAS.
- J. K. Hiño, L. Della Ciana, W. J. Dressick and P. Sullivan, Inorg. Chem., 1992, 31, 1072 CrossRef.
- L. A. Worl, R. Duesing, P. Chen, L. Della Ciana and T. J. Meyer, J. Chem. Soc., Dalton Trans., 1991, 849 RSC.
- J. V. Caspar and T. J. Meyer, J. Phys. Chem., 1983, 87(6), 952 CrossRef CAS.
- A. Woźna and A. Kapturkiewicz, Phys. Chem. Chem. Phys., 2015, 17, 30468 RSC.
- Top. Curr. Chem., ed. V. Balzani and S. Campagna, 2007, vol. 280 Search PubMed.
- Top. Curr. Chem., ed. V. Balzani and S. Campagna, 2007, vol. 281 Search PubMed.
- E. Schutte, J. B. Helms, S. M. Woessner, J. Bowen and B. P. Sullivan, Inorg. Chem., 1998, 37, 2618 CrossRef CAS PubMed.
- J. L. Smithback, J. B. Helms, E. Schutte, S. M. Woessner and B. P. Sullivan, Inorg. Chem., 2006, 45, 2163 CrossRef CAS PubMed.
- Y. Shen, B. Maliwal and J. Lakowicz, J. Fluoresc., 2001, 11, 315 CrossRef CAS.
- Y. Reece and D. G. Nocera, J. Am. Chem. Soc., 2005, 127, 9448 CrossRef PubMed.
- H. Tsubaki, A. Sekine, Y. Ohashi, K. Koike, H. Takeda and O. Ishitani, J. Am. Chem. Soc., 2005, 127, 15544 CrossRef CAS PubMed.
- A. Kamecka, K. Prachnio and A. Kapturkiewicz, J. Lumin., 2018, 203, 409 CrossRef CAS.
- S. Sato and O. Ishitani, Coord. Chem. Rev., 2015, 282–283, 50 CrossRef CAS.
- C. D. Windle and R. N. Perutz, Coord. Chem. Rev., 2012, 256, 2562 CrossRef CAS.
- Q. Zhao, F. Li and C. Huang, Chem. Soc. Rev., 2010, 39, 3007 RSC.
- K. K.-W. Lo, K. Y. Zhang and S. P.-Y. Li, Eur. J. Inorg. Chem., 2011, 3551 CrossRef CAS.
- K. K.-W. Lo, Acc. Chem. Res., 2015, 48, 2985 CrossRef CAS PubMed.
- L. C.-C. Lee, K.-K. Leung and K. K.-W. Lo, Dalton Trans., 2017, 46, 16357 RSC.
- G.-W. Zhao, J.-H. Zhao, Y.-X. Hu, D.-Y. Zhang and X. Li, Synth. Met., 2016, 212, 131 CrossRef CAS.
- Y. Yamazaki, H. Takeda and O. Ishitani, J. Photochem. Photobiol., C, 2015, 25, 106 CrossRef CAS.
- A. Kamecka and A. Kapturkiewicz, Phys. Chem. Chem. Phys., 2015, 17, 23332 RSC.
- A. Kamecka, K. Suwińska and A. Kapturkiewicz, Phys. Chem. Chem. Phys., 2016, 18, 28982 RSC.
- A. Kamecka, V. Muszyńska and A. Kapturkiewicz, J. Lumin., 2017, 192, 842 CrossRef CAS.
- A. Ito and T. J. Meyer, Phys. Chem. Chem. Phys., 2012, 14, 13731 RSC.
- Y. Shimura, Bull. Chem. Soc. Jpn., 1988, 61, 693 CrossRef CAS.
- P. Chen and T. J. Meyer, Inorg. Chem., 1996, 35, 5520 CrossRef CAS PubMed.
- R. A. Marcus, J. Phys. Chem., 1990, 94(12), 4963 CrossRef CAS.
- M. Bixon, J. Jortner and J. W. Verhoeven, J. Am. Chem. Soc., 1994, 116, 7349 CrossRef CAS.
- J. W. Verhoeven, T. Scherer, B. Wegewijs, R. M. Hermant, J. Jortner, M. Bixon, S. Depaemelaere and F. C. De Schryver, Recl. Trav. Chim. Pays-Bas, 1995, 114, 443 CrossRef CAS.
- M. Senoue, T. Iwaki, K. Seki and M. Yagi, J. Photochem. Photobiol., A, 1996, 101, 257 CrossRef CAS.
- M. A. A. Rashid, B. Saad, E.-S. M. Negim and M. I. Saleh, World Appl. Sci. J., 2012, 17, 958 Search PubMed.
- J. Higuchi, K. Suzuki, H. Arai, A. Saitoh and M. Yagi, J. Phys. Chem., 1986, 90, 1270 CrossRef CAS.
- R. A. Marcus, J. Chem. Phys., 1956, 24, 1261 Search PubMed.
- R. A. Marcus, Annu. Rev. Phys. Chem., 1964, 15, 155 CrossRef CAS.
- R. A. Marcus, J. Phys. Chem., 1989, 93, 3078 CrossRef CAS.
- Electron Transfers – From Isolated Molecules to Biomolecules: Advances in Chemical Physics, ed. J. Jortner and M. Bixon, vol. 106–107, Wiley, New York, 1999 Search PubMed.
- Electron Transfer in Chemistry, ed. V. Balzani, vol. 1, Wiley-VCH, Weinheim, 2001 Search PubMed.
- J. Cortes, H. Heitele and J. Jortner, J. Phys. Chem., 1994, 98, 2527 CrossRef CAS.
- J. Jortner, J. Chem. Phys., 1976, 64, 4860 CrossRef CAS.
- M. Bixon and J. Jortner, J. Phys. Chem., 1991, 95, 1941 CrossRef CAS.
- R. S. Mulliken, J. Am. Chem. Soc., 1952, 74, 811 CrossRef CAS.
- R. S. Mulliken, J. Phys. Chem., 1952, 56, 801 CrossRef CAS.
- N. S. Hush, Prog. Inorg. Chem., 1967, 8, 391 CAS.
- N. S. Hush, Electrochim. Acta, 1968, 13, 1005 CrossRef CAS.
- K. A. Walters, Y.-J. Kim and J. T. Hupp, Inorg. Chem., 2002, 41, 2909 CrossRef CAS PubMed.
- A. B. Maurer, E. J. Piechota and G. J. Meyer, J. Phys. Chem., 2019, 123, 8745 CrossRef CAS PubMed.
- J. V. Caspar and T. J. Meyer, J. Am. Chem. Soc., 1983, 105, 5583 CrossRef CAS.
- S. E. Angell, Y. Zhang, C. W. Rogers, M. O. Wolf and W. E. Jones Jr, Inorg. Chem., 2005, 44, 7377 CrossRef CAS PubMed.
- J.-F. Guillemole, V. Barone, L. Joubert and C. Adamo, J. Phys. Chem. A, 2002, 106, 11354 CrossRef.
- M. E. Casida, C. Jamorski, K. C. Casida and D. R. Salahub, J. Chem. Phys., 1989, 108, 4439 CrossRef.
- S. Miertus, S. Scrocco and T. Tomasi, Chem. Phys., 1981, 55, 117 CrossRef CAS.
- P. J. Hay and W. R. Wadt, J. Chem. Phys., 1985, 82, 299 CrossRef CAS.
- Z.-Z. Xie and W.-H. Fang, J. Mol. Struct.: THEOCHEM, 2005, 717, 179 CrossRef CAS.
- L. Yang, A.-M. Ren, J.-K. Feng, X.-J. Liu, Y.-G. Ma, M. Zhang, X.-D. Liu, J.-C. Shen and H.-X. Zhang, J. Phys. Chem. A, 2004, 108, 6797 CrossRef CAS.
- R. Heydová, E. Gindensperger, R. Romano, J. Sýkora, A. Vlček Jr, S. Záliš and C. Daniel, J. Phys. Chem. A, 2012, 116, 11319 CrossRef PubMed.
- A. El Nahhas, C. Consani, A. M. Blanco-Rodríguez, K. M. Lancaster, O. Braem, A. Cannizzo, M. Towrie, I. P. Clark, S. Záliš, M. Chergui and A. Vlček Jr, Inorg. Chem., 2011, 50, 2932 CrossRef CAS PubMed.
- B. Machura, M. Wolff, M. Jaworska, P. Lodowski, E. Benoist, C. Carrayon, N. Saffon, R. Kruszynski and Z. Mazurak, J. Organomet. Chem., 2011, 696, 3068 CrossRef CAS.
- F. Zhao, J.-X. Wang, W.-Q. Liu and Y.-B. Wang, Comput. Theor. Chem., 2012, 985, 90 CrossRef CAS.
- B. J. Powell, Sci. Rep., 2015, 5, 10815 CrossRef CAS PubMed.
- A. C. Jacko, B. J. Powell and R. H. McKenzie, J. Chem. Phys., 2010, 133, 124314 CrossRef CAS PubMed.
- J. Kotlicka and Z. R. Grabowski, J. Photochem., 1979, 11, 413 CAS.
- G. Baryshnikov, B. Minaev and H. Ågren, Chem. Rev., 2017, 117, 6500 CrossRef CAS.
- H. Yersin, Highly Efficient OLEDs with Phosphorescent Materials, Wiley-VCH, Weinheim, 2008 Search PubMed.
- E. Y.-T. Li, T.-Y. Jiang, Y. Chib and P.-T. Chou, Phys. Chem. Chem. Phys., 2014, 16, 26184 RSC.
- T. J. Penfold, E. Gindensperger, C. Daniel and C. M. Marian, Chem. Rev., 2018, 118, 6975 CrossRef CAS PubMed.
- M. R. Gonçalves and K. P. M. Frin, Polyhedron, 2017, 132, 20 CrossRef.
- R. A. Velapoldi, in National Bureau of Standards Special Publication 378, Accuracy in Spectrophotometry and Luminescence Measurements. Proc. Conf. NBS, Gaithersburg, MD, 1972, p. 231 Search PubMed.
- D. W. Marquardt, J. Soc. Ind. Appl. Math., 1963, 11, 431 CrossRef.
- M. J. Frisch, G. W. Trucks, H. B. Schlegel, G. E. Scuseria, M. A. Robb, J. R. Cheeseman, G. Scalmani, V. Barone, B. Mennucci, G. A. Petersson, H. Nakatsuji, M. Caricato, X. Li, H. P. Hratchian, A. F. Izmaylov, J. Bloino, G. Zheng, J. L. Sonnenberg, M. Hada, M. Ehara, K. Toyota, R. Fukuda, J. Hasegawa, M. Ishida, T. Nakajima, Y. Honda, O. Kitao, H. Nakai, T. Vreven, J. A. Montgomery Jr, J. E. Peralta, F. Ogliaro, M. Bearpark, J. J. Heyd, E. Brothers, K. N. Kudin, V. N. Staroverov, T. Keith, R. Kobayashi, J. Normand, K. Raghavachari, A. Rendell, J. C. Burant, S. S. Iyengar, J. Tomasi, M. Cossi, N. Rega, J. M. Millam, M. Klene, J. E. Knox, J. B. Cross, V. Bakken, C. Adamo, J. Jaramillo, R. Gomperts, R. E. Stratmann, O. Yazyev, A. J. Austin, R. Cammi, C. Pomelli, J. W. Ochterski, R. L. Martin, K. Morokuma, V. G. Zakrzewski, G. A. Voth, P. Salvador, J. J. Dannenberg, S. Dapprich, A. D. Daniels, O. Farkas, J. B. Foresman, J. V. Ortiz, J. Cioslowski and D. J. Fox, Gaussian 09, Revision D.01, Gaussian, Inc., Wallingford CT, 2013 Search PubMed.
| This journal is © The Royal Society of Chemistry 2020 |