 Open Access Article
Dansyl-modified carbon dots with dual-emission for pH sensing, Fe3+ ion detection and fluorescent ink
Hua Tiana,
Yongcheng Daia,
Wenzhe Fua,
Haifang Liub,
Mengting Li*a,
Meiyuan Lva and
Xueqiong Yin *a
*a
aHainan Provincial Fine Chemical Engineering Research Center, School of Chemical Engineering and Technology, Hainan University, 58th Renmin Road, Haikou, Hainan 570228, P. R. China. E-mail: limengting2016@163.com; yxq88@hotmail.com; Fax: +86 898 66291383; Tel: +86 898 66279161 Tel: +86 13138907588
bCentral Laboratory, Affiliated Haikou Hospital Xiangya School of Medicine, Central South University (Haikou Municipal People Hospital), Haikou, Hainan 570208, P. R. China
First published on 7th October 2020
Abstract
In this work, a multifunctional ratiometric fluorescence (FL) nanohybrid (CSCDs@DC) was synthesized from chitosan based carbon dots (CSCDs) and dansyl chloride (DC) at room temperature. The CSCDs@DC revealed strong FL intensity, great stability and excellent anti-photobleaching properties. Herein, CSCDs@DC was responsive to pH value in the range of 1.5–4.0 and exhibited color-switchable FL properties between acidic and alkaline environments. In addition, CSCDs@DC showed good selectivity and sensitivity towards Fe3+ ions. A good linear relationship for the Fe3+ ion detection was obtained in the range from 0 μM to 100 μM, with a detection limit of 1.23 μM. What's more, CSCDs@DC can be used as a fluorescent ink. It expressed superior optical properties after 3 months of storage or continuous exposure to UV light for 24 h. This study suggested that CSCDs@DC had potential in the detection of pH and metal ions, as well as showing promising application in the anti-counterfeiting field.
Introduction
As we all know, pH and metal ions play important roles in the environment, and biological and industrial areas, and both have received great research interest in the past decade.1,2 Monitoring the change of pH value is needed due to its great impact.3 In the environment field, acid rain and raw sewage result in the pollution of soil and water, which is attributed to the change of pH values.4 Besides, in the biological area, pH has a close relationship with active compounds in biological macromolecules.5 Therefore, it is very important to measure the pH variation in our surroundings. Nowadays, there are many methods and techniques for pH sensing. In particular, optical method has attracted a lot of attention in pH measurement attribute to the good performance of rapid response, high signal-to-noise ratio, and good sensitivity.6 Metal ions play the crucial roles in the metabolism.7 Deficiency of Fe3+ ions in the body may decrease oxygen delivery to cells, which would lead to anemia. While excess Fe3+ ions in a living cell can cause serious damage such as liver and kidney diseases.8 Moreover, Fe3+ ion has an important effect on the environment. Indirectly, low concentration iron in high nutrient low chlorophyll areas became the limitation for primary productivity (algal growth) in vast areas of the oceans, which might result in the regulation of the global climate via a reduction of the ability of the oceanic phytoplankton to sink atmospheric CO2.9 Therefore, it is very important to quantify Fe3+ ions content. To date, many approaches have been utilized to evaluate the presence of Fe3+ ions, such as inductively coupled plasma mass spectrometry, atomic absorption spectrometry, spectrophotometry, and voltammetry.10–13 However, these methods are either time-consuming, expensive equipment requirement or tedious sample pretreatment. Therefore, it is necessary to find a rapid and accurate method to detect Fe3+ ions. Acid rain is an important environmental pollutant, whose pH can reach 1.5–4.5.14 Acidic water with a pH of approximately 5.2 or even lower can promote the corrosion of metal surfaces. pH can change the solubility of heavy metals from construction and demolition waste, and most heavy metals exist a secondary dissolution at pH 5.3. Under lower pH condition, the desorption of metals such as Fe will be increased significantly.15 Fe3+ ions released from buildings or industrial wastes caused by acid rain has caused serious environmental and health problems. Therefore, the pH value and Fe3+ ions content in acid rain need to be monitored simultaneously. It would be interesting to develop a multi-mode platform to address the issues by an all-in-one strategy.Recently, the fluorometric detection methods have been applied in visualization inspections due to high sensitivity, good selectivity and rapid response. Fluorescent carbon dots (CDs) have been revealed to be a promising fluorescent material because of the outstanding properties, such as good fluorescence (FL) stability, strong water solubility, biocompatibility, low toxicity, abundant precursor sources and facile functionalization property.16–18 Besides, doping is an effective approach to improve the optical properties. For example, B, N, S, and P could improve emission properties of CDs. Among these, N-doping was very effective.19 The amino functional groups on the surface of CDs can improve the water solubility, reduce the potential biotoxicity and enhance the photoluminescence property.20,21 Thus, N-doped CDs had been prepared by various methods and widely applied in sensing. Chitosan (CS) is a natural copolymer, which is obtained by deacetylation of chitin. CS contains the monomers of 2-aminoglucose and N-acetylaminoglucose,22 which makes it an interesting precursor for N-doped CDs preparation. Janus et al. synthesized N-doped chitosan-based CDs with high quantum yield (11.5%) in a microwave radiation field. The CDs had nontoxicity and could be a potential in biomedical applications.23 In summary, CS is a good raw material for N-doped CDs that have good water solubility, photoluminescence property and low toxicity.
There are a few reports about N-doped CDs fluorescent methods for pH and Fe3+ ions sensing. Wang et al. synthesized N-doped CDs by hydrothermal carbonization. The N-doped CDs displayed a remarkable emission enhancement when the pH was increased from 2 to 10. And it showed a good linear relationship when the concentration of Fe3+ is in the range from 0 to 1.6 μM.24 Chen et al. reported that N-CDs showed strong orange fluorescence, certain water solubility property and obvious FL quenching to Fe3+ ions and pH. Furthermore, the N-CDs exhibited outstanding biocompatibility and cell imaging ability. The N-CDs were successfully introduced into HeLa cells to detect intracellular Fe3+.25 Nevertheless, most of these fluorescent sensors depend on a single emission intensity change, which can be affected by many factors including instrumental efficiency, environmental conditions and the concentration of probe molecules. Thus, ratiometric fluorescent sensors which can produce dual-emission fluorescence were developed. Compared with the single-emission fluorescent response, the ratiometric fluorescent sensor can eliminate the described disadvantages and make the detection become more sensitive and accurate.26 In addition, the ratiometric fluorescent sensor can offer a built-in environmental interference correction, which excludes the fluctuation of light excitation intensity.27 With these in mind, many CDs have been synthesized and constructed as ratiometric FL sensors for pH, thiols, heavy-metal. Sun et al. synthesized multicolor emissive carbon dots as a ratiometric fluorescent sensor for Fe3+ ions detection by microwave irradiation.28 Xia et al. developed a kind of intrinsic dual-emission CDs via a facile hydrothermal for ratiometric fluorescent pH sensing.29 However, few CDs based ratiometric fluorescent sensors are used for pH sensing and Fe3+ ions detection simultaneously. Therefore, it is significant to design a multifunctional ratiometric fluorescent sensor with CDs for both evaluations directly.
Dansyl (1-(dimethylamino)-naphthalene-5-sulfonyl) fluorophore has attractive properties due to its intense absorption bands in the near UV and a strong FL in the visible region with high emission quantum yields and easy derivation.30 In addition, dansyl fluorophore is sensitive to micro-environmental change attributed to intramolecular charge transfer (ICT) and easy to be introduced at the N-terminal of many compounds containing amino group.31–35 These characteristics make dansyl fluorophore a core structure in most fluorescent sensors for detecting anions and cations.36 There are some reports on the synthesis of FL sensors by grafting dansyl fluorophore with organic compounds, but such sensors need detect targets in organic reagents. For example, Chen et al. synthesized a fluoride selective fluorescent chemosensor based on sulfonamide derivatives for fluoride ion detection in acetonitrile.37 Liu et al. prepared a fluorescent sensor containing hydrazide and dansyl groups for amino acid anions recognition in CHCl3.38 Originally, dansyl chloride (DC) can't dissolve in water, which limits its application. While, we found that the solubility can be improved by grafting the dansyl fluorophore onto CDs through the amino group. Furthermore, by combining dansyl fluorophore and amino groups, sulfonyl groups can be converted into sulfonamide groups with stronger electron absorption ability, which is beneficial to ICT fluorescence emission.
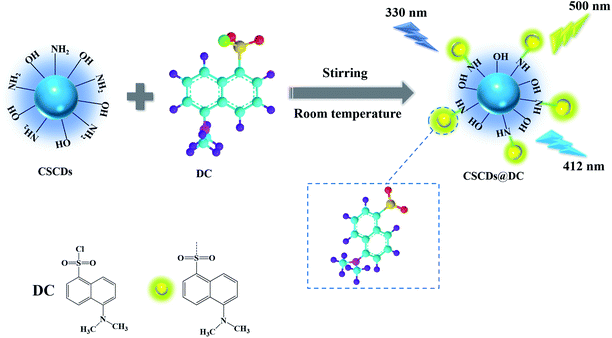
In this study, we designed a multifunctional ratiometric FL nanohybrid (CSCDs@DC) by grafting dansyl fluorophore onto N-doped CDs (CSCDs), which can be employed as sensor in the pH sensing and Fe3+ ions detection. Furthermore, CSCDs@DC was also investigated as fluorescent inks. CSCDs@DC showed good selectivity, high sensitivity and great stability. The CSCDs were prepared by hydrothermal treatment of CS. CSCDs@DC was fabricated by modifying the CSCDs with dansyl fluorophore at room temperature (Scheme 1). The chemical structure and optical properties of CSCDs@DC were characterized by the transmission electron microscopy (TEM), the Fourier transform infrared spectroscopy (FTIR), the UV-vis spectrophotometry and the FL spectrophotometry. Our study provided a new strategy for developing the multifunctional fluorescence platform based on carbon dots.
Experimental
Materials
Chitosan (CS, deacetylation degree ≥ 95%, Aladdin Ltd.), dansyl chloride (DC, Sigma-Aldrich). All other reagents used in the experiment were analytical grade and used without further purification. Ultrapure water was used throughout the experiment. FeCl3, CaCl2, FeSO4·7H2O, CdN2O6·4H2O, Mg(NO3)2·6H2O, Cu(NO3)2·4H2O, BaCl2·2H2O, HgCl2, K2Cr2O7, Pb(NO3)2 were purchased from Guangzhou Chemical Reagent Factory (Guangzhou, China). Stock solutions of CSCDs@DC (1.0 mg mL−1) were prepared in the ultrapure water.Preparation of CSCDs
CSCDs were prepared according literature and modified accordingly.20 1 g CS was dispersed in 20 mL ultrapure water by stirring with a magnetic stirrer at room temperature. Then the mixture solution was transferred to a poly(tetrafluoroethylene) (Teflon)-lined autoclave and heated at 160 °C for 12 h. After the reaction, the reactor was cooled down to room temperature naturally. The brown-yellow product was centrifuged at 8000 rpm for 20 min and passed through a 0.22 μm micron filter.Synthesis of CSCDs@DC
The CSCDs@DC was prepared through a facile method. DC was dissolved in acetone and then added into CSCDs solution. The reaction mixture was stirred for 12 h at room temperature and further removed the acetone by applying vacuum-rotary evaporation. Then the mixture was centrifuged at 8000 rpm for 10 min and passed through a 0.22 μm micron filter. Finally, the suspension was dialyzed against ultrapure water through a dialysis membrane (MWCO 500–1000 Da) for 24 h and then freeze dried. The CSCDs@DC was dispersed in the ultrapure water as stock solution (1 mg mL−1) for further study. The synthetic mechanism for the preparation of the CSCDs@DC was shown in Scheme 1.Detection of pH
1 M HCl solution, 1 M NaOH solution and 0.1 M phosphate buffer solution (PBS) were prepared and mixed with different volume ratio to get solutions with different pH value (1.0, 1.5, 2.0, 2.5, 3.0, 3.5, 4.0, 5.0, 6.0, 7.0, 8.0, 9.0, 10.0, 11.0, 12.0). Then, 300 μL CSCDs@DC and 1.7 mL solution with different pH value were pipetted into 4 mL cuvette. The FL intensity was then measured with excitation at 330 nm. The relationship between FL intensity and the pH value was studied.Detection of Fe3+ ions
The selectivity of CSCDs@DC as a sensor for the detection of Fe3+ ions was explored. The different metal ions including Ba2+, Ca2+, Cd2+, Cu2+, Fe2+, Fe3+, Hg2+, Mg2+, Pb2+, Cr2O72− at a concentration of 100 μM were mixed with 0.4 mg mL−1 CSCDs@DC aqueous solution, respectively.39 The effect of typical interfering metal ions on the FL behavior of CSCDs@DC was investigated to evaluate the selectivity of CSCDs@DC. The sensitivity of Fe3+ ions detection was performed by adding different concentrations of Fe3+ ions at room temperature. The pH of the mixed solution was adjusted to 6.0. The FL intensity was measured with excitation at 330 nm.Instrumentation
The transmission electron microscopic (TEM) image was performed on a JEM-2100 microscope using an acceleration voltage of 200 kV. Fourier transform infrared spectroscopy (FTIR) experiments were conducted on a Bruker TENSOR 27 spectrometer in the form of KBr pellets. The UV-vis absorption spectra were recorded on a TU-1901 UV-vis spectrophotometer (China). FL emission spectra were recorded by a F-320 fluorescence spectrophotometer (China).Results and discussion
Optimization of synthesis conditions of CSCDs@DC
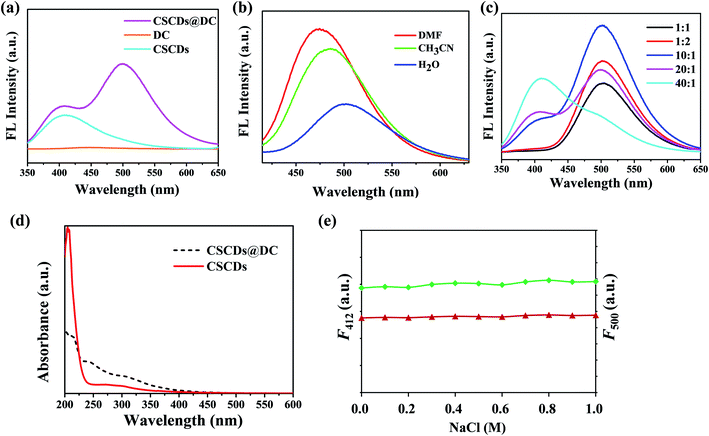
To investigate the optical properties of CSCDs, DC and CSCDs@DC, the absorbance and FL spectra were performed. In Fig. 1a, compared the FL spectra of CSCDs, DC and CSCDs@DC, the FL emission of CSCDs was at 412 nm, however, the FL emission of DC was not observed. Furthermore, the FL emission spectra of CSCDs@DC in aqueous solution showed the marked dual emission peak positions at 412 nm and 500 nm under an excitation of 330 nm. The solvatochromic effect of the FL spectra of CSCDs@DC was determined. Fig. 1b shows that CSCDs@DC exhibited a red-shift of 26 nm, when the solvent polarity was increased gradually from DMF to H2O: 474 nm in DMF, 485 nm in CH3CN, 500 nm in H2O. The FL intensity of CSCDs@DC exhibited an obvious decreasing with increasing solvent polarity. The results of solvatochromic effect indicated a charge-transfer (CT) state.40,41 It was considered that the sharp FL intensity of CSCDs@DC at 500 nm was ascribed to ICT.34,42 It indicated the formation of fluorescent CSCDs@DC.To establish the ratiometric fluorescent assay, the mass ratio of CSCDs and DC was investigated in detail. As shown in Fig. 1c, the ratio of the two fluorescent components had a significant effect on the FL intensities of the sensor. The fluorescent CSCDs@DC with different mass ratio had emissions at 412 nm and 500 nm under an excitation of 330 nm. When the CSCDs/DC ratio changed from 1![[thin space (1/6-em)]](https://www.rsc.org/images/entities/char_2009.gif) :
:![[thin space (1/6-em)]](https://www.rsc.org/images/entities/char_2009.gif) 2 to 40
2 to 40![[thin space (1/6-em)]](https://www.rsc.org/images/entities/char_2009.gif) :
:![[thin space (1/6-em)]](https://www.rsc.org/images/entities/char_2009.gif) 1, F412/F500 changed visibly. Firstly, when DC mass increasing, the amount of dansyl group grafted onto the CSCD increased. Therefore, the FL intensity at 500 nm increased. When the CSCDs/DC ratio was 20
1, F412/F500 changed visibly. Firstly, when DC mass increasing, the amount of dansyl group grafted onto the CSCD increased. Therefore, the FL intensity at 500 nm increased. When the CSCDs/DC ratio was 20![[thin space (1/6-em)]](https://www.rsc.org/images/entities/char_2009.gif) :
:![[thin space (1/6-em)]](https://www.rsc.org/images/entities/char_2009.gif) 1, F412 and F500 became nearer, suggesting a more flexible scope of ratiometric variation.43 By contrast, when the CSCDs/DC ratio deviated from this value, a negligible peak at 412 nm or 500 nm was observed. It was probably that too much CSCDs or dansyl fluorophore could submerge the FL from each other. Thus, a suitable ratio of 20
1, F412 and F500 became nearer, suggesting a more flexible scope of ratiometric variation.43 By contrast, when the CSCDs/DC ratio deviated from this value, a negligible peak at 412 nm or 500 nm was observed. It was probably that too much CSCDs or dansyl fluorophore could submerge the FL from each other. Thus, a suitable ratio of 20![[thin space (1/6-em)]](https://www.rsc.org/images/entities/char_2009.gif) :
:![[thin space (1/6-em)]](https://www.rsc.org/images/entities/char_2009.gif) 1 was adopted in the following study.
1 was adopted in the following study.
Optical properties
The UV-vis spectra are shown in Fig. 1d. The three absorption peaks at 210 nm, 242 nm and 310 nm were ascribed to the π–π* transition of the C![[double bond, length as m-dash]](https://www.rsc.org/images/entities/char_e001.gif) C bond, the π–π* transition of aromatic sp2 hybridization, and n–π* transition of the C
C bond, the π–π* transition of aromatic sp2 hybridization, and n–π* transition of the C![[double bond, length as m-dash]](https://www.rsc.org/images/entities/char_e001.gif) O bond,44,45 respectively. CSCDs (red) had two absorption peaks at 210 nm and 310 nm. CSCDs@DC (black) had three absorption peaks at 210 nm, 242 nm and 310 nm. The absorption peaks at 242 nm attributed to the π–π* transition of aromatic sp2 hybridization. It indicated dansyl fluorophores were introduced onto CSCDs. In addition, the effect of ionic strength on the FL stability of CSCDs@DC was investigated. As shown in Fig. 1e, F412 (red) and F500 (green) of CSCDs@DC did not change obviously under various concentrations of NaCl, which revealed that CSCDs@DC was stable in the salt environments.
O bond,44,45 respectively. CSCDs (red) had two absorption peaks at 210 nm and 310 nm. CSCDs@DC (black) had three absorption peaks at 210 nm, 242 nm and 310 nm. The absorption peaks at 242 nm attributed to the π–π* transition of aromatic sp2 hybridization. It indicated dansyl fluorophores were introduced onto CSCDs. In addition, the effect of ionic strength on the FL stability of CSCDs@DC was investigated. As shown in Fig. 1e, F412 (red) and F500 (green) of CSCDs@DC did not change obviously under various concentrations of NaCl, which revealed that CSCDs@DC was stable in the salt environments.
Structural features of CSCDs@DC
Fig. 2a and b show the TEM images of CSCDs and CSCDs@DC with a scale bar of 20 nm. Fig. 2a expresses the spherical shaped CSCDs particles are uniformly dispersed without apparent aggregation. The particle size distribution of CSCDs was calculated by Nano Measurer. The diameter of CSCDs is mainly distributed in the range of 1.5–6.8 nm, with the mean diameter of 3.6 nm. As shown in Fig. 2b, it was observed that CSCDs were covered by DC. And larger particles were formed apparently in the TEM image of CSCDs@DC. It indicates the formation of the CSCDs@DC nanohybrid.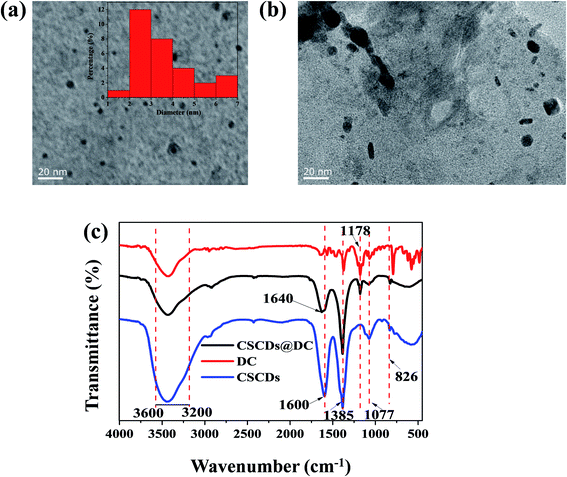 | ||
| Fig. 2 (a) TEM image of CSCDs (the inset is the particle size distribution histogram). (b) TEM image of CSCDs@DC. (c) The FTIR spectra of CSCDs, DC and CSCDs@DC. | ||
The FTIR spectra are shown in Fig. 2c. The peaks at 3600–3200 cm−1 were attributed to the stretching vibrations of O–H and N–H.46 The FTIR spectrum of CSCDs (the blue curve) indicated that the absorption band 1600 cm−1 was the bending vibrations of amine group (–NH2).47 The absorption band at 1385 cm−1 was associated with C–H and N–H bending vibrations.48 The peak at 1077 cm−1 was ascribed to the stretching of the C–O,49 and the peak at 826 cm−1 was N–H deformation vibration.6 These peaks suggested that the function groups (–NH2, –OH) existed on the surface of CSCDs. In the spectrum of DC (the red curve), the peak at 1148–1252 cm−1 was corresponded to O![[double bond, length as m-dash]](https://www.rsc.org/images/entities/char_e001.gif) S
S![[double bond, length as m-dash]](https://www.rsc.org/images/entities/char_e001.gif) O asymmetric stretch indicated the presence of sulfamate groups.50 Compared with the FTIR spectra of CSCDs and DC, there were the characteristic peaks of –NH2, N–H, –OH, and O
O asymmetric stretch indicated the presence of sulfamate groups.50 Compared with the FTIR spectra of CSCDs and DC, there were the characteristic peaks of –NH2, N–H, –OH, and O![[double bond, length as m-dash]](https://www.rsc.org/images/entities/char_e001.gif) S
S![[double bond, length as m-dash]](https://www.rsc.org/images/entities/char_e001.gif) O in CSCDs@DC (the black curve). The absorption intensity at 1600 cm−1 in the spectrum of CSCDs@DC was obviously weaker than in that of CSCDs. And it was found that there was a new peak at 1640 cm−1 which was ascribed to the amide bond.51 It indicated the sulfonyl group in the dansyl fluorophore converted into sulfonamide. These results revealed that the dansyl fluorophores had connected to the amino groups on the surface of CSCDs. The characterization proved that the CSCDs@DC was synthesized using a facile method.
O in CSCDs@DC (the black curve). The absorption intensity at 1600 cm−1 in the spectrum of CSCDs@DC was obviously weaker than in that of CSCDs. And it was found that there was a new peak at 1640 cm−1 which was ascribed to the amide bond.51 It indicated the sulfonyl group in the dansyl fluorophore converted into sulfonamide. These results revealed that the dansyl fluorophores had connected to the amino groups on the surface of CSCDs. The characterization proved that the CSCDs@DC was synthesized using a facile method.
pH-response property
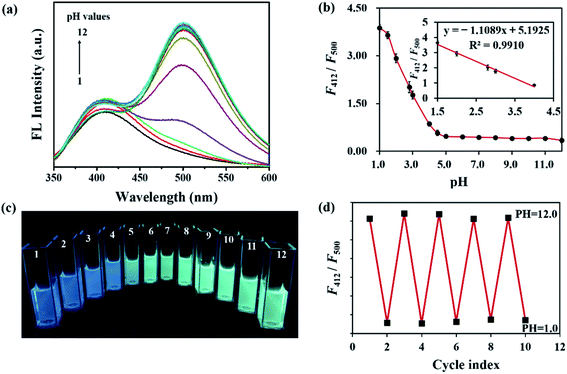
In Fig. 3a, the effect of pH on the FL behavior of CSCDs@DC was explored by changing the pH values from 1.0 to 12.0. In the pH-response assay, the FL intensity of CSCDs@DC emission at 412 nm was basically stable. However, the FL intensity at 500 nm exhibited a decrease in acid solutions, whereas almost no change was observed in neutral to alkaline solutions. As shown in Fig. 3b, the ratiometric FL intensity (F412/F500) of CSCDs@DC decreased at different pH values from 1.0 to 4.0, while changed negligibly at the pH values from 5.0 to 12.0. Meanwhile, the inset in Fig. 3b showed a good linear relationship of F412/F500 against pH value in the range of 1.5–4.0, (regression equation: y = −1.1089x + 5.1925, R2 = 0.9910). Compared with the reported CDs52 which displayed a good linear relationship in the range of 4.0 to 6.5, the CSCDs@DC could accurately test the pH value of strong acidic solutions (pH 1.5–4.0). Given such property, the CSCDs@DC could be used as a new kind of pH sensor.Fig. 3c shows a gradient color change of CSCDs@DC solution with different pH values from 1.0 to 12.0 irradiated by 365 nm UV light. It exhibited blue color in acidic solution (pH ≤ 4) and green color in basic solution. It also indicated that F412 was not affected by pH, and F500 had a quenching in an acidic environment. The quenching of FL intensity at 500 nm might be due to the reduction of ICT by the protonation of dimethylamine at lower pH values.51,53 Therefore, F500 could be used as the testing signal while F412 as the internal standard signal in pH measurements. In addition, the FL reversibility against pH was carried out by adjusting the pH values between 1.0 and 12.0 repeatedly. As shown in Fig. 3d, the ratiometric FL intensity (F412/F500) of CSCDs@DC presented a good reproducibility between the strong acidic solution (pH 1.0) and the strong alkaline solution (pH 12.0). CSCDs@DC exhibited good photostability and FL reversibility in different pH solutions. Thus, it can be applied as an excellent nanosensor for environment and industry pH measurement.
Sensing of Fe3+ ions
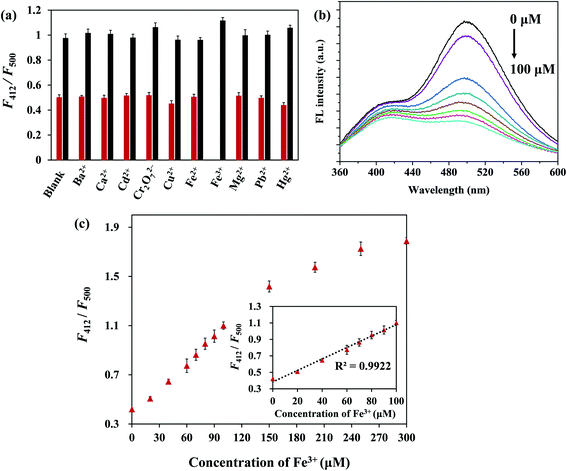
As shown in Fig. 4a, F500 under an excitation of 330 nm was more decreased in the presence of Fe3+ ions than other metal ions (Ba2+, Ca2+, Cd2+, Cu2+, Fe2+, Fe3+, Hg2+, Mg2+, Pb2+, Cr2O72−), and F412 changed less noticeably than F500. Therefore, F412/F500 was used to indicate the change of FL. Only Fe3+ ions induced a distinct change of F412/F500, whereas other metal ions caused almost no change. Meanwhile, the influence of interference on sensing of Fe3+ ions was evaluated by adding Fe3+ ions in the presence of other metal ions. With the subsequent addition of Fe3+ ions into other metal ion solutions respectively, F412/F500 was increased markedly. It revealed that the CSCDs@DC had high selectivity and good anti-interference ability for the Fe3+ detection.Fig. 4b shows the FL quenching of CSCDs@DC at various concentrations of Fe3+ ions. The FL emission ratio (F412/F500) increased progressively with increasing the concentrations of Fe3+ ions, which indicated that the sensing system was sensitive to Fe3+ ions concentration. The relationship between F412/F500 and Fe3+ ions concentration was presented in Fig. 4c. A good linear relationship was obtained in the range from 0 μM to 100 μM. The linear equation was F412/F500 = 0.0070Q + 0.3844 (R2 = 0.9922), where Q was the concentration of Fe3+ ion. On the basis of three times the standard deviation of 11 measurements of the blank signal of CSCDs@DC aqueous solution, the limit of detection (LOD) was 1.23 μM (LOD = 3σ/K) in the range of 0–100 μM.54,55 The LOD was much lower than the Fe3+ ions permissible level in drinking water (5.4 μM) proposed by the Environmental Protection Agency (EPA).56 It was also comparable to the part previous reported proposed sensor for Fe3+ ions listed in Table 1. Therefore, the CSCDs@DC for the detection of Fe3+ ions had the superiority of wide linear ranges, low detection limit, simple operation, excellent selectivity and high sensitivity.
When Fe3+ ions were added to the as-prepared CSCDs@DC aqueous solution, F500 was obviously quenched. Upon the addition of an increasing amount of Fe3+, F500 gradually decreased. There were sulfonamide and hydroxy groups existed on the CSCDs@DC. It may originate from the complexation of the N in sulfonamide and the O in hydroxy group with Fe3+.57 Such complexation promoted the abundant electrons in the excited state of CSCDs@DC transferring to the 3d orbital of Fe3+ and finally caused the strong FL quenching. Meanwhile, the Fe3+-centered d–d states placed below the fluorophore π–π* states and can be used to deactive the fluorophore by electron transfer.58,59 Therefore, the ICT between CSCDs and dansyl group was blocked, then F500 was visibly reduced.
Application in fluorescent ink
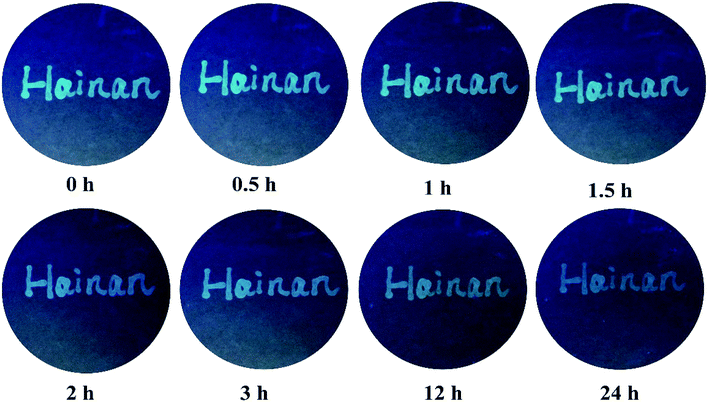
The strong FL intensity and great stability could also make CSCDs@DC become a potential alternative of the existing fluorescent inks. The CSCDs@DC aqueous solution was used to write on a filter paper. As shown in Fig. 5, the filter paper under 365 nm UV light showed a bright green FL and a clear pattern shape. After keeping for three months at room temperature and ambient pressure, the pattern still emitted a clear and intense green light under 365 nm UV excitation. It showed more excellent FL stability compared with the report that the CDs still had blue fluorescent characters after keeping a month.65 Furthermore, in Fig. 6, the hand-written patterns were still clearly visible after continuous exposure of UV light for 24 h. The results showed that the CSCDs@DC displayed strong resistance to photobleaching. Zhao et al. studied the FL stability and anti-photobleaching by irradiating GQD ink printed images under UV light for 180 min.66 In comparison to this report, our CDs ink hand-written patterns were more stable because the patterns can still be seen clearly in 24 h UV illumination. It indicates the CSCDs@DC ink is satisfactorily stable and retains the FL property for a long time.67 Herein, this study proved that the CSCDs@DC can be used as an alternative of fluorescent ink in anti-counterfeiting, information storage and information encryption fields.Conclusions
A new multifunctional ratiometric fluorescent nanohybrid called CSCDs@DC was synthesized from DC and CSCDs by a simple method at room temperature. The characterization of UV, FL, FTIR and TEM indicated that DC reacted with CSCDs by incorporating the dansyl group onto the surface of CSCDs. CSCDs@DC showed dual emission peaks at 412 nm and 500 nm. The FL intensity at 500 nm could respond to pH values and Fe3+ ions, while the FL intensity at 412 nm remained constant. The FL intensity of CSCDs@DC was pH dependent and performed a good linear relationship in the pH range of 1.5–4.0. In addition, CSCDs@DC enabled convenient detection of Fe3+ ions with a low LOD (1.23 μM). Importantly, the detection of pH values and Fe3+ ions content was executed simultaneously by both visible and FL variation. Moreover, the CSCDs@DC aqueous solution written on a filter paper expressed excellent FL stability and anti-photobleaching. The study indicated that the CSCDs@DC could be a kind of promising material used in environmental, biological, anti-counterfeit applications and so on.Conflicts of interest
There are no conflicts to declare.Acknowledgements
This work was financially supported by the Key Research and Development Project of Hainan Province (ZDYF2018232), the Project of Scientific Research Platform Construction of Hainan University (ZY2019HN09) and the National Science Foundation of China (21466011).References
- H. Ehtesabi, Z. Hallaji, S. Najafi Nobar and Z. Bagheri, Microchim. Acta, 2020, 187, 150 CrossRef CAS.
- S. Chowdhury, M. A. J. Mazumder, O. Al-Attas and T. Husain, Sci. Total Environ., 2016, 569–570, 476–488 CrossRef CAS.
- C. Zhang, Y. Cui, L. Song, X. Liu and Z. Hu, Talanta, 2016, 150, 54–60 CrossRef CAS.
- Y. Z. Fan, J. X. Dong, Y. Zhang, N. Li, S. G. Liu, S. Geng, Y. Ling, H. Q. Luo and N. B. Li, Spectrochim. Acta, Part A, 2019, 219, 382–390 CrossRef CAS.
- J. H. Yoon, S. B. Hong, S. O. Yun, S. J. Lee, T. J. Lee, K. G. Lee and B. G. Choi, J. Colloid Interface Sci., 2017, 490, 53–58 CrossRef CAS.
- J. Shangguan, D. He, X. He, K. Wang, F. Xu, J. Liu, J. Tang, X. Yang and J. Huang, Anal. Chem., 2016, 88, 7837–7843 CrossRef CAS.
- M. Lan, S. Zhao, X. Wei, K. Zhang, Z. Zhang, S. Wu, P. Wang and W. Zhang, Dyes Pigm., 2019, 170, 107574 CrossRef CAS.
- J. L. Bricks, A. Kovalchuk, C. Trieflinger, M. Nofz, M. Büschel, A. I. Tolmachev, J. Daub and K. Rurack, J. Am. Chem. Soc., 2005, 127, 13522–13529 CrossRef CAS.
- S. Caprara, L. M. Laglera and D. Monticelli, Anal. Chem., 2015, 87, 6357–6363 CrossRef CAS.
- A. Molkenova, Y. Amangeldinova, D. Aben, S. Sayatova and T. S. Atabaev, Sensing and Bio-Sensing Research, 2019, 23, 100271 CrossRef.
- Z.-Q. Liang, C.-X. Wang, J.-X. Yang, H.-W. Gao, Y.-P. Tian, X.-T. Tao and M.-H. Jiang, New J. Chem., 2007, 31, 906–910 RSC.
- M. Zheng and Z. Xie, Mater. Today Chem., 2019, 13, 121–127 CrossRef CAS.
- C. M. G. van den Berg, Anal. Chem., 2006, 78, 156–163 CrossRef CAS.
- A. M. Agrawal, J. Environ. Biol., 2008, 29, 15–24 Search PubMed.
- B. Zhao, A. Liu, G. Wu, D. Li and Y. Guan, J. Environ. Sci., 2017, 51, 284–293 CrossRef.
- W. Gao, Y. Zhou, C. Xu, M. Guo, Z. Qi, X. Peng and B. Gao, Sens. Actuators, B, 2020, 147, 453–462 Search PubMed.
- W. Gao, Y. Ma, Y. Zhou, H. Song, L. Li, S. Liu, X. Liu, B. Gao, C. Liu and K. Zhang, Mater. Lett., 2018, 216, 84–87 CrossRef CAS.
- H. Song, Y. Zhou, C. Xu, X. Wang, J. Zhang, Y. Wang, X. Liu, M. Guo and X. Peng, Dyes Pigm., 2019, 162, 160–167 CrossRef CAS.
- H. Wang, S. Liu, Y. Xie, J. Bi, Y. Li, Y. Song, S. Cheng, D. Li and M. Tan, New J. Chem., 2018, 42, 3729–3735 RSC.
- Y. Yang, J. Cui, M. Zheng, C. Hu, S. Tan, Y. Xiao, Q. Yang and Y. Liu, Chem. Commun., 2012, 48, 380–382 RSC.
- R. Zhang and W. Chen, Biosens. Bioelectron., 2014, 55, 83–90 CrossRef CAS.
- A. Ray Chowdhuri, S. Tripathy, C. Haldar, S. Roy and S. K. Sahu, J. Mater. Chem. B, 2015, 3, 9122–9131 RSC.
- L. Janus, M. Piatkowski, J. Radwan-Praglowska, D. Bogdal and D. Matysek, Nanomaterials, 2019, 9, 274 CrossRef CAS.
- R. Wang, X. Wang and Y. Sun, Sens. Actuators, B, 2017, 241, 73–79 CrossRef CAS.
- X. Chen, J. Bai, Y. Ma, G. Yuan, J. Mei, L. Zhang and L. Ren, Microchem. J., 2019, 149, 103981 CrossRef CAS.
- S. Pang and S. Liu, Anal. Chim. Acta, 2020, 1105, 115–161 CrossRef.
- C. Zou, M. F. Foda, X. Tan, K. Shao, L. Wu, Z. Lu, H. S. Bahlol and H. Han, Anal. Chem., 2016, 88, 7395–7403 CrossRef CAS.
- Z. Sun, Z. Yang, L. Zhao, Y. Zhang, Y. Li, J. Hou and L. Ding, New J. Chem., 2019, 43, 853–861 RSC.
- C. Xia, M. Cao, J. Xia, G. Zhou, D. Jiang, D. Zhang, J. Wang and H. Li, J. Mater. Chem. C, 2019, 7, 2563–2569 RSC.
- R. Métivier, I. Leray, B. Lebeau and B. Valeur, J. Mater. Chem., 2005, 15, 2965–2973 RSC.
- G. Fiorani, M. Selva, A. Perosa, A. Benedetti, F. Enrichi, P. Licence and T. L. Easun, Green Chem., 2015, 17, 538–550 RSC.
- L. Ding, Y. Fang, L. Jiang, L. Gao and X. Yin, Thin Solid Films, 2005, 478, 318–325 CrossRef CAS.
- L. N. Neupane, J. M. Kim, C. R. Lohani and K.-H. Lee, J. Mater. Chem., 2012, 22, 4003–4008 RSC.
- A. J. C. Silva, J. G. Silva Jr, S. Alves Jr, J. Tonholo and A. S. Ribeiro, J. Braz. Chem. Soc., 2011, 22, 1808–1815 CrossRef CAS.
- P. Srivastava, M. Shahid and A. Misra, Org. Biomol. Chem., 2011, 9, 5051–5055 RSC.
- X.-X. Zhao, J.-F. Zhang, W. Liu, S. Zhou, Z.-Q. Zhou, Y.-H. Xiao, G. Xi, J.-Y. Miao and B.-X. Zhao, J. Mater. Chem. B, 2014, 2, 7344–7350 RSC.
- C.-F. Chen and Q.-Y. Chen, Tetrahedron Lett., 2004, 45, 3957–3960 CrossRef CAS.
- S.-y. Liu, Y.-b. He, G.-y. Qing, K.-x. Xu and H.-j. Qin, Tetrahedron: Asymmetry, 2005, 16, 1527–1534 CrossRef CAS.
- W. Liu, H. Diao, H. Chang, H. Wang, T. Li and W. Wei, Sens. Actuators, B, 2017, 241, 190–198 CrossRef CAS.
- W. Li, D. Liu, F. Shen, D. Ma, Z. Wang, T. Feng, Y. Xu, B. Yang and Y. Ma, Adv. Funct. Mater., 2012, 22, 2797–2803 CrossRef CAS.
- L. Yao, S. Zhang, R. Wang, W. Li, F. Shen, B. Yang and Y. Ma, Angew. Chem., Int. Ed., 2014, 53, 2119–2123 CrossRef CAS.
- A. L. Chibac, M. Simionescu, G. Sacarescu, E. C. Buruiana and L. Sacarescu, Eur. Polym. J., 2017, 95, 82–92 CrossRef CAS.
- W. Yang, J. Ni, F. Luo, W. Weng, Q. Wei, Z. Lin and G. Chen, Anal. Chem., 2017, 89, 8384–8390 CrossRef CAS.
- P. Das, M. Bose, A. K. Das, S. Banerjee and N. C. Das, Macromol. Symp., 2018, 382, 1800077 CrossRef.
- M. Tang, B. Zhu, Y. Wang, H. Wu, F. Chai, F. Qu and Z. Su, Microchim. Acta, 2019, 186, 604 CrossRef.
- X. Jiang, J. Huang, T. Chen, Q. Zhao, F. Xu and X. Zhang, Int. J. Biol. Macromol., 2020, 153, 412–420 CrossRef CAS.
- A. P. Praxedes, A. J. da Silva, R. C. da Silva, R. P. Lima, J. Tonholo, A. S. Ribeiro and I. N. de Oliveira, J. Colloid Interface Sci., 2012, 376, 255–261 CrossRef CAS.
- X. Yang, Y. Zhuo, S. Zhu, Y. Luo, Y. Feng and Y. Dou, Biosens. Bioelectron., 2014, 60, 292–298 CrossRef CAS.
- W. Li, S. Huang, H. Wen, Y. Luo, J. Cheng, Z. Jia, P. Han and W. Xue, Anal. Bioanal. Chem., 2020, 412, 993–1002 CrossRef CAS.
- K. R. Holme and A. S. Perlin, Carbohydr. Res., 1997, 302, 7–12 CrossRef CAS.
- X. Wang, Y. Su, H. Yang, Z. Dong and J. Ma, Colloids Surf., A, 2012, 402, 88–93 CrossRef CAS.
- B. Li, H. Ma, B. Zhang, J. Qian, T. Cao, H. Feng, W. Li, Y. Dong and W. Qin, Microchim. Acta, 2019, 186, 341 CrossRef.
- M. Zhou, X. Wang, K. Huang, Y. Huang, S. Hu and W. Zeng, Tetrahedron Lett., 2017, 58, 991–994 CrossRef CAS.
- W. Gao, H. Song, X. Wang, X. Liu, X. Pang, Y. Zhou, B. Gao and X. Peng, ACS Appl. Mater. Interfaces, 2018, 10, 1147–1154 CrossRef CAS.
- X. He, Y. Han, X. Luo, W. Yang, C. Li, W. Tang, T. Yue and Z. Li, Food Chem., 2020, 320, 126624 CrossRef CAS.
- Y. Zhang, Z. Gao, X. Yang, J. Chang, Z. Liu and K. Jiang, RSC Adv., 2019, 9, 940–949 RSC.
- C. Sha, S. Lu, F. Lv and D. Xu, Res. Chem. Intermed., 2016, 42, 5825–5834 CrossRef CAS.
- L. Fu, J. Mei, J. Zhang, Y. Liu and F. Jiang, Luminescence, 2013, 28, 602–606 CrossRef CAS.
- Z. S. Qian, J. J. Ma, X. Y. Shan, H. Feng, L. X. Shao and J. R. Chen, Chem.–Eur. J., 2014, 20, 2254–2263 CrossRef CAS.
- F. Ming, J. Hou, D. Huo, J. Zhou, M. Yang, C. Shen, S. Zhang and C. Hou, Anal. Methods, 2019, 11, 4382–4389 RSC.
- J. Ahn, Y. Song, J. E. Kwon, S. H. Lee, K. S. Park, S. Kim, J. Woo and H. Kim, Mater. Sci. Eng., C, 2019, 102, 106–112 CrossRef CAS.
- L. Wang, J. S. Chung and S. H. Hur, Dyes Pigm., 2019, 171, 107752 CrossRef CAS.
- X. Zhou, G. Zhao, X. Tan, X. Qian, T. Zhang, J. Gui, L. Yang and X. Xie, Microchim. Acta, 2019, 186, 67 CrossRef.
- B. Huo, B. Liu, T. Chen, L. Cui, G. Xu, M. Liu and J. Liu, Langmuir, 2017, 33, 10673–10678 CrossRef CAS.
- D. Xu, F. Lei, H. Chen, L. Yin, Y. Shi and J. Xie, RSC Adv., 2019, 9, 8290–8299 RSC.
- J. Zhao, Y. Zheng, Y. Pang, J. Chen, Z. Zhang, F. Xi and P. Chen, J. Colloid Interface Sci., 2020, 579, 307–314 CrossRef CAS.
- Z. Wang, D. Chen, B. Gu, B. Gao, T. Wang, Q. Guo and G. Wang, Spectrochim. Acta, Part A, 2020, 227, 117671 CrossRef CAS.
| This journal is © The Royal Society of Chemistry 2020 |

