 Open Access Article
Creative Commons Attribution 3.0 Unported Licence
Equivalence of difluorodichloromethane (CFC-12) hydrolysis catalyzed by solid acid(base) MoO3(MgO)/ZrO2
Zhiqian
Li
 a,
Xiaofang
Tan
a,
Guoqin
Ren
a,
Yu
Chang
b,
Lijuan
Jia
a,
Kaijiao
Duan
a and
Tiancheng
Liu
a,
Xiaofang
Tan
a,
Guoqin
Ren
a,
Yu
Chang
b,
Lijuan
Jia
a,
Kaijiao
Duan
a and
Tiancheng
Liu
 *a
*a
aCollege of Chemistry and Environment, Yunnan Minzu University, National and Local Joint Engineering Research Center for Green Preparation Technology of Biobased Materials, Kunming 650500, Yunnan, China. E-mail: liutiancheng76@163.com; Tel: +8613708893755
bYunnan Technician College, Kunming, Yunnan 650500, China
First published on 11th September 2020
Abstract
In this paper, a solid acid(base) MoO3(MgO)/ZrO2 was prepared for the catalytic hydrolysis of difluorodichloromethane (CFC-12). The effects of the catalyst preparation method, calcination temperature, and hydrolysis temperature on the conversion rate of CFC-12 were studied. The catalysts were characterized by XRD, N2 isotherm adsorption desorption, NH3-TPD, and CO2-TPD. Meanwhile, the equivalence of the catalytic activity of MoO3(MgO)/ZrO2 for CFC-12 was studied. Research shows that the solid acid MoO3/ZrO2 and solid base MgO/ZrO2 catalyzed hydrolysis of CFC-12 is equivalent; the solid acid MoO3/ZrO2 is calcined at 600 °C for 3 h and the solid base MgO/ZrO2 is calcined at 600 °C for 6 h (co-precipitation) and 700 °C for 6 h (impregnated) at a catalytic hydrolysis temperature of 300–400 °C and CFC-12 concentration of 4%. The catalytic hydrolysis products obtained were CO, HCl, and HF, and the CFC-12 conversion rate almost reached 100%.
1 Introduction
Chlorofluorocarbons (CFCs) are a refrigerant trademark registered by the DuPont company in the United States. They were first invented in 1928 by Midgley (Thomas, Jr) in the United States. In 1980s, CFC-12 was widely used in various fields of production and life due to its excellent physical and chemical properties and low production costs, such as cleaning solvents, refrigerants, thermal insulation materials, sprays, and foaming agents,1 and its output had reached 1.44 million tons. Before the output could be controlled, the amount of CFC-12 emission had reached 20 million tons in the world.2 However, in June 1974, professor Rowland and Dr Molina of the University of California published a paper describing that the chlorine radicals produced by CFC decomposition in the stratosphere can rapidly decompose ozone and lead to the ozone hole.3 CFCs are also greenhouse gases,4 with a greenhouse effect of 3400–15000 times that of CO2 and 300–1400 times that of CH4; the emission of CFCs in the atmosphere leads to the increase in greenhouse gases on the earth, which leads to global warming,5 melting of polar glaciers, and rise in the sea level with serious adverse effects on the global environment and ecological balance.6–9 At present, the harmless treatment technologies of CFC-12 mainly include high temperature destruction method,10 plasma method,11–13 ray decomposition method,14,15 electrochemical decomposition method,16–18 and catalytic hydrogenation methods.19–21 However, these methods have certain limitations. Thus, it is urgent to find a safe and efficient method to degrade CFC-12. As a practical technology, the catalytic hydrolysis method has been studied more in the recent years. The catalytic hydrolysis method has the following advantages: it is easy to carry out thermodynamically; the required decomposition temperature is lower than that of other methods; the necessary reactants include water vapor, which is easily available; the catalytic hydrolysis process is simple and easy to set up; the catalytic hydrolysis products are HF and HCl that are easily neutralized by an alkali solution to avoid secondary pollution; other secondary hazardous waste is not generated, such as dioxin and fly ash produced by incineration.In view of the environmental pollution caused by a large number of low concentration CFC-12 gas22 discharged into the atmosphere, the technology of catalytic hydrolysis of CFC-12 with solid acid and solid base catalyst is proposed, and equivalence analysis is carried out. As an example, CFC-12 was mixed with water vapor and nitrogen was used as the equilibrium gas. After passing through the catalytic reaction bed filled with the catalyst, it can achieve the catalytic hydrolysis of low concentration CFC-12. The highest catalytic hydrolysis was 99.64%, in which Freon was almost completely degraded. This research project provides a certain basis for the harmless treatment of low concentration CFC-12. At the same time, it has a very important guiding and practical significance for promoting the technical field of solving CFC-12 and other CFCs in China.
2 Experimental
2.1. Materials and reagents
Gas CFC-12, Zhejiang Ju Hua limited company; N2, Kunming Guang rui da Gas Company Limited; ZrOCl2·8H2O (A. R.), Sino pharm group Chemical Reagents Company Limited; Mg(NO3)2·6H2O (A. R.), (NH4)6Mo7O24·4H2O (A. R.), SiO2 (A. R.), Tianjin wind boat Chemical Reagents Company Limited; NH3·OH (25%) (A. R.), AgNO3 (A. R.), Guangdong Guanghua Technology limited company; NaOH (A.R.), Chengdu Jinshan Chemical Reagents Company Limited.2.2. Experimental process
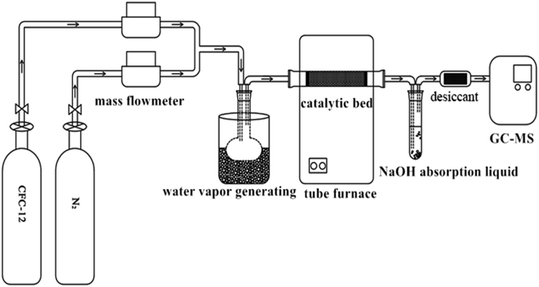
Quartz sand (the main component is SiO2) was used as a catalyst filler carrier, and 1.00 g of catalyst and 50 g of quartz sand were evenly mixed and filled in the quartz tube. Simulated reaction gas composition (mol%): 4.0 CFC-12, 25.0H2O(g), 5% O2, and the rest is N2. The generated acid gases HCl and HF were absorbed with an alkaline solution (NaOH solution) and silica gel was used as a drying agent. Sampling was carried out 10 min after reaching the required reaction conditions, and the collected gas was qualitatively and quantitatively analyzed by gas chromatography-mass spectrometry (Fig. 1).2.3. Catalyst characterization
The phase composition of the sample was measured by a Bruker D8 Advance X-ray diffractometer in Germany under the following conditions: Cu target, Kα radiation source, 2θ range of 10–90°, scanning rate of 12° min−1, step length of 0.01° s−1, working voltage and current of 40 kV and 40 mA, λ = 0.154178 nm. The specific surface area was calculated using the Brunauer–Emmett–Teller (BET) equation from N2 physisorption at −196 °C. The pore size distribution was measured by the BJH method from the adsorption branch. The surface acidity and basicity of the sample were measured by a Das-7200 automatic chemical adsorption instrument. 0.1 g sample was put into a quartz U-shaped tube, pretreated in nitrogen (30 mL min−1) at 200 °C for 1 h, cooled to 50 °C, absorbed in ammonia (30 mL min−1) at this temperature for 0.5 h, switched to He gas for purging until the signal was stable, heated to 900 °C at the rate of 10 °C min−1, and detected by the TCD-NH3 desorption signal. After pretreatment for 2 h at 700 °C in an argon atmosphere, the impurities on the surface were removed. When it was cooled to 30 °C, CO2 was absorbed to saturation. Then, CO2 on the surface was purged for 0.5 h by argon. Finally, the temperature was raised to 900 °C at the rate of 10 °C min−1. The CO2 desorption signal was detected by TCD.2.4. Analytical method
Gas chromatography-mass spectrometry (GC/MS) was used for quantitative and qualitative analysis. The instrument was Thermo Fisher ISQ manufactured by Thermo-Fisher Scientific, Inc. The column was a capillary column (100% dimethylpolysiloxane) manufactured by Thermo Fisher Scientific; the detection conditions were: inlet temperature 80 °C, column temperature 35 °C, retention time 3 min, carrier gas was high purity He (He ≥ 99.999%), flow rate of 1.00 mL min−1 in constant flow mode, split ratio was 100![[thin space (1/6-em)]](https://www.rsc.org/images/entities/char_2009.gif) :
:![[thin space (1/6-em)]](https://www.rsc.org/images/entities/char_2009.gif) 1. The mass spectrometer detector was an EI source with an electron energy of 70 eV, an ion source temperature of 260 °C, an ion transport rod temperature of 280 °C, and an injection volume of 0.1 mL.23 The qualitative and quantitative analyses of CFC-12 were performed under this analysis condition. The catalytic decomposition effect was mainly evaluated by the conversion rate of CFC-12 and the total yield of CO and CO2, and the calculation was as follows
1. The mass spectrometer detector was an EI source with an electron energy of 70 eV, an ion source temperature of 260 °C, an ion transport rod temperature of 280 °C, and an injection volume of 0.1 mL.23 The qualitative and quantitative analyses of CFC-12 were performed under this analysis condition. The catalytic decomposition effect was mainly evaluated by the conversion rate of CFC-12 and the total yield of CO and CO2, and the calculation was as follows| [Conversion rate of CFC-12] = ([CFC-12]in − [CFC-12]out)/[CFC-12]in × 100%; |
| [Yield of COx] = [COx]out/([CFC-12]in − [CFC-12]out) × 100% |
3 Results and discussion
3.1. Preparation of the MoO3/ZrO2 solid acid catalyst
The catalyst was prepared by the impregnation method. Firstly, 0.15 mol L−1 ZrOCl2·8H2O solution was placed in a 250 mL beaker. The water bath was heated to 60 °C and stirred to dissolve the salt. Then, 25% ammonia solution was slowly added until the pH value reached 9–10. It was then continually stirred at 60 °C for 1 h. Next, it was allowed to stand at room temperature for 12 h and washed until free from Cl− (detected with 0.1 mol L−1 AgNO3 solution), and the resulting filter cake was dried at 110 °C for 12 h. Then, it was ground and impregnated with 0.5 mol L−1 (NH4)6Mo7O24·4H2O solution for 4 h (ZrO2 mass fraction is 20%) at 80 °C, followed by filtration, drying at 110 °C for 24 h, and calcination at 500 °C, 550 °C, 600 °C, 650 °C, and 700 °C for 3 h. The obtained samples were ground to obtain the MoO3/ZrO2 catalyst.3.2. Characterization of the MoO3/ZrO2 solid acid catalyst
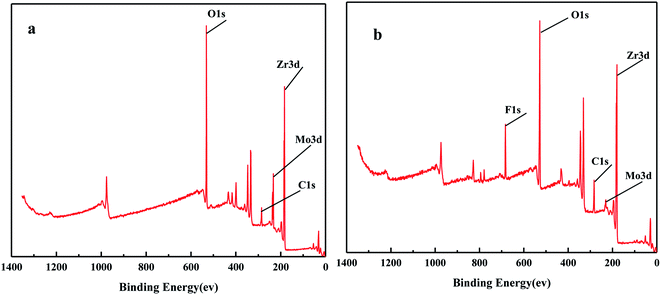
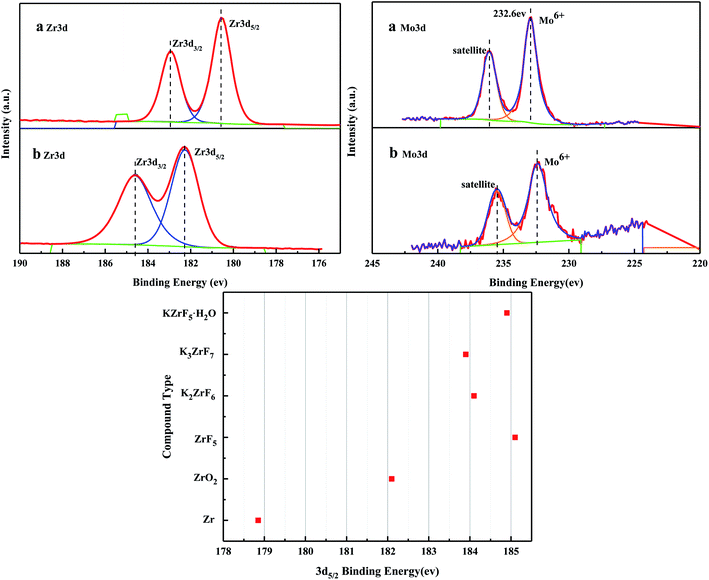
| Name | Peak BE | Areas (P) CPS. eV |
|---|---|---|
| a Zr3d5/2 | 179.05 | 91![[thin space (1/6-em)]](https://www.rsc.org/images/entities/char_2009.gif) 551.47 551.47 |
| Zr3d3/2 | 182.5 | 60![[thin space (1/6-em)]](https://www.rsc.org/images/entities/char_2009.gif) 087.61 087.61 |
| b Zr3d5/2 | 182.41 | 79![[thin space (1/6-em)]](https://www.rsc.org/images/entities/char_2009.gif) 567.05 567.05 |
| Zr3d3/2 | 1843 | 69![[thin space (1/6-em)]](https://www.rsc.org/images/entities/char_2009.gif) 248.59 248.59 |
| a Mo3d | 232.9 | 35![[thin space (1/6-em)]](https://www.rsc.org/images/entities/char_2009.gif) 922.37 922.37 |
| b Mo3d | 232.50 | 6448.93 |
3.3. Preparation of MgO/ZrO2 solid base catalyst by co-precipitation and impregnation method
ZrOCl2·8H2O and Mg (NO3)2·6H2O were used to prepare a 0.15 mol L−1 aqueous solution with n(Mg)![[thin space (1/6-em)]](https://www.rsc.org/images/entities/char_2009.gif) :
:![[thin space (1/6-em)]](https://www.rsc.org/images/entities/char_2009.gif) n(Zr) = 0.3
n(Zr) = 0.3![[thin space (1/6-em)]](https://www.rsc.org/images/entities/char_2009.gif) :
:![[thin space (1/6-em)]](https://www.rsc.org/images/entities/char_2009.gif) 1 by the co-precipitation method. The water bath was heated to 60 °C and stirred to dissolve the salts. 25% aqueous ammonia solution was slowly added until the pH = 9–10, stirred continually at 60 °C for 1 h, then stood at room temperature for 12 h, followed by washing until free from Cl− (detected with 0.1 mol L−1 AgNO3 solution). The resulting filter cake was dried at 110 °C for 12 h. They were calcined at 500 °C, 600 °C, 700 °C, and 800 °C for 6 h, and ground to obtain the MgO/ZrO2 catalyst.
1 by the co-precipitation method. The water bath was heated to 60 °C and stirred to dissolve the salts. 25% aqueous ammonia solution was slowly added until the pH = 9–10, stirred continually at 60 °C for 1 h, then stood at room temperature for 12 h, followed by washing until free from Cl− (detected with 0.1 mol L−1 AgNO3 solution). The resulting filter cake was dried at 110 °C for 12 h. They were calcined at 500 °C, 600 °C, 700 °C, and 800 °C for 6 h, and ground to obtain the MgO/ZrO2 catalyst.
0.15 mol L−1 ZrOCl2·8H2O solution was prepared by the impregnation method in a 250 mL beaker. The water bath was heated to 60 °C and stirred to dissolve the salt. 25% ammonia solution was slowly added until the pH = 9–10, stirred for 1 h, then stood at room temperature for 12 h, and washed until there was no Cl− (detected with 0.1 mol L−1 AgNO3 solution). The resulting filter cake was dried at 110 °C for 12 h. The dried filter cake was ground, immersed in 0.5 mol L−1 Mg (NO3)2·6H2O solution for 12 h (n(Mg)![[thin space (1/6-em)]](https://www.rsc.org/images/entities/char_2009.gif) :
:![[thin space (1/6-em)]](https://www.rsc.org/images/entities/char_2009.gif) n(Zr) = 0.3
n(Zr) = 0.3![[thin space (1/6-em)]](https://www.rsc.org/images/entities/char_2009.gif) :
:![[thin space (1/6-em)]](https://www.rsc.org/images/entities/char_2009.gif) 1), immersed at 40 °C, and filtered. The filter cake was dried at 110 °C for 12 h, calcined at 500 °C, 600 °C, 700 °C, and 800 °C for 6 h, and ground to obtain the MgO/ZrO2 catalyst.
1), immersed at 40 °C, and filtered. The filter cake was dried at 110 °C for 12 h, calcined at 500 °C, 600 °C, 700 °C, and 800 °C for 6 h, and ground to obtain the MgO/ZrO2 catalyst.
3.4. Characterization of the MgO/ZrO2 solid acid catalyst
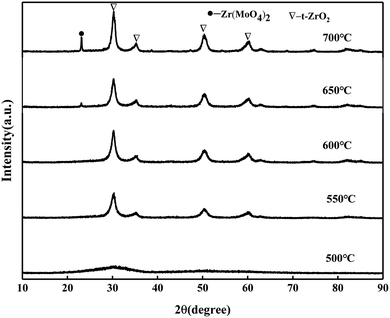
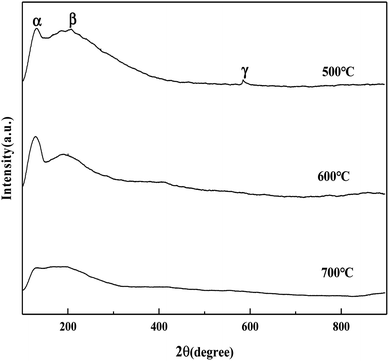
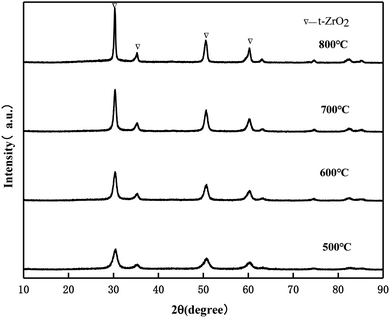
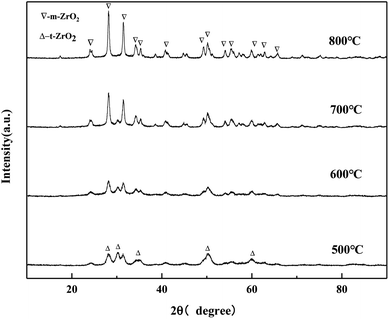
It can be seen from the Fig. 11 that when the calcination temperature is 500 °C, the crystal phase of ZrO2 is a mixed state of the tetragonal phase and the monoclinic phase, and its diffraction peak intensity is relatively weak. The monoclinic phase ZrO2 gradually protruded, and the diffraction peak becomes more and more sharp, indicating that the grain size of the catalyst samples increases after sintering to a certain extent, which is consistent with the BET characterization results of the catalyst. The diffraction peak of MgO was not detected, which may be because the impregnation method caused the uniformly distribution of Mg (NO3)2·6H2O on the surface of ZrO2. MgO generated by pyrolysis after baking did not yet reach its detection threshold, so its diffraction peak was not detected in the XRD pattern.
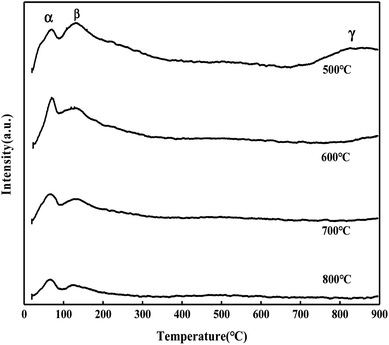
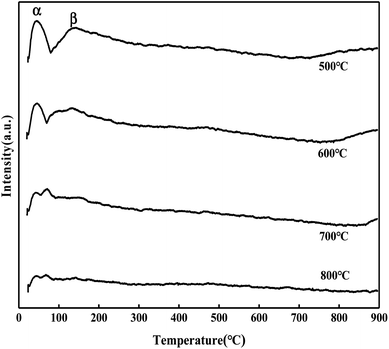
It can be seen from Fig. 15 that the CO2 desorption peak of the MgO/ZrO2 catalyst prepared by the impregnation method is only the CO2 desorption peak of ZrO2, and the peak area and peak intensity are weak, and there is no γ desorption peak. With the increase in the calcination temperature, the desorption amount of CO2 is significantly reduced and less than the CO2 desorption amount of the MgO/ZrO2 catalyst prepared by the coprecipitation method. Also, compared with the coprecipitation method, the α and β desorption peaks in the impregnation method tend to move in the low temperature direction. Combined with XRD, the ZrO2 crystal phase is dominated by the monoclinic phase in the impregnation method and the tetragonal phase in the coprecipitation method. The basicity of tetragonal ZrO2 is slightly higher than that of the monoclinic phase. The stronger the basicity, the higher the catalytic activity, which has been verified in the above catalytic hydrolysis effect.
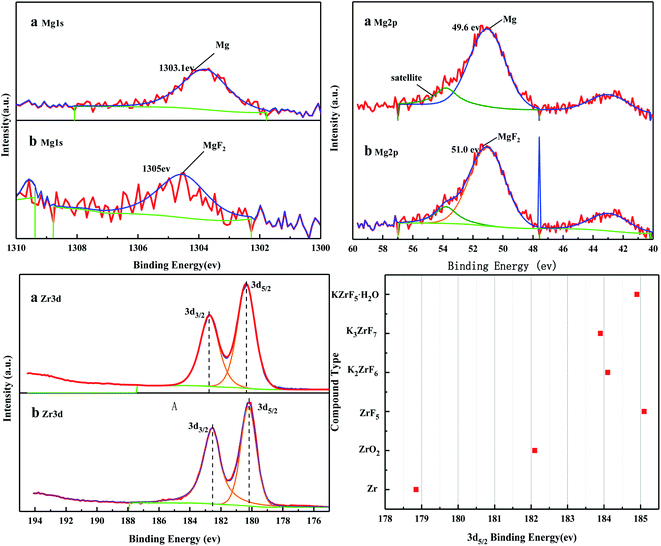
| Name | Pea BE | Areas (P) CPS. eV |
|---|---|---|
| a Zr3d5/2 | 179.05 | 106![[thin space (1/6-em)]](https://www.rsc.org/images/entities/char_2009.gif) 203.83 203.83 |
| Zr3d3/2 | 182.54 | 77![[thin space (1/6-em)]](https://www.rsc.org/images/entities/char_2009.gif) 793.35 793.35 |
| b Zr3d5/2 | 182.19 | 86![[thin space (1/6-em)]](https://www.rsc.org/images/entities/char_2009.gif) 083.39 083.39 |
| Zr3d3/2 | 184.53 | 85![[thin space (1/6-em)]](https://www.rsc.org/images/entities/char_2009.gif) 421.70 421.70 |
| a Mg1s | 1303.1 | 2617.38 |
| b Mg1s | 1305 | 1487.31 |
| a Mg2P | 49.6 | 5644.51 |
| b Mg2p | 51.00 | 5916.44 |
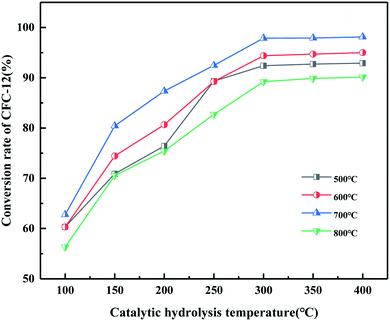 | ||
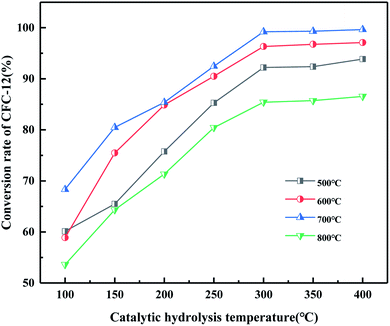
| Fig. 19 Effect of MgO/ZrO2 prepared by coprecipitation at different calcination temperatures on the conversion of CFC-12. | ||
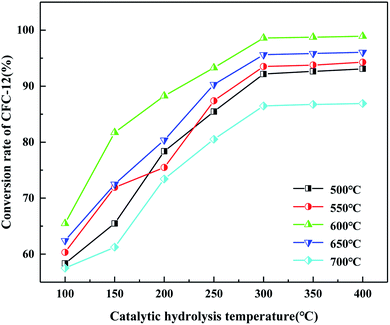
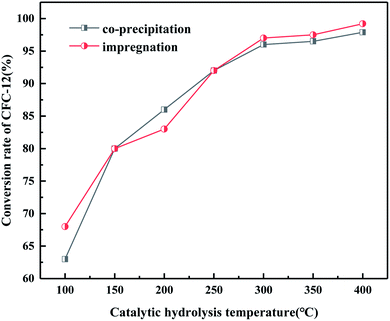
It can be seen from Fig. 20 that the trend of catalytic hydrolysis of CFC-12 is consistent with that of the MgO/ZrO2 catalyst prepared by the co-precipitation method on CFC-12. The conversion rate of CFC-12 was more than 99% when the calcination temperature was 700 °C and the catalytic hydrolysis temperature was 300 °C. With the increase in the calcination temperature, the hydrolysis rate decreased. It can be concluded that a very high or very low calcination temperature of the catalyst is not conducive for hydrolysis.
3.5. BET characterization of solid base(acid) MgO (MoO3)/ZrO2
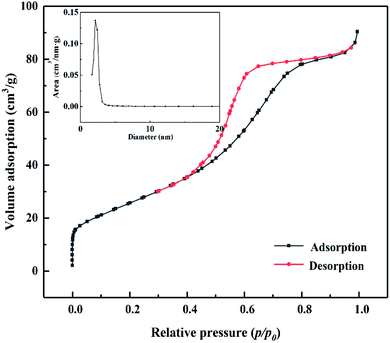
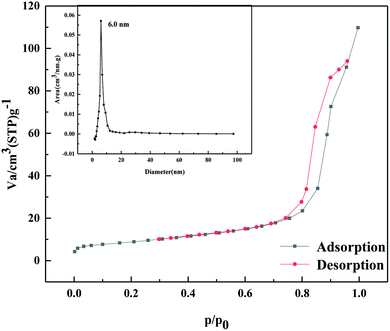
It can be seen from Table 3 that with the increase in the catalyst calcination temperature, the specific surface area and total pore volume of the catalyst gradually decrease, and, in turn, the average pore size increases. When the calcination temperature is 500 °C, the specific surface area of the catalyst prepared by the co-precipitation method is much higher than that by the impregnation method; the specific surface area is as high as 134.510 m2 g−1. As the calcination temperature increases, the specific surface area decreases sharply, indicating that the catalyst has a certain degree of sintering. Combined with XRD, the intensity of the diffraction peak is enhanced to a certain extent with the increase in the calcination temperature. The specific surface area of the catalyst calcined at 800 °C is reduced by 119.96 m2 g−1 compared with that at 500 °C. The surface area of the catalyst prepared by the impregnation method slowly decreases as the calcination temperature increases. Combined with XRD, with the increase in the calcination temperature, monoclinic ZrO2 is the main phase, the diffraction peak becomes sharp, the crystallinity increases, and the grain size increases. It can be seen that the ZrO2 crystal phase transitions and the catalyst surface is sintered, which causes the specific surface area of the catalyst to gradually decrease.| Calcination temperature | Specific surface area/m2 g−1 | Average pore size/nm | Total pore volume/cm3 g−1 | |
|---|---|---|---|---|
| Coprecipitation MgO/ZrO2 | 500 °C | 134 | 2.41 | 0.237 |
| 600 °C | 59 | 4.63 | 0.216 | |
| 700 °C | 34 | 6.94 | 0.177 | |
| 800 °C | 14 | 14.1 | 0.162 | |
| Dipping MgO/ZrO2 | 500 °C | 85 | 3.55 | 0.232 |
| 600 °C | 51 | 6.06 | 0.197 | |
| 700 °C | 30 | 6.06 | 0.170 | |
| 800 °C | 20 | 9.21 | 0.167 | |
| MoO3/ZrO2 | 400 °C | 245 | 1.66 | 0.115 |
| 500 °C | 197 | 2.41 | 0.221 | |
| 600 °C | 95 | 2.31 | 0.136 | |
| 700 °C | 63 | 3.12 | 0.125 |
3.6. Equivalent analysis of difluorodichloromethane (CFC-12) hydrolysis catalyzed by solid acid (base) MoO3(MgO)/ZrO2
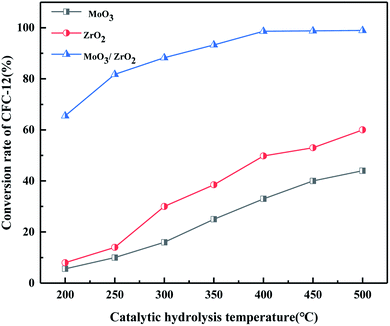
It can be seen from Table 4 that the solid acid MoO3/ZrO2 was calcined at 600 °C for 3 h, the solid base MgO/ZrO2 (coprecipitated) was calcined at 700 °C for 6 h, and the solid base MgO/ZrO2 (impregnated) calcined at 700 °C for 6 h. When the catalytic hydrolysis temperature is in the range of 300–400 °C and the CFC-12 concentration is 4%, the catalytic hydrolysis products are CO, HCl, and HF, and the conversion rate of CFC-12 reaches 95–100%, indicating that the solid acid MoO3/ZrO2 and the solid alkaline MgO/ZrO2 catalytic hydrolysis of CFC-12 is equivalent. The phases of the solid acid MoO3/ZrO2 and solid base MgO/ZrO2 (co-precipitation) catalysts are mainly the tetragonal ZrO2 crystal phase. For the solid base MgO/ZrO2 (impregnation), the phase is a mixed state of tetragonal ZrO2 and monoclinic ZrO2, and both have a moderate specific surface area.| Judging conditions | Solid acid MoO3/ZrO2 | Solid base MgO/ZrO2 (coprecipitation) | Solid base MgO/ZrO2 (impregnation) | |
|---|---|---|---|---|
| Catalyst preparation conditions | Calcination temperature | 600 °C | 700 °C | 700 °C |
| Calcination time | 3 h | 6 h | 6 h | |
| Catalytic conditions | Hydrolysis temperature | 300–400 °C | ||
| CFC-12 concentration | 4% | |||
| Hydrolysis rate | 98.61% | 97.89% | 99.21% | |
| Catalytic hydrolysate | CO, HCl, HF | |||
| Characterization results | Phase composition | t-ZrO2 | t-ZrO2, m-ZrO2 | |
| Specific surface area | 134 m2 g−1 | 34 m2 g−1 | 31 m2 g−1 | |
| NH3/CO2 adsorption capacity | 0.58476 | 0.63761 | 0.54632 | |
| Acidity/basicity | Weak acidity | Weak alkalinity | Weak alkalinity | |
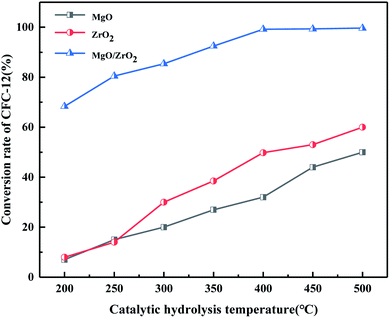
The above research results show that the supported solid acid MoO3/ZrO2 and solid base MgO/ZrO2 catalysts have strong catalytic activity for the catalysis of CFC-12, and are equivalent to a certain extent. Taking the CFC-12 hydrolysis rate of 95–100% as the evaluation criterion, the catalyst preparation conditions (catalyst calcination temperature and calcination time), catalytic hydrolysis conditions (catalytic hydrolysis temperature and CFC-12 concentration), and catalytic hydrolysate combined catalyst characterization results (phase composition, specific surface area, and NH3/CO2 adsorption capacity) were comprehensively studied and analyzed, concluding the equivalence of CFC-12 catalyzed by solid acid MoO3/ZrO2 and solid base MgO/ZrO2 (Fig. 22).
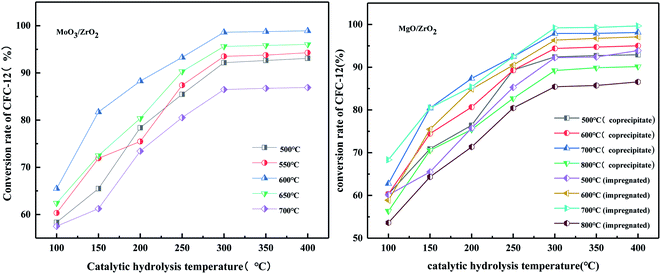 | ||
| Fig. 22 Catalytic hydrolysis of difluorodichloromethane (CFC-12) by solid acid MoO3/ZrO2 and solid base MgO/ZrO2. | ||
4 Conclusions
The solid acid MoO3/ZrO2 and solid base MgO/ZrO2 catalysts respectively catalyze the hydrolysis of CFC-12. For the solid acid MoO3/ZrO2 catalyst calcined at 600 °C for 3 h, the CFC-12 hydrolysis rate is convenient when the catalytic hydrolysis temperature is 400 °C, which reached 98.91% decomposition. For the solid base MgO/ZrO2 catalyst roasted at 700 °C for 6 h by the co-precipitation method, the conversion rate of CFC-12 reached 98.13% at a catalytic hydrolysis temperature of 400 °C, and solid base roasted at 700 °C for 6 h by dipping method the MgO/ZrO2 catalyst has a CFC-12 conversion rate of 99.64% at a catalytic hydrolysis temperature of 400 °C. The solid acid MoO3/ZrO2 and solid base MgO/ZrO2 catalysts both exhibit very good catalytic activity when catalytically hydrolyzing CFC-12. The solid acid MoO3/ZrO2 and solid base MgO/ZrO2 catalysts have strong catalytic activity when catalyzing CFC-12, and are equivalent to a certain extent. For the solid acid MoO3/ZrO2 calcined at 600 °C for 3 h, the solid base MgO/ZrO2 calcined at 700 °C for 6 h (coprecipitation), and the solid base MgO/ZrO2 calcined at 700 °C for 6 h (impregnated) at a catalytic hydrolysis temperature in the range of 300–400 °C and CFC-12 concentration of 4%, the catalytic hydrolysis products are CO, HCl, and HF, and the CFC-12 hydrolysis rate reached 95–100%, indicating that solid acid MoO3/ZrO2 and solid base MgO/ZrO2 catalysis hydrolysis of CFC-12 is equivalent. The phases of the solid acid MoO3/ZrO2 and solid base MgO/ZrO2 catalysts are mainly the tetragonal ZrO2 crystal phases, and all have moderate specific surface areas.Abbreviations
| CFC-12 | Difluorodichloromethane |
| CFCs | Chlorofluorocarbon |
Author contributions
The manuscript was written by contributions of all authors.Funding sources
No competing financial interests have been declared.Conflicts of interest
There are no conflicts of interest.Acknowledgements
Yunnan Minzu University is gratefully acknowledged for providing us with the facilities for the XRD and BET studies. At the same time, I would like to thank Xiaofang Tan, Guoqing Ren, Yu Chang, Lijuan Jia, Kaijiao Duan for helping with the experiment and Professor Tiancheng Liu's guidance in the experiment.References
- J. Xu, J. Hu and J. Zhang, J. Environ. Sci., 2003, 23, 363–366 CAS.
- A. McCulloch, J. Fluorine Chem., 2003, 123, 21–29 CrossRef CAS.
- M. J. Molina and F. S. Rowland, Nature, 1974, 249, 810–812 CrossRef CAS.
- W. M. Longo, Y. Huang, J. M. Russell, C. Morrill, W. C. Daniels, A. E. Giblin and J. Crowther, Quat. Sci. Rev., 2020, 242, 106438 CrossRef.
- J. M. Desantes, S. Molina, R. Novella and M. Lopez-Juarez, Energy Convers. Manage., 2020, 221, 113137 CrossRef CAS.
- Y. Y. Li, S. Huang, C. X. Yin, G. H. Sun and C. Ge, J. Cleaner Prod., 2020, 254, 120072 CrossRef.
- R. K. Dixon, Mitigation and Adaptation Strategies for Global Change, 2011, 16, 567–584 CrossRef.
- M. Dameris, Angew. Chem., Int. Ed., 2010, 49, 489–491 CrossRef CAS.
- M. Dameris, Angew. Chem., Int. Ed., 2010, 49, 8092–8102 CrossRef CAS PubMed.
- M. Jasiński, J. Mizeraczyk, Z. Zakrzewski, T. Ohkubo and J.-S. Chang, J. Phys. D: Appl. Phys., 2002, 35, 2274 CrossRef.
- Y.-F. Wang, W.-J. Lee and C.-Y. Chen, J. Aerosol Sci., 1997, 1001, S279–S280 CrossRef.
- C. L. Ricketts, A. E. Wallis, J. C. Whitehead and K. Zhang, J. Phys. Chem. A, 2004, 108, 8341–8345 CrossRef CAS.
- Y.-F. Wang, W.-J. Lee, C.-Y. Chen and L.-T. Hsieh, Environ. Sci. Technol., 1999, 33, 2234–2240 CrossRef CAS.
- S. Salehkoutahi and C. A. Quarles, J. Electron Spectrosc. Relat. Phenom., 1988, 46, 349–355 CrossRef CAS.
- E. Kemnitz, A. Kohne, I. Grohmann, A. Lippitz and W. Unger, J. Catal., 1996, 159, 270–279 CrossRef CAS.
- Z. Liu, X. Pan, W. Dong, H. Hou, Z. Zhang, J. Hou, Y. Yu and C. Li, Environ. Sci., 1997, 95–99 Search PubMed.
- J. Casado, Chemical Degradation Methods for Wastes Pollutants, Environmental Industrial Applications, 2003, p. 235 Search PubMed.
- Y. Xu, H. Ma, T. Ge, Y. Chu and C.-A. Ma, Electrochem. Commun., 2016, 66, 16–20 CrossRef CAS.
- M. Bonarowska, A. Malinowski, W. Juszczyk and Z. Karpiński, Appl. Catal., B, 2001, 30, 187–193 CrossRef CAS.
- M. Bonarowska, B. Burda, W. Juszczyk, J. Pielaszek, Z. Kowalczyk and Z. Karpiński, Appl. Catal., B, 2001, 35, 13–20 CrossRef CAS.
- T. Liu, P. Ning, Y.-m. Wang and H. Gao, Asian J. Chem., 2010, 22, 4431 CAS.
- L. A. Chambers, D. C. Gooddy and A. M. Binley, Geosci. Front., 2019, 10, 1643–1652 CrossRef CAS.
- G. Ren, L. Jia, G. Zhao, T. Zhou, X. Yang, R. Li, Y. Chang and T. Liu, Catal. Lett., 2019, 149, 507–512 CrossRef CAS.
- B.-y. Zhao, H.-r. Ma and Y.-q. Tang, Chin. J. Catal., 1995, 16, 3 Search PubMed.
- V. Guidi, M. C. Carotta, M. Ferroni, G. Martinelli and M. Sacerdoti, J. Phys. Chem. B, 2003, 107, 120–124 CrossRef CAS.
- H. Wang, S. Liu, W. Zhang, N. Zhao, W. Wei and Y. Sun, Acta Chim. Sin., 2006, 64, 2409 CAS.
- T. Bhaskar, K. R. Reddy, C. P. Kumar, M. R. V. S. Murthy and K. V. R. Chary, Appl. Catal., A, 2001, 211, 189–201 CrossRef CAS.
| This journal is © The Royal Society of Chemistry 2020 |

