
 Open Access Article
 This Open Access Article is licensed under a
 Creative Commons Attribution 3.0 Unported Licence
Probing calcium solvation by XAS, MD and DFT calculations†
Feipeng Yang ab,
Yi-Sheng Liuab,
Xuefei Fengab,
Kun Qianc,
Li Cheng Kaob,
Yang Hab,
Nathan T. Hahnad,
Trevor J. Seguinae,
Mesfin Tsigec,
Wanli Yangb,
Kevin R. Zavadilad,
Kristin A. Perssonaef and
Jinghua Guo*abg
ab,
Yi-Sheng Liuab,
Xuefei Fengab,
Kun Qianc,
Li Cheng Kaob,
Yang Hab,
Nathan T. Hahnad,
Trevor J. Seguinae,
Mesfin Tsigec,
Wanli Yangb,
Kevin R. Zavadilad,
Kristin A. Perssonaef and
Jinghua Guo*abg
aJoint Center for Energy Storage Research, Lemont, IL 60439, USA
bAdvanced Light Source, Lawrence Berkeley National Laboratory, Berkeley, CA 94720, USA
cDepartment of Polymer Science, The University of Akron, Akron, OH 44325, USA
dMaterial, Physical and Chemical Sciences Center, Sandia National Laboratories, Albuquerque, NM 87185, USA
eEnergy Technologies Area, Lawrence Berkeley National Laboratory, Berkeley, CA 94720, USA
fDepartment of Materials Science and Engineering, University of California, Berkeley, CA 94720, USA
gDepartment of Chemistry and Biochemistry, University of California, Santa Cruz, CA 95064, USA. E-mail: jguo@lbl.gov
First published on 21st July 2020
Abstract
The solvation shell structures of Ca2+ in aqueous and organic solutions probed by calcium L-edge soft X-ray absorption spectroscopy (XAS) and DFT/MD simulations show the coordination number of Ca2+ to be negatively correlated with the electrolyte concentration and the steric hindrance of the solvent molecule. In this work, the calcium L-edge soft XAS demonstrates its sensitivity to the surrounding chemical environment. Additionally, the total electron yield (TEY) mode is surface sensitive because the electron penetration depth is limited to a few nanometers. Thus this study shows its implications for future battery studies, especially for probing the electrolyte/electrode interface for electrochemical reactions under in situ/operando conditions.
Introduction
Calcium, as the fifth abundant element in the earth crust,1 not only plays a significant role in many geologic and biogenic processes, but also is a promising candidate for “beyond-lithium-ion” batteries with the potential to revolutionize energy storage. Geologically, calcium is a major component of ground and saline waters and many other geologic formations.2 Biochemically, the calcium ion is the most abundant cation in the human body, and plays an essential part in the process of nerve action and muscle.3 Calcium carbonate is a major mineral formed in various biomineralization processes, such as the grinding tip of the sea urchin tooth,4 sea urchin larval spicule,5 and coral skeletons.6 With five different crystalline polymorphs, anhydrous phases and hydrated phases, the mechanism of such phase transitions has been investigated systematically using X-ray absorption spectroscopy (XAS) and photoelectron emission spectromicroscope.7–9 From the perspective of energy science, calcium oxide works as a catalyst in the production of biodiesel, part of which process is due to the dissolution of the activated CaO in methanol that creates homogeneous leached active species.10 As a promising candidate in multivalent battery technologies, it offers the promise of more than two-fold increase in the volumetric capacity compared to the monovalent lithium-ion batteries.1 Being nontoxic, safe and economic, and with a comparable cell voltage and energy density, calcium battery serves as an attractive candidate for “beyond-lithium-ion” battery technologies.11,12Common to the applications mentioned above is the fundamental question of the calcium environment, e.g. solvation in both aqueous and non-aqueous solutions. Ions in solution are usually coordinated primarily by solvent molecules, interacting via electrostatic forces and/or hydrogen bonds. However, in electrochemical systems, facile solvation and desolvation at an electrified interface is necessary for continuous operations. Here we present a molecular-scale study, at relevant (nanometer) distances from an interface, which is of crucial importance for understanding such solvation phenomena. An understanding of the ion solvation and its variation at the atomic level will allow adjusting the ion solubility, reactivity and stability independently, leading to breakthroughs in battery and electrochemical science.13,14
As an important topic in understanding battery materials, the investigation of calcium solvation has started early in the 1980s. Probst and coworkers used molecular dynamics (MD) calculations and X-ray scattering methods to study 1.1 M aqueous CaCl2 aqueous solution, and found a total of 33 water molecules are engaged in either the first or second coordination sphere, while there is a large overlap between the coordination shells of different ions.15 Later in 2003, calcium K-edge absorption spectroscopy was used by Fulton et al. to probe the effects of concentration variations on the first-shell structure of Ca2+ in aqueous solution.16 A mean coordination number of 7.2 ± 1.2H2O molecules and an average Ca–O distance of 2.437 ± 0.010 Å were derived from 6 M CaCl2 aqueous solutions. An accurate description of calcium solvation in concentrated aqueous solutions was developed in 2014 using a novel force field model in MD calculations by Kohagen and coworkers.17 A few years later, a combination of ab initio MD simulations and neutron scattering experiments were employed in the characterization of ion hydration and pairing in aqueous calcium chloride and formate/acetate solutions by Martinet et al.18 In a separate study by Guo et al., the solvent effect for the solvation structure of Ca2+ in polar molecular liquids were studied systematically using calcium K-edge X-ray absorption spectroscopy (XAS).19 In that work the liquid samples are sealed in mylar films and the bulk properties are being probed, due to the penetration depth of fluorescence is on the order of hundreds of nanometers. The calcium L-edge soft XAS was reported to study different types of solid calcium compounds, such as CaCl2·2H2O, CaF2, CaCO3, etc.,20 but with very limited reporting on using calcium L-edge soft XAS to study calcium solvation environment in solutions.
Synchrotron based XAS measures the X-ray absorption coefficient as a function of the incident X-ray photon energy in a range below and above the absorption edge of a particular element.21 As a highly element specific technique with sensitivity to the local chemical environment and structural order of the element of interest, it is an impressive tool in probing the oxidation state, bond length and coordination.22–25 As one of the two categories in XAS, studies that investigate the region from the absorption edge to tens of eV above the edge are designated as near edge X-ray absorption fine structure (NEXAFS). Detailed electronic information on the unoccupied states near the Fermi level, which is strongly affected by the solvation structure, can be derived from XAS.
In this article, both L-edge soft XAS and simulation methods including MD and density functional theory (DFT) calculations are used to scrutinize the calcium solvation in aqueous and organic solutions. The L-edge soft XAS is more sensitive to the local chemical environment of calcium compared to that from hard X-ray K-edge measurement since it probes the excitation of 2s or 2p electrons while the K-edge measures the 1s electrons. In contrast to our earlier work probing the bulk properties,19 the L-edge XAS measured using our specially designed in situ/operando cell enables us to apply electrochemical potentials while XAS intensities being collected, making in situ/operando observation of the electrode/electrolyte interface possible, which dictates the battery performance. It benefits from the surface sensitive nature of the total electron yield (TEY) mode in the soft X-ray L-edge XAS of calcium, which limits the probing depth within 1–2 nm. This manuscript is not only reporting the results of CaCl2 solvation but the method itself will be of significance in battery and catalysis areas. The L-edge soft XAS is unique, and will help reveal the solvation process at the electrode/electrolyte interface in nanoscale, aiding in the development of “beyond-lithium-ion” calcium batteries.
Experimental section
The calcium L3,2-edge XAS spectra were measured at Advanced Light Source (ALS) beamlines 7.3.1 and 8.0.1 in Lawrence Berkeley National Laboratory. The storage ring condition is 1.9 GeV and 500 mA current in a multi-bunch operation mode. The XAS spectra were collected in total electron yield (TEY) and total fluorescence yield (TFY) modes and calibrated using solid CaCl2. An in situ/operando flow liquid cell at beamline 8.0.1.4 (wetRIXS endstation) was used in the data collection. The TEY mode XAS limits the penetration depth to 1–2 nm from the electrode/electrolyte interface, thus it is not affected by the substantial interference from the bulk liquid. Combined with the flow liquid cell, it enables the probing of transient state species at the electrode/electrolyte interface under in situ/operando conditions.Molecular dynamics (MD) simulation was used to study the hydration of calcium ions in methanol and aqueous solutions. The force field parameters used in the simulation were derived by fitting the parameters of suitable analytical functions on the ab initio energy points obtained from Hartree–Fock calculations for CaCl2 in H2O26 and methanol.27 All non-Coulomb interactions involving ions are expressed through:
Vij(r) = Aij/rijnij + Bij![[thin space (1/6-em)]](https://www.rsc.org/images/entities/char_2009.gif) exp(−Cijrij) exp(−Cijrij) |
The radial distribution functions (RDF), gAB(r), which gives the probability of finding atom B at a distance r from atom A, was calculated using the expression:
DFT calculations were carried using ORCA packaging on the supercomputing cluster Lawrencium at Lawrence Berkeley National Laboratory. The initial guessed structures were based on the pre-optimized MD simulation results, using Ca2+ only surrounded by H2O to model very diluted case, and including Cl-in the solvation environment of Ca2+ to model relative concentrated case. B3LYP functional and TZVP basis set were used under PCM water, and the ROCIS calculations were applied to simulate the Ca L-edge spectra.
Results and discussion
Fig. 1(a) compares the XAS from 0.5 M, 1 M, 1.5 M, and 3 M CaCl2·2H2O aqueous solutions from TEY mode. It is shown that the calcium L3,2-edge XAS spectrum is composed of two main spin–orbit related peaks (a2 and b2) corresponding to L3 and L2-edge, while two smaller peaks (a1 and b1) precede the L3 and L2-edge main peaks.20,32 The two main peaks are the 3d electrons in t2g symmetry:33 a2 and b2 are associated with the 2p3/2−1t2g and the 2p1/2−1t2g states, respectively. The smaller peaks are 3d electrons in eg symmetry: a1 and b1 are associated with 2p3/2−1eg and 2p1/2−1eg states, respectively. The origin of the multipeak pattern is crystal field splitting, resulting from the magnitude and symmetry of the crystal field of calcium in the first coordination sphere.34 It is also revealed that the intensity of the peaks is inversely correlated with the CaCl2·2H2O concentration. In contrast, for 0.5 M and 1 M CaCl2·2H2O in methanol, the overall spectra are similar, indicating that an increased ratio of the Ca2+ cations to methanol molecules does not affect the Ca2+ cation chemical coordination.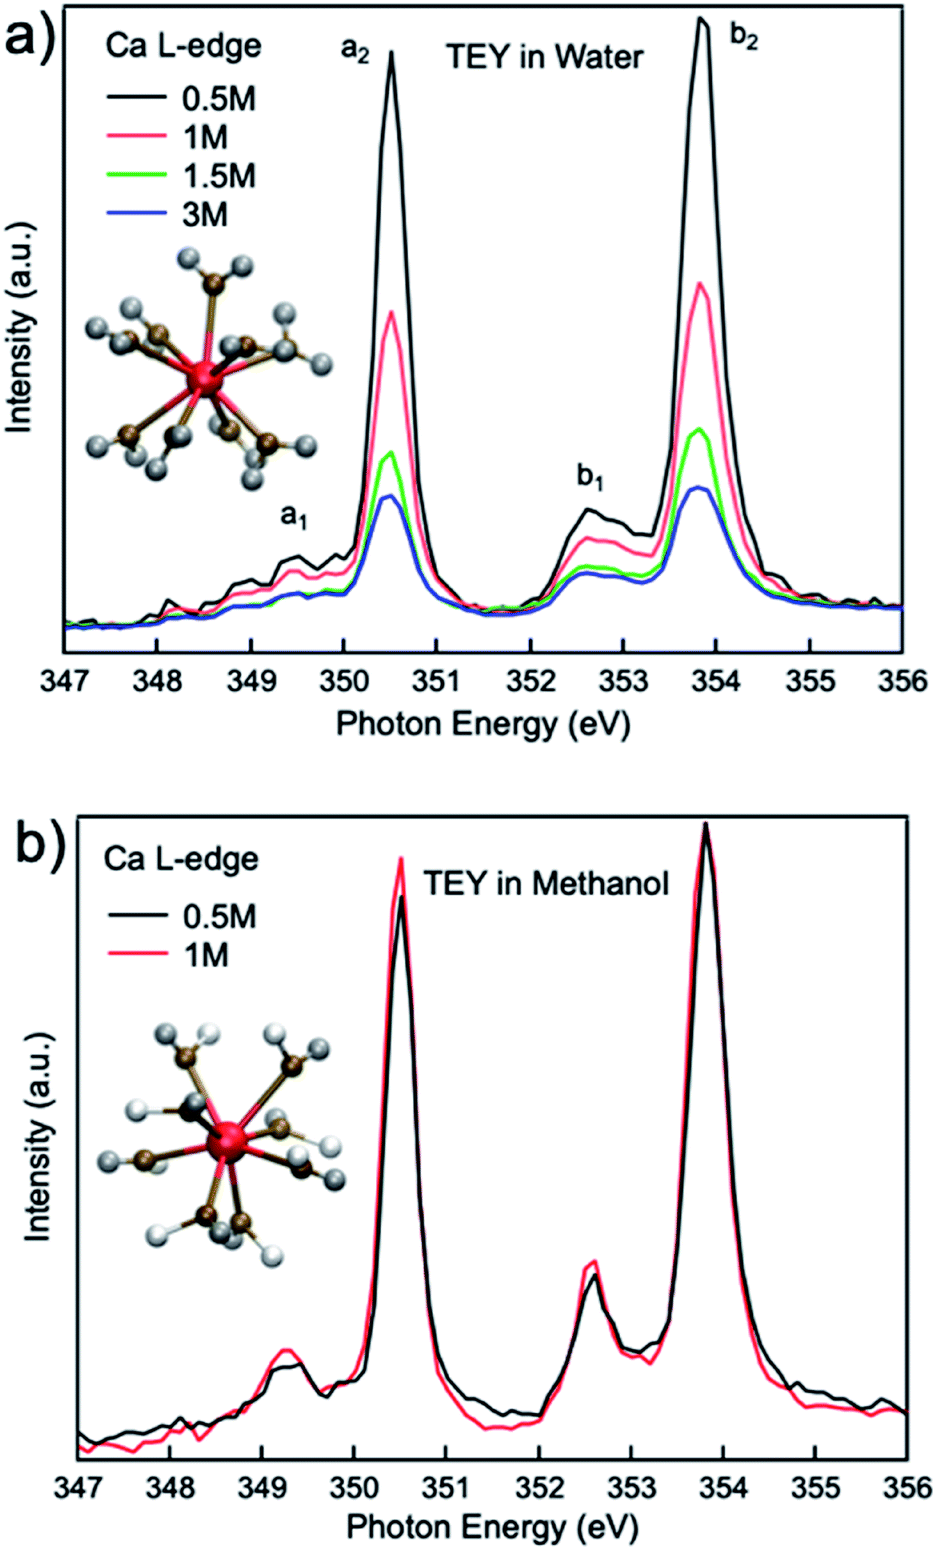 | ||
| Fig. 1 Calcium L3,2-edge TEY mode XAS spectra for (a) 0.5 M, 1.0 M, 1.5 M, and 3 M CaCl2·2H2O aqueous solutions; (b) 0.5 M, and 1 M CaCl2·2H2O methanol solutions. | ||
The results of the molecular dynamics (MD) simulations indicate that the average distance between Ca2+ and oxygen atoms in its first solvation shell is 2.32 ± 0.01 Å in aqueous solutions and 2.44 ± 0.02 Å in methanol solutions (see Fig. 2(g)). It was also observed that in the second solvation shell (Fig. S1–S3†), all the oxygen atoms in the methanol solutions are, on average, found at the same distance of 4.74 ± 0.02 Å from the Ca2+ while the oxygen atoms in aqueous solutions are either at 4.25 ± 0.01 Å or 4.97 ± 0.02 Å from the Ca2+. For the 0.5 M methanol solution, 0.5 M and 1 M aqueous solutions, no Cl− is observed within 5 Å from the Ca2+, while for the 1 M methanol solution, 1.5 M and 3 M aqueous solutions, Cl− anions are observed at distances less than 5 Å from Ca2+ and unevenly distributed as a function of distance (see Fig. 2(f)). In the diluted (0.5 M) CaCl2·2H2O methanol solution, Ca2+ cations are separated from each other with a distance beyond the average distance from Ca2+ cation to the oxygen atoms in its first solvation shell. However, even in 0.5 M CaCl2·2H2O dilute aqueous solution, dimers and ionic clusters form by sharing the H2O molecules in their first solvation shell. Such dimers and ionic clusters are also observed in the more concentrated CaCl2·2H2O aqueous solutions (1.0 M, 1.5 M, and 3 M). In aqueous solutions, with an increase of Ca2+ cation concentration, the solvent coordination number is the same while the nearby Ca2+ cation and Cl− anion influence is increasing, as shown in Fig. 2(a–d). For 3 M aqueous solution in Fig. 2(d), one Cl− anion appears in the first solvation shell, replacing one H2O molecule. For methanol solutions of different concentrations, the solvation structures are similar, an example is shown in Fig. 1(b). The equilibrium number of solvent molecules surrounding the Ca2+ cation, are 8 and 9 in its first solvation shell in methanol and aqueous solutions, respectively. Such Ca complexes with coordination numbers of 8 or 9 have not been reported in the crystallographic database. The MD simulation also found that in aqueous solutions, each H2O molecule in the first solvation shell exhibits three neighbouring H2O in the second shell, connected by hydrogen-bond and forming tetrahedral networks. The higher the CaCl2·2H2O concentration, the smaller the hydrogen-bond network scale with respect to each Ca2+. Since such influence is beyond the first solvation shell, the XAS spectrum intensity is sensitive to the CaCl2·2H2O concentration. The density distribution of oxygen atoms in Fig. 2(g) shows tiny variations because the relative value of change with respect to the total value is too small thus hard to be observed. The reason is that there are many oxygen atoms in the aqueous solution while those affected by the hydrogen bond constituent only a fraction of the oxygen atoms in H2O molecules. In contrast, the total number of chloride ions is small, thus those affected by the hydrogen bonding are easy to be observed, as it is shown in Fig. 2(f). In contrast, in the methanol solution each CH3OH molecule in the first solvation shell exhibits only one neighbouring CH3OH molecule in the second shell, with weaker interaction because of weaker polarity and steric hinderance. As a result, the XAS spectra are comparable from CaCl2·2H2O methanol solution of different concentrations.
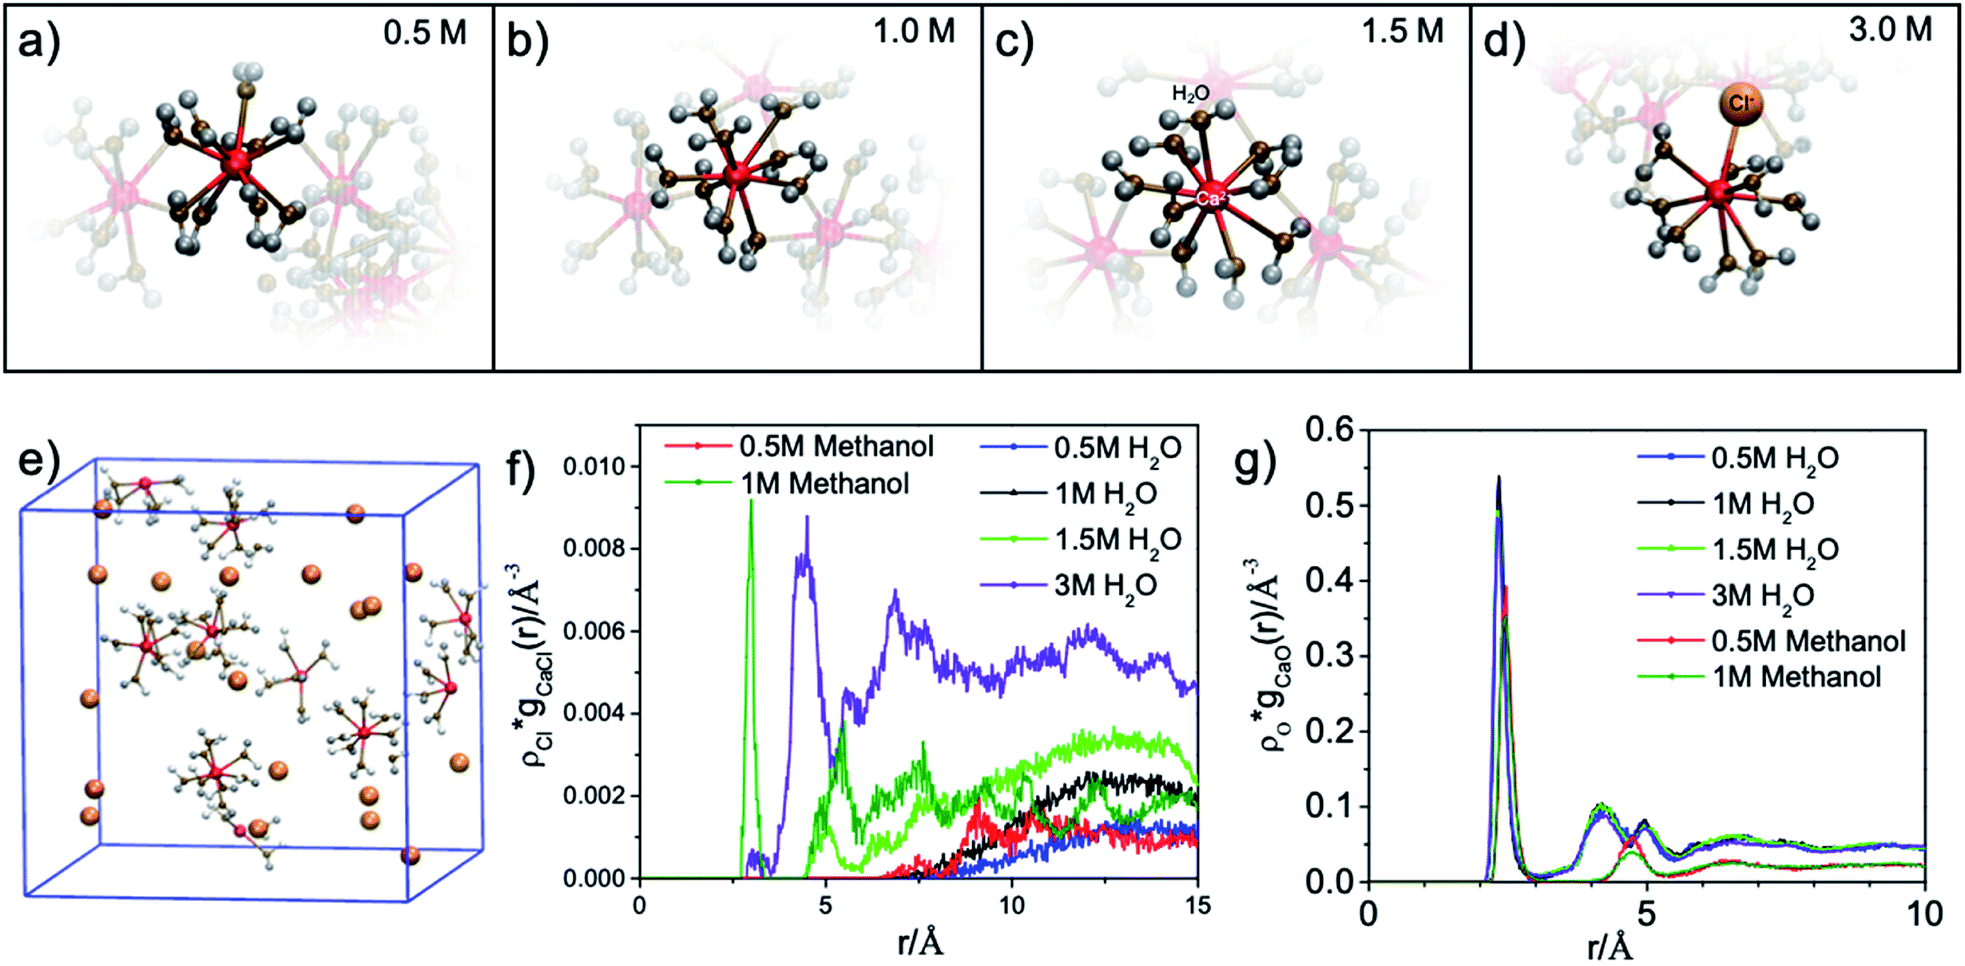 | ||
| Fig. 2 Rendered single Ca2+ and its first solvation shell from MD simulations for (a) 0.5 M, (b) 1.0 M, (c) 1.5 M and (d) 3.0 M aqueous solutions. (e) Molecular dynamics (MD) simulations for the first solvation shell around Ca2+ in 0.5 M CaCl2·2H2O methanol solution. (f and g) Absolute density distribution of chloride ion (Cl−) and oxygen atom (O) as a function of the distance from Ca2+, respectively. | ||
Comparisons are also made between 1 M Ca2+ in H2O, methanol and ethanol solutions collected using TFY mode. The two main peaks (∼349 and 353 eV) have identical features in terms of intensity and full width half maximum (FWHM), while the two smaller peaks (a1 and b1) precede the L3 and L2-edge main peaks differ from each other. The intensity for both pre-edge peaks become larger and the FWHM become smaller following the sequence of H2O, methanol, and ethanol solution, as it is shown in Fig. 3. It indicates that for solvent with weaker polarity and larger steric hinderance, the intensity of the pre L3,2-edge peak will become larger and the FWHM of this pre-edge peak will become smaller, due to a decrease in the number of oxygen atoms surrounding the Ca2+ cations and its corresponding influence on the 3d electrons in eg symmetry.
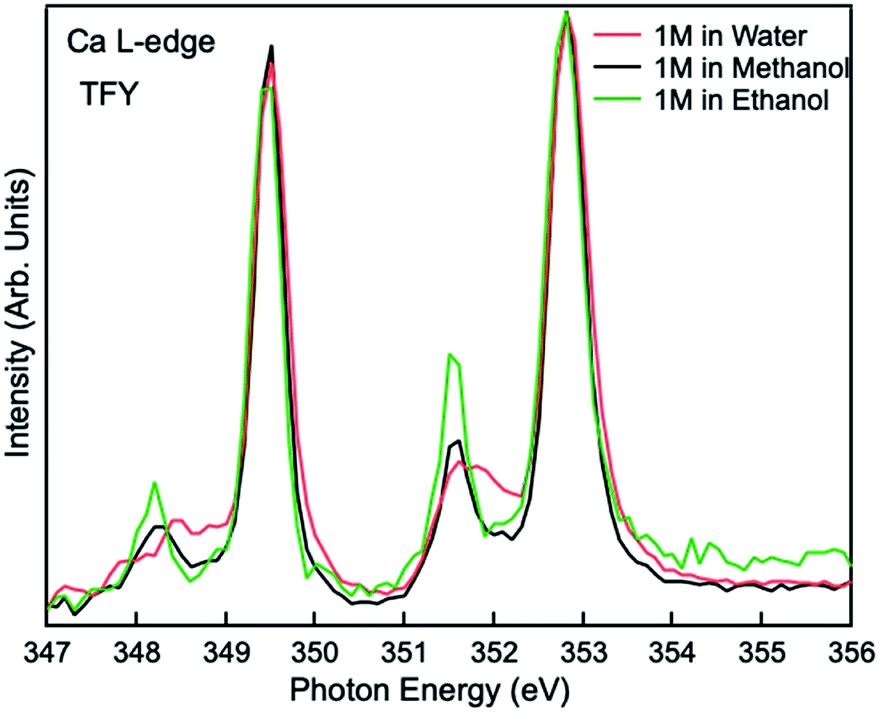 | ||
| Fig. 3 Calcium L3,2-edge TFY mode XAS spectra for 1 M CaCl2·2H2O in H2O, methanol, and ethanol. | ||
The influence of solute concentration on the calcium L3,2-edge spectrum was also confirmed by DFT calculations. Using initial guessed structures based on the pre-optimized MD simulation results, three cases were compared as shown in Fig. 4. The Ca2+ only surrounded by H2O in Fig. 4(b) represents very diluted case, and cases in Fig. 4(c and d) including Cl− in the solvation environment of Ca2+ to model relative concentrated case. Fig. 4(b–d) represent Ca2+ aqueous solutions of increasing concentrations. The L3,2-edge spectra calculated from Fig. 4(b–d) are shown in Fig. 4(a). They are consistent with the experimental data shown in Fig. 1(a) that with a higher Ca2+ concentration, the intensity of the Ca2+ L3,2-edge spectrum will become lower.
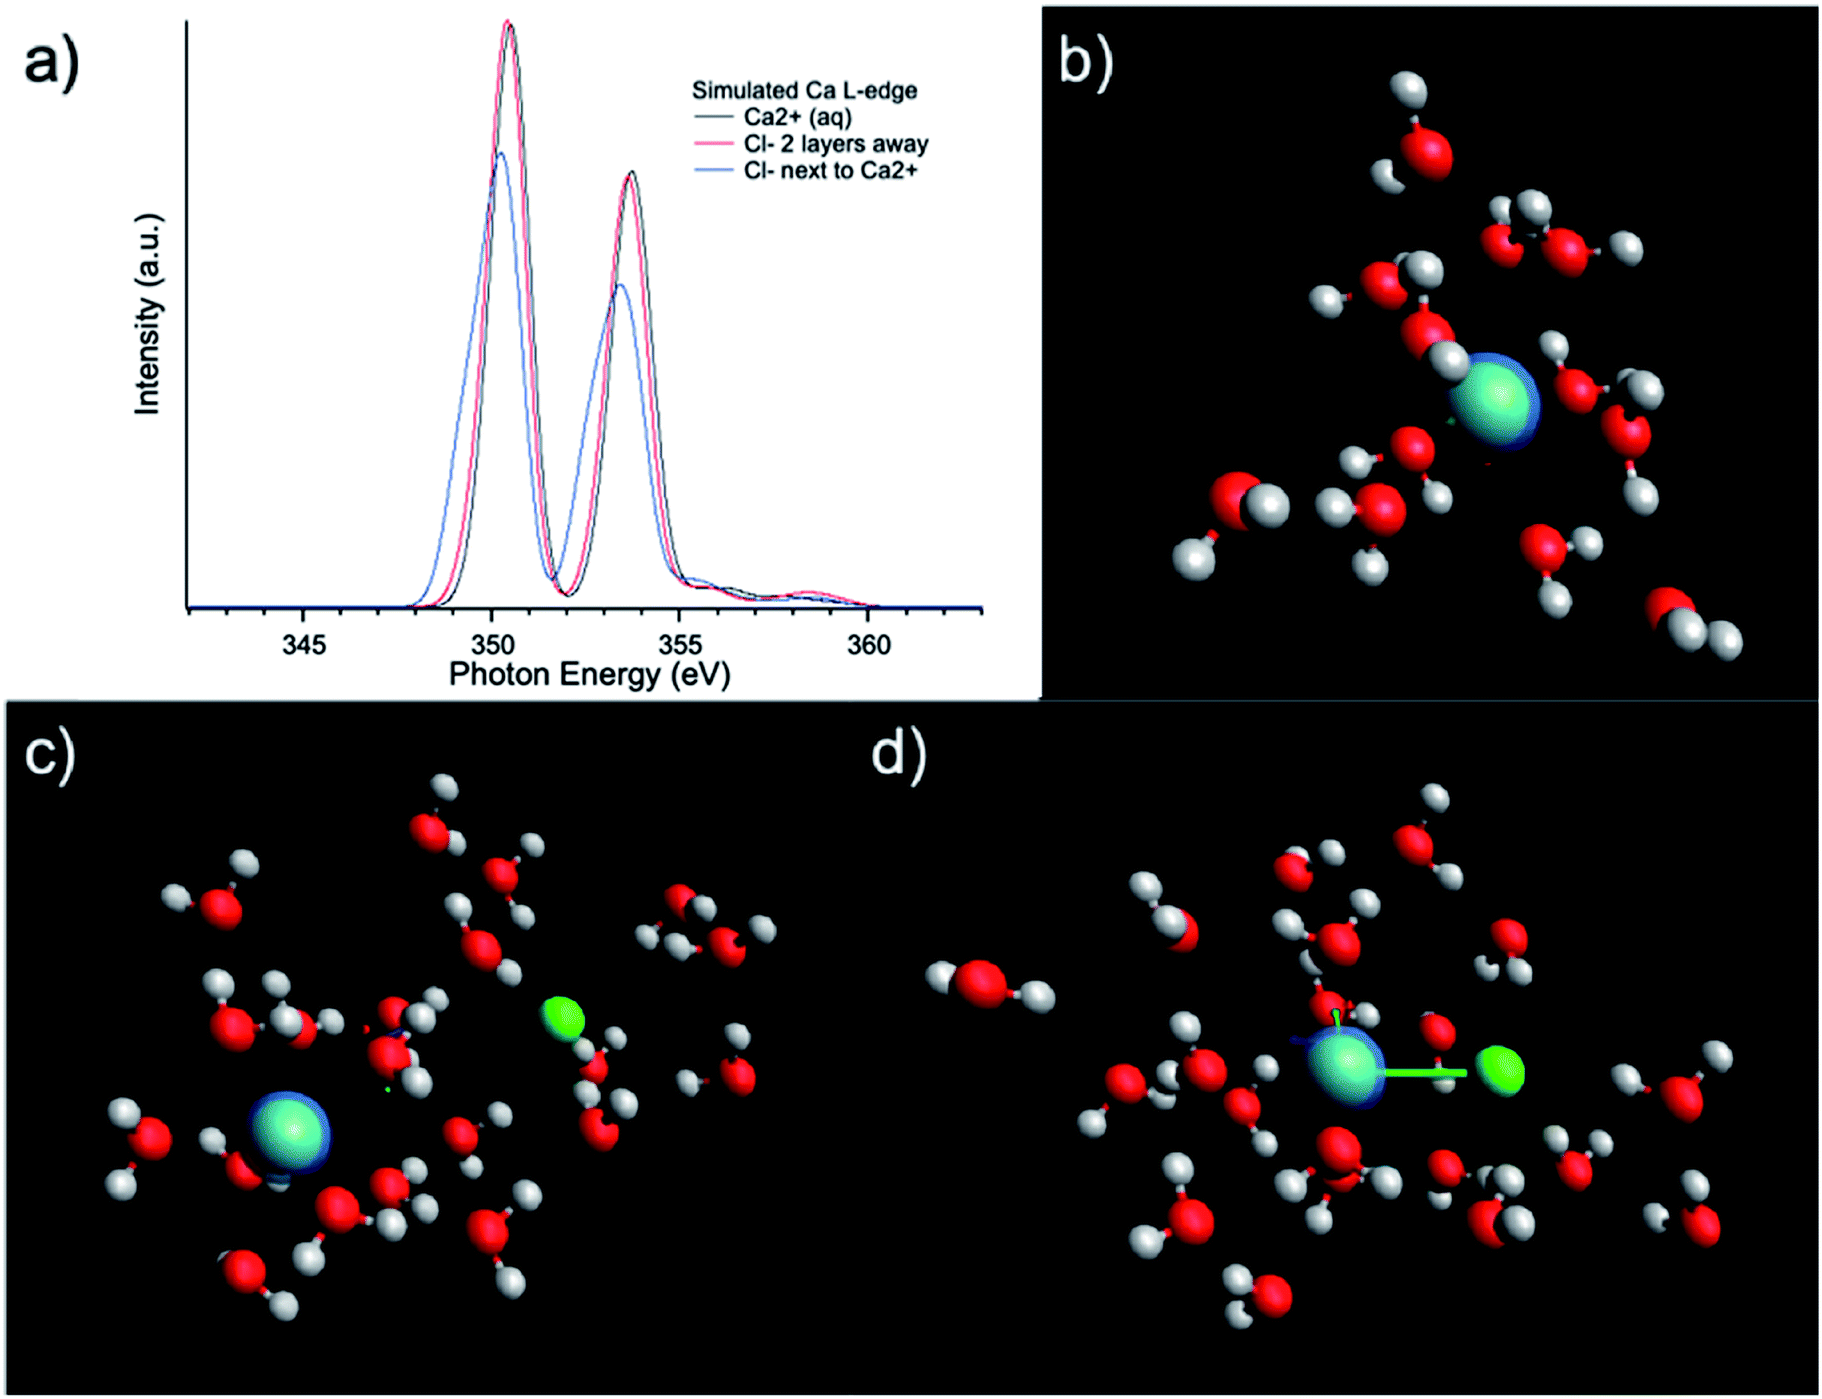 | ||
| Fig. 4 (a) L3,2-edge spectra calculated using ROCIS calculations based on models of (b) Ca2+ + 12H2O representing dilute solution; (c) Ca2+ + Cl− + 20H2O with two molecular layer separation between Cl− and Ca2+; (d) Ca2+ + Cl− + 20H2O with Cl− in the first solvation shell of Ca2+ representing a high concentration solution. | ||
The effect of electrochemical potential applied was evaluated using an in situ/operando flow cell at beamline 8.0.1.4 (wetRIXS endstation), a schematic of the drawing is in Fig. 5(a). Potentials ranging from −0.6 V to +0.4 V were applied on the working electrode while TEY was being collected. For a CaCl2·2H2O aqueous solution with no potential or negative potentials applied, the spectra are similar in the a1, b1 small peaks preceding the L3,2-edge. Interestingly, at the L3,2-edges, when no potential is applied the spin–orbit related a2, b2 peaks exhibit the lowest intensity, while when negative potentials are applied, a2, b2 peak intensities are always larger, and the smaller the absolute potential is applied, the larger the intensity. This change in intensity originates from the electrostatic interactions between the working electrode and the Ca2+ cations in aqueous solutions. As the potential becomes more negative, the concentration of Ca2+ and Cl− near the working electrode will be higher and lower, respectively. When comparing the CaCl2·2H2O aqueous solution applied with a potential of −0.6 V to that applied with a potential of −0.2 V, the former one is more concentrated with respect to Ca2+ ions. Thus, the a2, b2 peak intensities of the former are lower than the latter. However, when no potential is applied, the Cl− ion concentration is higher compared to any of the aqueous solutions applied with a negative potential. The presence of Cl− ions at this interface results in a reduction in the number of solvent molecules in the first solvation shell surrounding the Ca2+ cations, similar to the concentrated (3 M) bulk solution, thus the a2, b2 peak intensities are lower than any of the aqueous solutions applied with a negative potential.
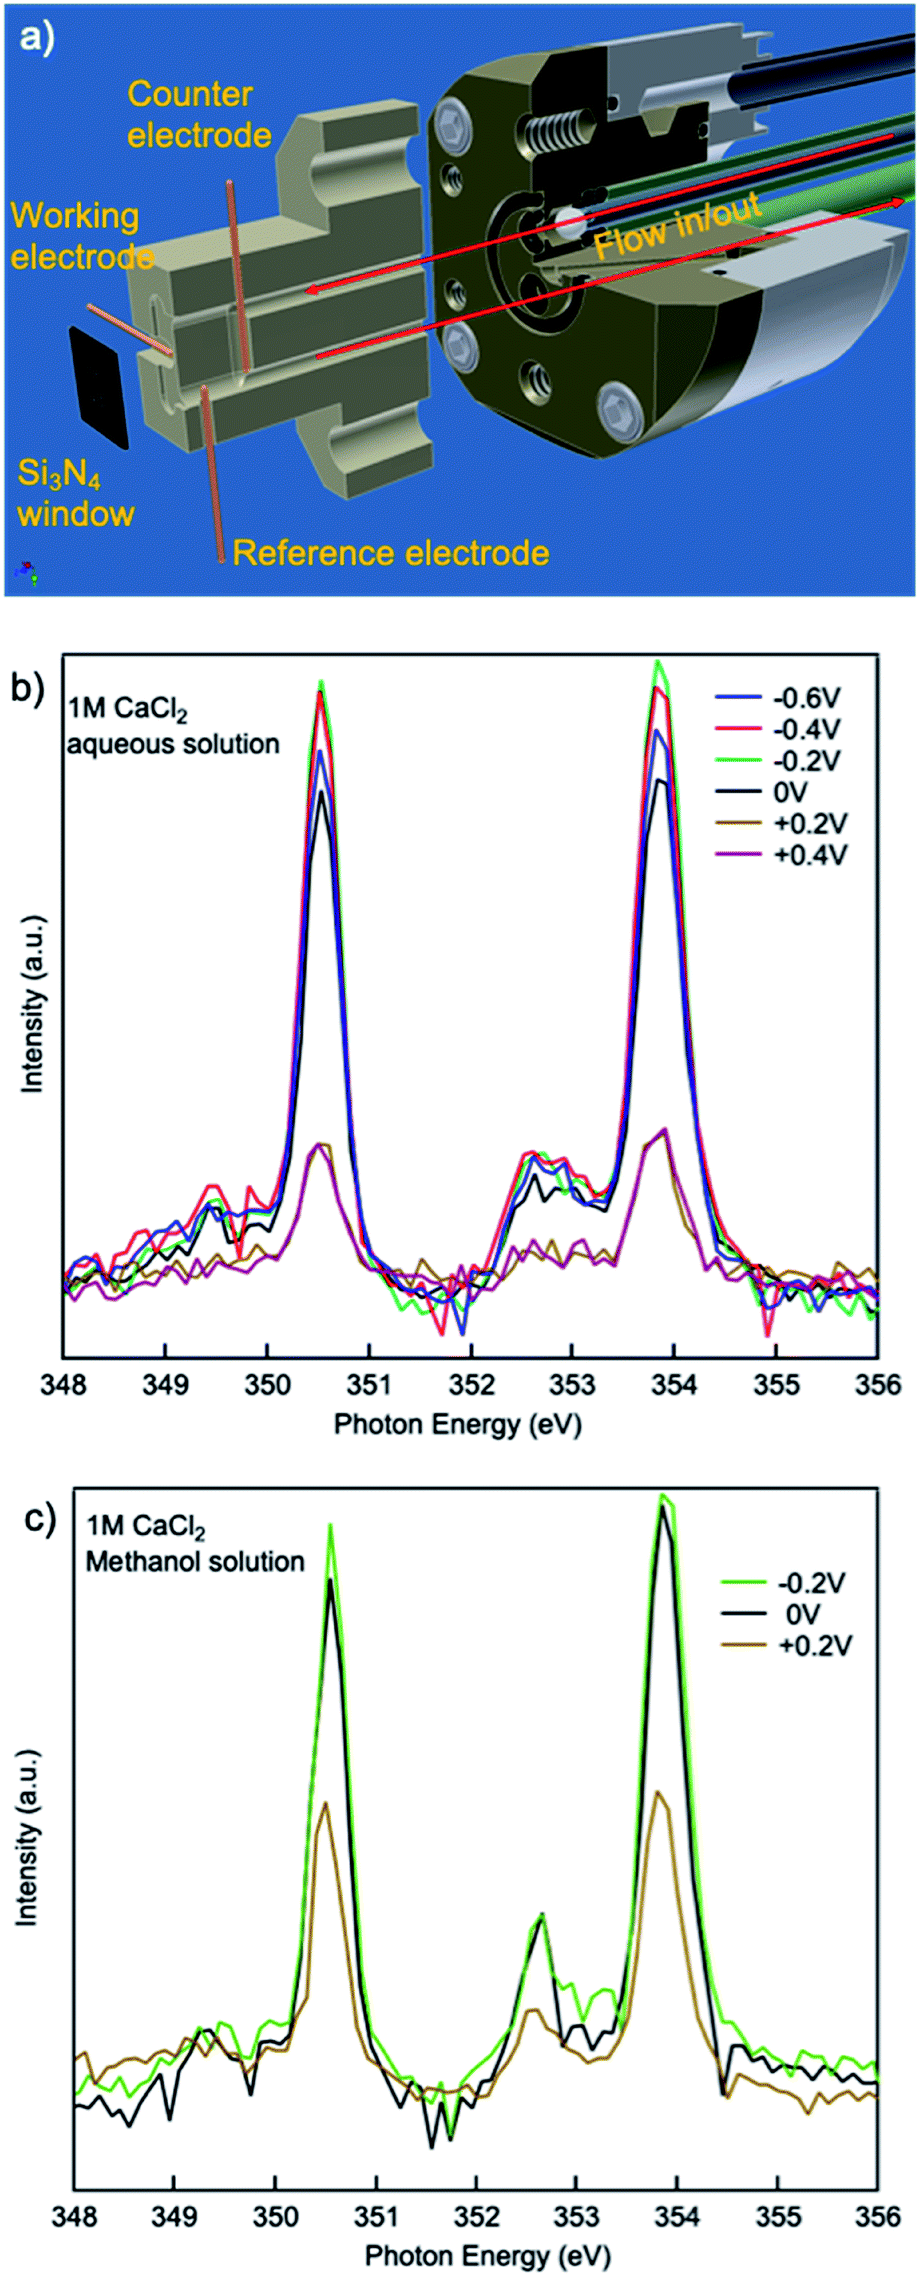 | ||
| Fig. 5 (a) Schematic of in situ/operando flow cell at beamline 8.0.1.4. XAS spectra from 1 M CaCl2·2H2O (b) aqueous and (c) methanol solutions with different potentials applied on the working electrode. | ||
When positive potentials are applied, the overall spectra intensities become lower because of a significant reduction in the number of Ca2+ ions in the probing depth resulting from the electrostatic repulsions. Such electrostatic effect is stronger in aqueous solutions compared to that in methanol solutions. As it is shown in Fig. 5(b and c), when +0.2 V is applied, the overall peak intensity reduces to ∼1/4 of the peak intensity in the aqueous solution with no potential applied while the peak intensity decreases to ∼1/2 of the peak intensity in the methanol solution with no potential applied. This difference originates from the difference in the polarity and steric hinderance of the solvent molecules.
Conclusions
In summary, a systematic study of the calcium solvation shell structure has been probed using L3,2-edge XAS, MD and DFT simulations. For CaCl2·2H2O aqueous solution, the intensity of the peaks is inversely correlated with the Ca2+ concentration because of the tetrahedral hydrogen-bonded network. In contrast, for that in methanol, the intensity remains similar while the concentration varies because only the first solvation shell is significant due to the weaker polarity and steric hinderance of CH3OH molecules compared to those of H2O. The effect of different potentials is also compared. The a2, b2 peak intensities are inversely correlated with the absolute value of the negative potentials applied on the working electrode while pre-edge a1, b1 peak intensities are similar. The effect of solvent is obvious when comparing 0 V and +0.2 V potentials applied for CaCl2·2H2O aqueous and methanol solutions. Such an understanding of calcium solvation at the atomic level will help depict its variation as a function of distance and electric field, contributing to the design of the next generation “beyond-lithium-ion” battery.More importantly, this work involving the TEY mode L-edge soft XAS measured using the flow liquid cell enables to study the electrode/electrolyte interface while an electrochemical bias is applied. Although the coordination number obtained is similar to our previous study on the bulk of CaCl2 solution, in our other studies on Mg2+ and Zn2+ based electrolyte, we noticed that the interface and bulk can be different when an electrochemical bias is applied. Those results will be published in a separate study after a systematic investigation. Thus, it is of importance to characterize both the interface and the bulk properties to build an accurate and precise model of the liquid system, especially for battery and catalyst systems in which the reaction happens mainly at the interface. The use of the flow liquid cell allows electrochemical potentials to be applied, which shows implications in probing transient state species at the interface which can only be observed under in situ/operando conditions. The use of soft X-ray XAS to probe solvation structure of certain electrolytes can be applied in various different liquids. Here we chose CaCl2 in water and methanol as the model systems to investigate the difference between aqueous and non-aqueous solutions. The results indicate that the interface between liquid electrolyte and solid electrode can be different when electrochemical bias is applied. This is important for understanding the different behaviour of ions in aqueous/non-aqueous electrolytes for battery research.
As mentioned above, this setup using the flow liquid cell enables the in situ/operando probing in which the transient states might be observed. The TEY surface-sensitive signature makes it one of the very limited techniques that enable probing of such interfaces in future battery studies.
Conflicts of interest
There are no conflicts to declare.Acknowledgements
This work was supported by the Joint Center for Energy Storage Research, an Energy Innovation Hub funded by the U.S. Department of Energy. This research used resources of the Advanced Light Source, a DOE Office of Science User facility under contract no. DE-AC02-05CH11231. K. Q. and M. T. acknowledge support from NSF (CHE-1665284). This research used resources of the National Energy Research Scientific Computing Center, a DOE Office of Science User Facility supported by the Office of Science of the U.S. Department of Energy under contract no. DE-AC02-05CH11231.References
- Z. Li, O. Fuhr, M. Fichtner and Z. Zhao-Karger, Energy Environ. Sci., 2019, 12, 3496–3501 RSC.
- L. Addadi, S. Raz and S. Weiner, Adv. Mater., 2003, 15, 959–970 CrossRef CAS.
- J. L. Fulton, S. M. Heald, Y. S. Badyal and J. M. Simonson, J. Phys. Chem. A, 2003, 107, 4688–4696 CrossRef CAS.
- Y. Ma, B. Aichmayer, O. Paris, P. Fratzl, A. Meibom, R. A. Metzler, Y. Politi, L. Addadi, P. U. P. A. Gilbert and S. Weiner, Proc. Natl. Acad. Sci. U. S. A., 2009, 106, 6048–6053 CrossRef CAS PubMed.
- Y. Politi, R. A. Metzler, M. Abrecht, B. Gilbert, F. H. Wilt, I. Sagi, L. Addadi, S. Weiner, P. U. P. A. Gilbert and P. Gilbert, Proc. Natl. Acad. Sci. U. S. A., 2008, 105, 17362–17366 CrossRef CAS PubMed.
- T. Mass, A. J. Giuffre, C.-Y. Sun, C. A. Stifler, M. J. Frazier, M. Neder, N. Tamura, C. V. Stan, M. A. Marcus and P. U. P. A. Gilbert, Proc. Natl. Acad. Sci. U. S. A., 2017, 114, E7670–E7678 CrossRef CAS PubMed.
- A. V Radha, T. Z. Forbes, C. E. Killian, P. U. P. A. Gilbert and A. Navrotsky, Proc. Natl. Acad. Sci. U. S. A., 2010, 107, 16438–16443 CrossRef PubMed.
- P. U. P. A. Gilbert, A. Young and S. N. Coppersmith, Proc. Natl. Acad. Sci. U. S. A., 2011, 108, 11350–11355 CrossRef CAS PubMed.
- Y. U. T. Gong, C. E. Killian, I. C. Olson, N. P. Appathurai, A. L. Amasino, M. C. Martin, L. J. Holt, F. H. Wilt and P. U. P. A. Gilbert, Proc. Natl. Acad. Sci. U. S. A., 2012, 109, 6088–6093 CrossRef CAS PubMed.
- M. L. Granados, M. D. Z. Poves, D. M. Alonso, R. Mariscal, F. C. Galisteo, R. Moreno-Tost, J. Santamaría and J. L. G. Fierro, Appl. Catal., B, 2007, 73, 317–326 CrossRef CAS.
- R. J. Gummow, G. Vamvounis, M. B. Kannan and Y. He, Adv. Mater., 2018, 30, 1801702 CrossRef PubMed.
- J. Muldoon, C. B. Bucur and T. Gregory, Chem. Rev., 2014, 114, 11683–11720 CrossRef CAS PubMed.
- D. Wang, X. Gao, Y. Chen, L. Jin, C. Kuss and P. G. Bruce, Nat. Mater., 2018, 17, 16–20 CrossRef CAS.
- D. S. Tchitchekova, A. Ponrouch, R. Verrelli, T. Broux, C. Frontera, A. Sorrentino, F. Bardé, N. Biskup, M. E. Arroyo-de Dompablo and M. R. Palacín, Chem. Mater., 2018, 30, 847–856 CrossRef CAS.
- M. M. Probst, T. Radnai, K. Heinzinger, P. Bopp and B. M. Rode, J. Phys. Chem., 1985, 89, 753–759 CrossRef CAS.
- J. L. Fulton, S. M. Heald, Y. S. Badyal and J. M. Simonson, J. Phys. Chem. A, 2003, 107, 4688–4696 CrossRef CAS.
- M. Kohagen, P. E. Mason and P. Jungwirth, J. Phys. Chem. B, 2014, 118, 7902–7909 CrossRef CAS PubMed.
- T. Martinek, E. Duboué-Dijon, Š. Timr, P. E. Mason, K. Baxová, H. E. Fischer, B. Schmidt, E. Pluhařová and P. Jungwirth, J. Chem. Phys., 2018, 148, 222813 CrossRef PubMed.
- G. Ren, Y. Ha, Y.-S. Liu, X. Feng, N. Zhang, P. Yu, L. Zhang, W. Yang, J. Feng, J. Guo and X. Liu, J. Phys. Chem. B, 2020, 124, 3408–3417 CrossRef CAS PubMed.
- S. J. Naftel, T. K. Sham, Y. M. Yiu and B. W. Yates, J. Synchrotron Radiat., 2001, 8, 255–257 CrossRef CAS PubMed.
- M. Giorgetti, ISRN Mater. Sci., 2013, 938625 Search PubMed.
- J. W. Smith and R. J. Saykally, Chem. Rev., 2017, 117, 13909–13934 CrossRef CAS PubMed.
- J. Yano and V. K. Yachandra, Photosynth. Res., 2009, 102, 241–254 CrossRef CAS PubMed.
- C. H. M. van Oversteeg, H. Q. Doan, F. M. F. de Groot and T. Cuk, Chem. Soc. Rev., 2017, 46, 102–125 RSC.
- R. Ortega, A. Carmona, I. Llorens and P. L. Solari, J. Anal. At. Spectrom., 2012, 27, 2054 RSC.
- M. M. Probst, T. Radnai, K. Heinzinger, P. Bopp and B. M. Rode, J. Phys. Chem., 1985, 89, 753–759 CrossRef CAS.
- E. Owczarek and E. Hawlicka, J. Phys. Chem. B, 2006, 110, 22712–22718 CrossRef CAS PubMed.
- W. L. Jorgensen, J. D. Madura and C. J. Swenson, J. Am. Chem. Soc., 1984, 106, 6638–6646 CrossRef CAS.
- W. L. Jorgensen, J. Phys. Chem., 1986, 90, 1276–1284 CrossRef CAS.
- P. G. Kusalik and I. M. Svishchev, Science, 1994, 265, 1219–1221 CrossRef CAS PubMed.
- V. Migliorati, G. Chillemi and P. Dangelo, Inorg. Chem., 2011, 50, 8509–8515 CrossRef CAS PubMed.
- Q. Li, Y. Ge, G. Geng, S. Bae and P. J. M. Monteiro, J. Nanomater., 2015, 2015, 1–10 Search PubMed.
- J. E. Rubensson, S. Eisebitt, M. Nicodemus, T. Böske and W. Eberhardt, Phys. Rev. B: Condens. Matter Mater. Phys., 1994, 50, 9035–9045 CrossRef CAS PubMed.
- S. Bae, R. Taylor, D. Hernández-Cruz, S. Yoon, D. Kilcoyne and P. J. Monteiro, J. Am. Ceram. Soc., 2015, 98, 2914–2920 CrossRef CAS.
Footnote |
| † Electronic supplementary information (ESI) available. See DOI: 10.1039/d0ra05905f |
| This journal is © The Royal Society of Chemistry 2020 |