DOI:
10.1039/D0RA05844K
(Paper)
RSC Adv., 2020,
10, 32999-33009
Characterizing the interaction between methyl ferulate and human serum albumin by saturation transfer difference NMR†
Received
4th July 2020
, Accepted 28th August 2020
First published on 7th September 2020
Abstract
Methyl ferulate (MF) is an alkyl ferulate ester that widely exists in edible plants and has application value in the food and medicine industries. Thus, its effect on biological macromolecules should be considered. In this study, we exploit saturation transfer difference NMR (STD-NMR) to characterize the interaction of all protons of MF with human serum albumin (HSA) at the molecular level. STD-NMR and Ka (1.298 × 10³ M−1) revealed that protons H1–6 and H8 bound to HSA with a medium affinity. Binding epitope mapping further showed that the aromatic ring played a key role in the HSA–MF interaction. STD-NMR site-marker-displacement experiments and circular dichroism spectroscopy revealed that MF prefered to bind to site II of HSA without changing the basic skeleton of HSA. Computer simulations confirmed these experimental results. Overall, this work elucidates the molecular level interaction of MF with HSA and provides new insights into the possibility of the potential applications of MF in the food and medicine industries.
Introduction
Methyl ferulate (MF, Fig. 1) is an alkyl ferulate ester widely found in edible plants, and is an effective antioxidant and antibacterial component in plants and plant-derived foods, such as the antioxidant in rice bran and the stem of sorghum, and the antimicrobial component in the leaves of Morinda citrifolia L. (a Rubiaceae plant used for food and medicine).1–3 Qiu and Sørensen et al.4,5 have proved that MF can efficiently prevent lipid oxidation and inhibit the formation of primary and secondary oxidation products in fish oil-enriched milk. The main antioxidant mechanism of MF is to trap and stabilize the lipid peroxyl radical produced by the radical chain oxidation of food ingredients.6 And MF has antimicrobial activity against Escherichia coli, Bacillus cereus, Listeria monocytogenes, Fusarium culmorum and Saccharomyces cerevisiae.7 MF has also been shown to have anti-inflammatory activity8 and be non-toxic in terms of in vitro toxicity and cytotoxicity.9 Therefore, it has application value in the food and medicine industries. For the determination of the application of MF to be new food additives and new drug, in addition to toxicity, its physiological safety of MF entering the human circulation, such as interactions with biological macromolecule, should be concerned. However, that has not been reported. Human serum albumin (HSA) is the most abundant protein in the human circulation, and it is also a transporter protein for many endogenous and exogenous substances, which will determine the distribution, metabolism and biological activity of small molecules that bind to it. Moreover, interactions with low-molecular-weight molecules also cause conformational changes in HSA, which may affect the secondary and tertiary structures of HSA.10 In conclusion, the interaction between MF and HSA should be studied to understand the physiological safety characteristics of MF and its influence on the conformation of HSA, so as to provide some theoretical basis for the application of MF in food and medicine industries.
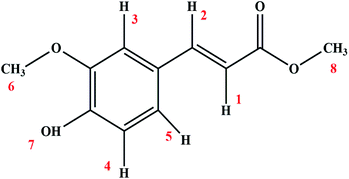 |
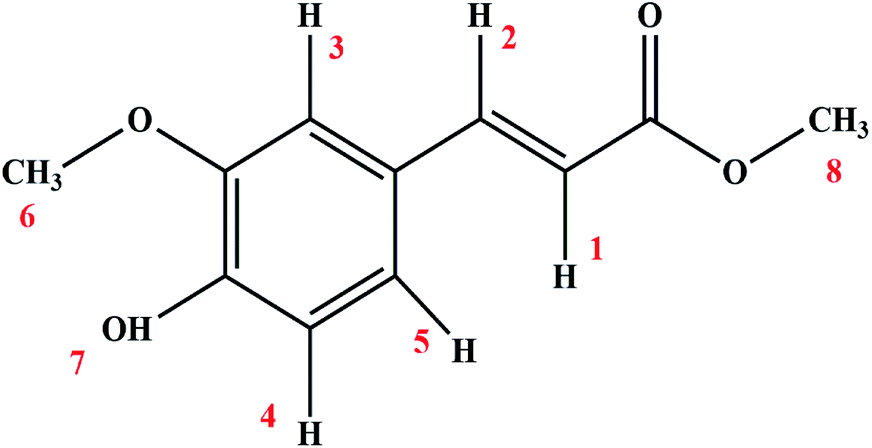
| | Fig. 1 Chemical structure of MF. | |
Nuclear magnetic resonance (NMR) is an important screening tool for studying biological macromolecule–ligand interactions because it can obtain additional structural information compared with the common quantitative research methods, such as UV-vis, fluorescence, circular dichroism (CD) and Fourier transform infrared spectroscopies. Among various NMR techniques, saturation transfer difference NMR (STD-NMR) has become the most versatile method due to its many advantages including information diversity, ease of implementation, lower sensitivity to false positives than other screening techniques, reduced protein consumption, and no upper limit on protein size.11 There are several attractive features of STD-NMR technique that deserve attention, which are not available in standard 1H NMR. First, STD-NMR can only observe the signal from the ligand-bound state, so there is no need to correct the free state contribution, which is particularly beneficial for experimental designs with high ligand-receptor ratios, otherwise it might complicate the interpretation.12 Second, a ligand epitope mapping can be constructed by analyzing the relative intensities of the STD-NMR signal of each proton within the same compound, which provides information about the relative position of ligand within the binding site. That is more powerful when STD-NMR experimental data and molecular docking prediction models are combined to verify the reliability of the results.13 Third, STD-NMR can be used to calculate the dissociation constant (Kd) for interactions in the millimolar to micromolar range. Therefore, the STD-NMR method has been successfully applied to the interactions between HSA and ligands. For example, Tanoli et al.14 used STD-NMR technique to screen out the compounds that bind HSA in the extract of stryphnodendron polyphyllum and explored their binding potential toward HSA. Dias et al.15 used docking simulation combined with constraints derived from STD-NMR results to obtain a three-dimensional model consistent with NMR data, providing useful information on HSA–vanadium compounds interaction modes. It can be seen that STD-NMR has become a powerful tool for HSA-ligands interaction.
Therefore, considering the advantages of the technology and the characteristics of the interaction system, we chose STD-NMR technique to explore the interaction between all protons of MF and HSA at the molecule level to reveal the safety of MF to be a food additive or drug, which would be of great interest to researchers developing new food additives and new drugs. STD-NMR data was applied to construct a binding epitope mapping to analyze the affinity relationship between protons of MF and HSA and to obtain the Kd of HSA–MF interaction. The binding sites of MF on HSA were shown in STD-NMR site-marker-displacement experiments. The effect of MF on the conformation of HSA was investigated by CD. Finally, the auxiliary method of computer simulation provided further evidence for the experimental results. This study will help to further understand the physiological effect of MF to biological macromolecules, and provide references for its application in the food and medicine industries. It will also enrich the research of supramolecular system of natural products and functional biological macromolecules, and promotes the development of new natural food additives and new drug with fewer side-effects to human health.
Experimental
Reagents
HSA was purchased from Sigma-Aldrich (Milwaukee, USA). MF (98% purity) was obtained from Heowns Biochemical Technology Co., Ltd. (Tianjin, China). Ethanol was purchased from Chengdu Chron Chemicals Co., Ltd. (Chengdu, China). Warfarin sodium (98% purity), ibuprofen (98% purity), lidocaine (99% purity), DMSO-d6, and D2O were acquired from J&K Scientific, Ltd. (Beijing, China). All reagents were of analytical grade and were used without further purification.
Steady-state fluorescence spectroscopy
Steady-state fluorescence spectra were recorded on a Cary Eclipse spectrophotometer (Varian, USA) equipped with 1.0 cm quartz cells. The HSA stock solution was prepared in phosphate buffer saline (PBS; pH 7.4, containing 0.1 M NaCl), and the MF was dissolved in ethanol. The sample solutions used for the measurement were diluted with PBS to a constant volume containing 2 × 10⁻⁶ M HSA and different MF concentrations (0, 2, 10, 20, 40, 60, 80, 100 × 10−6 M) and were placed in a 310 K water bath. Steady-state fluorescence spectra in the wavelength range of 290–500 nm were measured after half an hour of incubation. The slit widths of fluorescence excitation and emission were set as 5 and 10 nm, respectively, and the excitation wavelength (λex) was 280 nm.
To exclude the fluorescence quenching caused by inner-filter effect, we used the following formula for correction:16,17
| | |
Fcorr = Fobs × e(Aex+Aem)/2
| (1) |
where
Fcorr and
Fobs are the corrected and observed fluorescence intensity, respectively, and
Aex and
Aem are the absorbance at excitation and emission wavelengths, respectively.
STD-NMR measurements
In STD-NMR measurements, MF, warfarin sodium, ibuprofen, and lidocaine were dissolved in DMSO-d6, and HSA and NMR samples were prepared using PBS dissolved in D2O. The STD-NMR samples contained 10 × 10−6 M HSA and 0.5 × 10⁻³ to 1.3 × 10⁻³ M MF. HSA and MF were fixed at 10 × 10−6 and 1.3 × 10⁻³ M in the site-marker-displacement experiments, respectively. Then 1.3 × 10⁻³ M ibuprofen, warfarin sodium, and lidocaine were separately added as a probe for sites I, II, and III, respectively.
All the 1H NMR and STD-NMR measurements were performed on a Bruker Avance III 400 MHz spectrometer operating at 400.13 MHz of 1H frequency at a temperature of 310 K. 1H and STD spectra were acquired by a shaped pulse with the water resonance suppression, using the following parameters: spectral width, 12 ppm; nutation angle, 90°; and shaped pulse duration, 2.5 ms. STD-NMR spectra were recorded using Gauss 1.1000 pulses (15.16 W) for selective saturation (50 ms), with a scan number of 64. The on-resonance irradiation of HSA was performed at a chemical shift of 0 ppm, while the off-resonance irradiation was conducted at 40 ppm. The saturation times of 0.5, 0.75, 1, 1.5, 2, and 5 s were applied. To correct the baseline, obtain the difference spectrum of the on- and off-resonance spectra, and obtain the STD intensity, we used the TopSpin 4.0.7 software (Bruker Corporation) for data processing.
CD spectroscopy
A Chirascan-plus CD spectrometer (Applied Photophysics, UK) equipped with 1.0 mm path length quartz cuvette was used to collect the CD spectra at 310 K. The molar ratios of HSA and MF remained 1![[thin space (1/6-em)]](https://www.rsc.org/images/entities/char_2009.gif) :0 and 1:20. The spectra of 190–280 nm was acquired with a step size of 0.2 nm and band width of 1 nm. Each sample solution was scanned three times, and the mean value was calculated for plotting and analysis.
:0 and 1:20. The spectra of 190–280 nm was acquired with a step size of 0.2 nm and band width of 1 nm. Each sample solution was scanned three times, and the mean value was calculated for plotting and analysis.
Molecular simulation
Molecular docking simulation at 310 K was employed using the YASARA software (v 18.3.23.L.64) and the AutoDock Vina docking method on the software platform. The single crystal model of HSA as a receptor was obtained from the Protein Data Bank (PDB ID: 1H9Z), and the 3D structure of the ligand MF was sourced from PubChem (PubChem CID: 5357283). Both the acceptor and the ligand were optimized prior to docking to ensure that they were in the correct protonation state and minimum system energy. According to the site-marker-displacement experiments, the MF was locally docked to the corresponding site.
MD simulations were performed in YASARA with a force field of AMBER14. The docking conformation with the largest docking energy was selected as the optimal conformation for MD simulation. The complex was placed in a box with water of dimensions 100.04 Å × 100.04 Å×100.04 Å along the x, y, and z axes, respectively, and then periodic boundary conditions were applied. The pH was set to 7.4, and the temperature was maintained at 310 K. Water molecules were randomly substituted by Na+ or Cl– to provide charge neutrality. Long-range coulomb interactions were calculated using a particle-mesh Ewald optimization algorithm. The intramolecular force time step was 1.25 fs and that of intermolecular force was 2.50 fs. The data were recorded every 100 ps for a total simulation time of 35 ns.
Results and discussion
Fluorescence quenching between MF and HSA
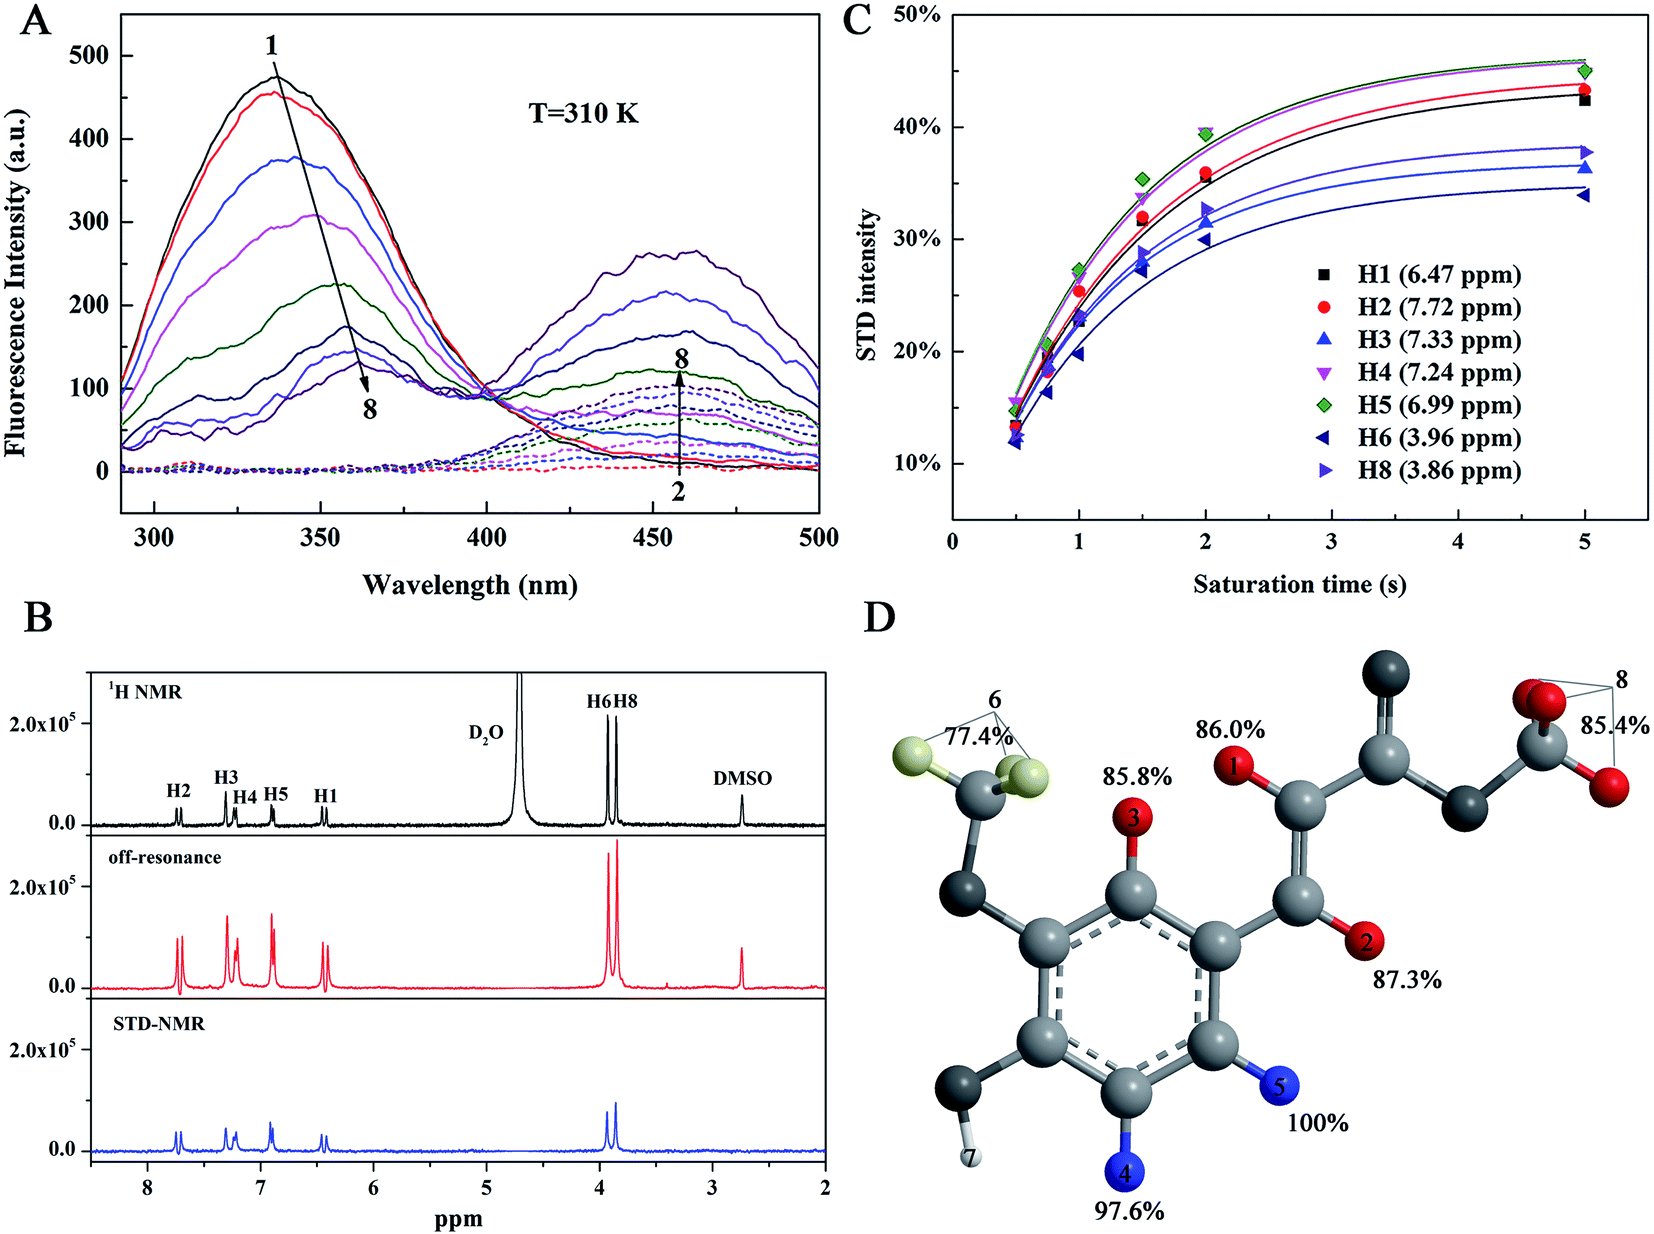
The fluorescence spectroscopy is an effective tool to determine the interactions between a small molecule and a macromolecule that presents fluorescence.18 The 585 amino acid residues of HSA contain tryptophan (Trp), tyrosine (Tyr), and phenylalanine (Phe) chromophores, resulting in strong endogenous fluorescence when HSA is excited. Generally, the binding of small molecules to HSA affects the microenvironment around the HSA chromophore, thus reducing the endogenous fluorescence intensity (fluorescence quenching) of HSA or causing the blue/red shift of the peak. Fig. 2A shows the effect of MF on HSA fluorescence emission intensity at 310 K. With increased MF concentration, the intensities of the fluorescence emission spectra of HSA decreased, and the maximum emission wavelength exhibited a red shift of 24 nm (337.07 nm → 361.07 nm). This result indicated the binding between MF and HSA, and that the binding of MF caused the HSA chromophore in a more polar environment and more exposure to solvents.19
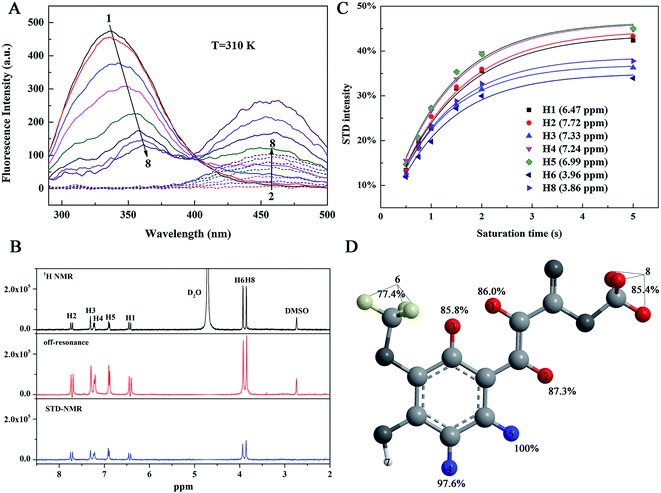 |
| | Fig. 2 (A) Fluorescence emission spectra of HSA at various MF concentrations at 310 K. The dotted lines represent the free MF fluorescence emission spectrum of the corresponding concentration. CHSA = 2.0 × 10⁻⁶ M, CMF(1–8) = 0, 2, 10, 20, 40, 60, 80, 100 × 10−6 M. (B) STD-NMR and off-resonance spectra of HSA–MF interaction system, CHSA = 10 × 10−6 M, CMF = 1.3 × 10⁻³ M, and 1H NMR spectrum of MF (1.3 × 10⁻³ M) alone. (C) Fitting curves for η(tsat) = STDmax(1 − exp(−ksattsat)) for each ligand proton of MF (1.3 × 10⁻³ M) for its interaction with HSA (10 × 10−6 M). (D) Binding epitope mapping of HSA-MF interaction. Blue: >90%, red: 90–80%, yellow: <80%. | |
MF also had a weak fluorescence at 390–500 nm, and the presence of HSA increased the fluorescence intensity of MF, indicating a fluorescence-resonance energy transfer (FRET) between HSA and MF. FRET refers to the formation of complex between ligand and receptor,20,21 which can also indicate the binding between HSA and MF was formed.
Affinity relationship between protons in MF and HSA
In this work, we used STD-NMR technique to obtain information on the affinity relationship between protons in MF and HSA. The STD-NMR experiment is based on the transfer of saturation from the protein to the binding ligand. Protein resonance saturation (shown as a complete reduction in intensity) is achieved by selective irradiation of low-energy pulses. If a ligand binds to a protein, saturation may be transferred to this ligand through intermolecular 1H–1H cross relaxation. Among the binding ligands, the protons close to the protein surface are highly saturated, while the protons that are not in close contact with the protein are less saturated or unsaturated. Therefore, the STD-NMR spectrum that is the difference spectrum of off-resonance (unsaturation) and on-resonance (saturation) spectra shows signals only from ligands that have binding affinity to protein. In addition, the STD-NMR spectrum may only show the signals of ligand protons that are in close contact with the protein binding site.22 We made a 1H NMR spectrum of MF alone as a reference, combined with STD-NMR spectrum to determine which protons in the MF bound to HSA. From the STD-NMR and the 1H NMR spectra (Fig. 2B), except for the active hydrogen (H7) in the MF hydroxyl group, which cannot be displayed in the spectra due to the proton exchange with D2O, hydrogen atoms H1–6 and H8 are observed in the STD-NMR spectrum, indicating that these hydrogen atoms were bound to HSA. In other words, MF was completely enveloped in the hydrophobic cavity of HSA. The less the intensity of the proton the STD-NMR spectrum differs from that in the off-resonance spectrum, the closer its contact with the protein is. It can be seen from the off-resonance and STD-NMR spectra (Fig. 2B) that the intensity changes of H6 and H8 are slightly larger than those of H1–5. It is inferred that the affinity of H6 and H8 to HSA may be weaker.
To visually reveal the binding structure details of the HSA–MF interaction, we carried out binding epitope mapping. For a given ligand, not all proton signals in the STD-NMR spectrum can obtain the same saturation. Theoretically, the magnetization transfer from protein to ligand depends on their distance in the bound state. Therefore, the stronger the ligand signal intensity is in the STD-NMR spectrum, the closer the ligand proton is to the protons on the protein surface.13 Generally, the STD signal intensities of all protons depend on the saturation time, and the saturation degree of transfer to the ligand proton usually increases with time. A rebound is also observed between the ligand and protein, which affect the STD intensity. According to Angulo et al.,23 the STD initial growing rates (STD0), which can be calculated as follows, should be used to determine the ligand epitope mapping to reduce the effects mentioned above:
| | |
η(tsat) = STDmax(1 − exp(−ksattsat))
| (2) |
| |
 | (3) |
where
η(
tsat) is the STD effect at a given saturation time, STD
max is the equilibrium STD intensity, and
ksat is the rate constant of saturation transfer. There are two ways to get
η(
tsat) for each proton.
11 The first is that when each peak of the ligand is well separated and there is no overlap,
η(
tsat) can be obtained by integrating the peaks:
| | |
η(tsat) = (I0 − Isat)/I0
| (4) |
where
I0 is the integral of a signal from the off-resonance spectrum at a given saturation time and
Isat is the integral of the same signal from the on-resonance spectrum at the same saturation time. However, in most cases, there are overlaps in the peaks, so the integral cannot be accurately calculated. In this case, the second method is adopted: the baselines of the off-resonance spectrum and the difference spectrum coincide completely, and the off-resonance spectrum is scaled until its shape/height matches the difference spectrum, and the scale factor is the STD effect of that peak. In this work, some peaks in the on-resonance spectrum were not well separated, so the second method was chosen and the resulting
η(
tsat) values for each ligand proton of 1.3 × 10
−3 M MF and 10 × 10
−6 M HSA are listed in Table S1.
†
The fit curves and results obtained for eqn (2) and (3) are shown in Fig. 2C and Table 1, respectively. The normalized STD0 value represents a contact map of a protein–ligand in the bound state (ligand-binding epitope mapping, Fig. 2D), mapping which chemical structure of the ligand is key to protein–ligand interaction, and the highest STD0 for H5 proton was set to 100%. H1–6 and H8 have high normalized STD0 values, ranging from 70% to 100%. This high normalized STD0 indicated the proximity of these protons to HSA. The order of hydrogen atom affinity for HSA in MF is as follows: H5 > H4 > H2 > H1 > H3 ≈ H8 > H6. This finding revealed that the protons of aromatic ring had a high affinity with HSA, followed by the protons of the carbon–carbon double bond. When the aromatic ring interacts hydrophobic with HSA, methoxy may protrude outward from the ring plane and move away from HSA compared with the aromatic ring. However, methoxy still interacts with other amino acid residues in the binding pocket, resulting in relatively low affinity to HSA. Therefore, the aromatic ring is more important for the HSA–MF interaction due to its closer interaction with HSA than the other protons.
Table 1 STDmax, ksat, STD0, and normalized STD0 of MF (1.3 × 10⁻³ M) for its interaction with HSA (10 × 10−6 M)
| Proton |
STDmax |
ksat (s−1) |
STD0 |
Normalized STD0 |
| H1 |
0.438 |
0.788 |
0.345 |
86.03% |
| H2 |
0.448 |
0.783 |
0.351 |
87.53% |
| H3 |
0.369 |
0.933 |
0.344 |
85.79% |
| H4 |
0.465 |
0.843 |
0.392 |
97.76% |
| H5 |
0.466 |
0.861 |
0.401 |
100.00% |
| H6 |
0.350 |
0.886 |
0.310 |
77.31% |
| H8 |
0.387 |
0.886 |
0.343 |
85.54% |
Assessment of binding ability
The observed STD intensity is related to the concentration of the protein–ligand complex, indicating that the STD-NMR technique might be used to estimate the binding affinity between the ligand and the protein, which can be determined using the binding constant (Ka). To further investigate the affinity of the whole MF to HSA, we calculated the Ka value of HSA–MF interaction. In the STD-NMR experiment, Kd was first calculated, and then Ka was derived according to the formula: Kd × Ka = 1.
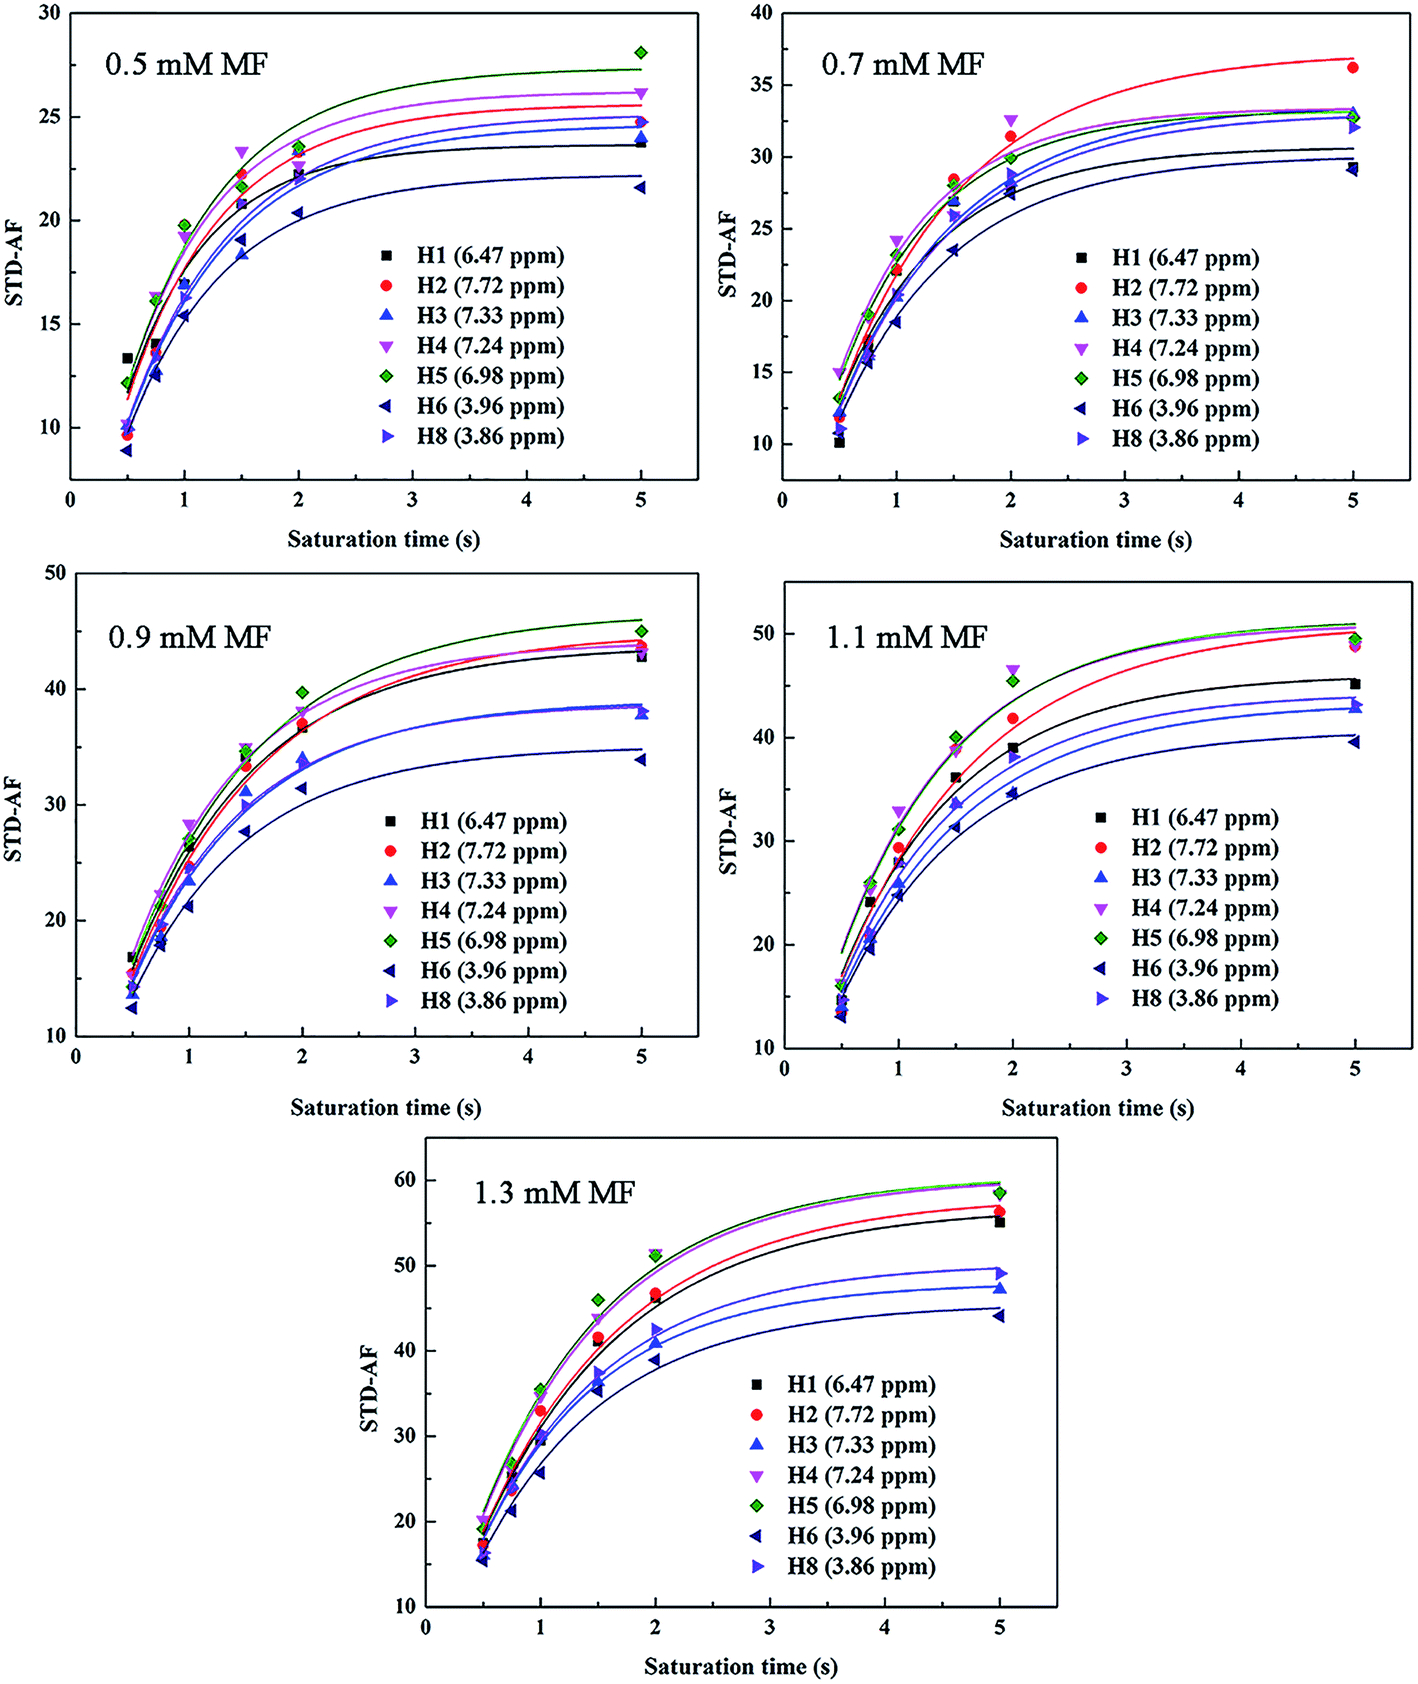
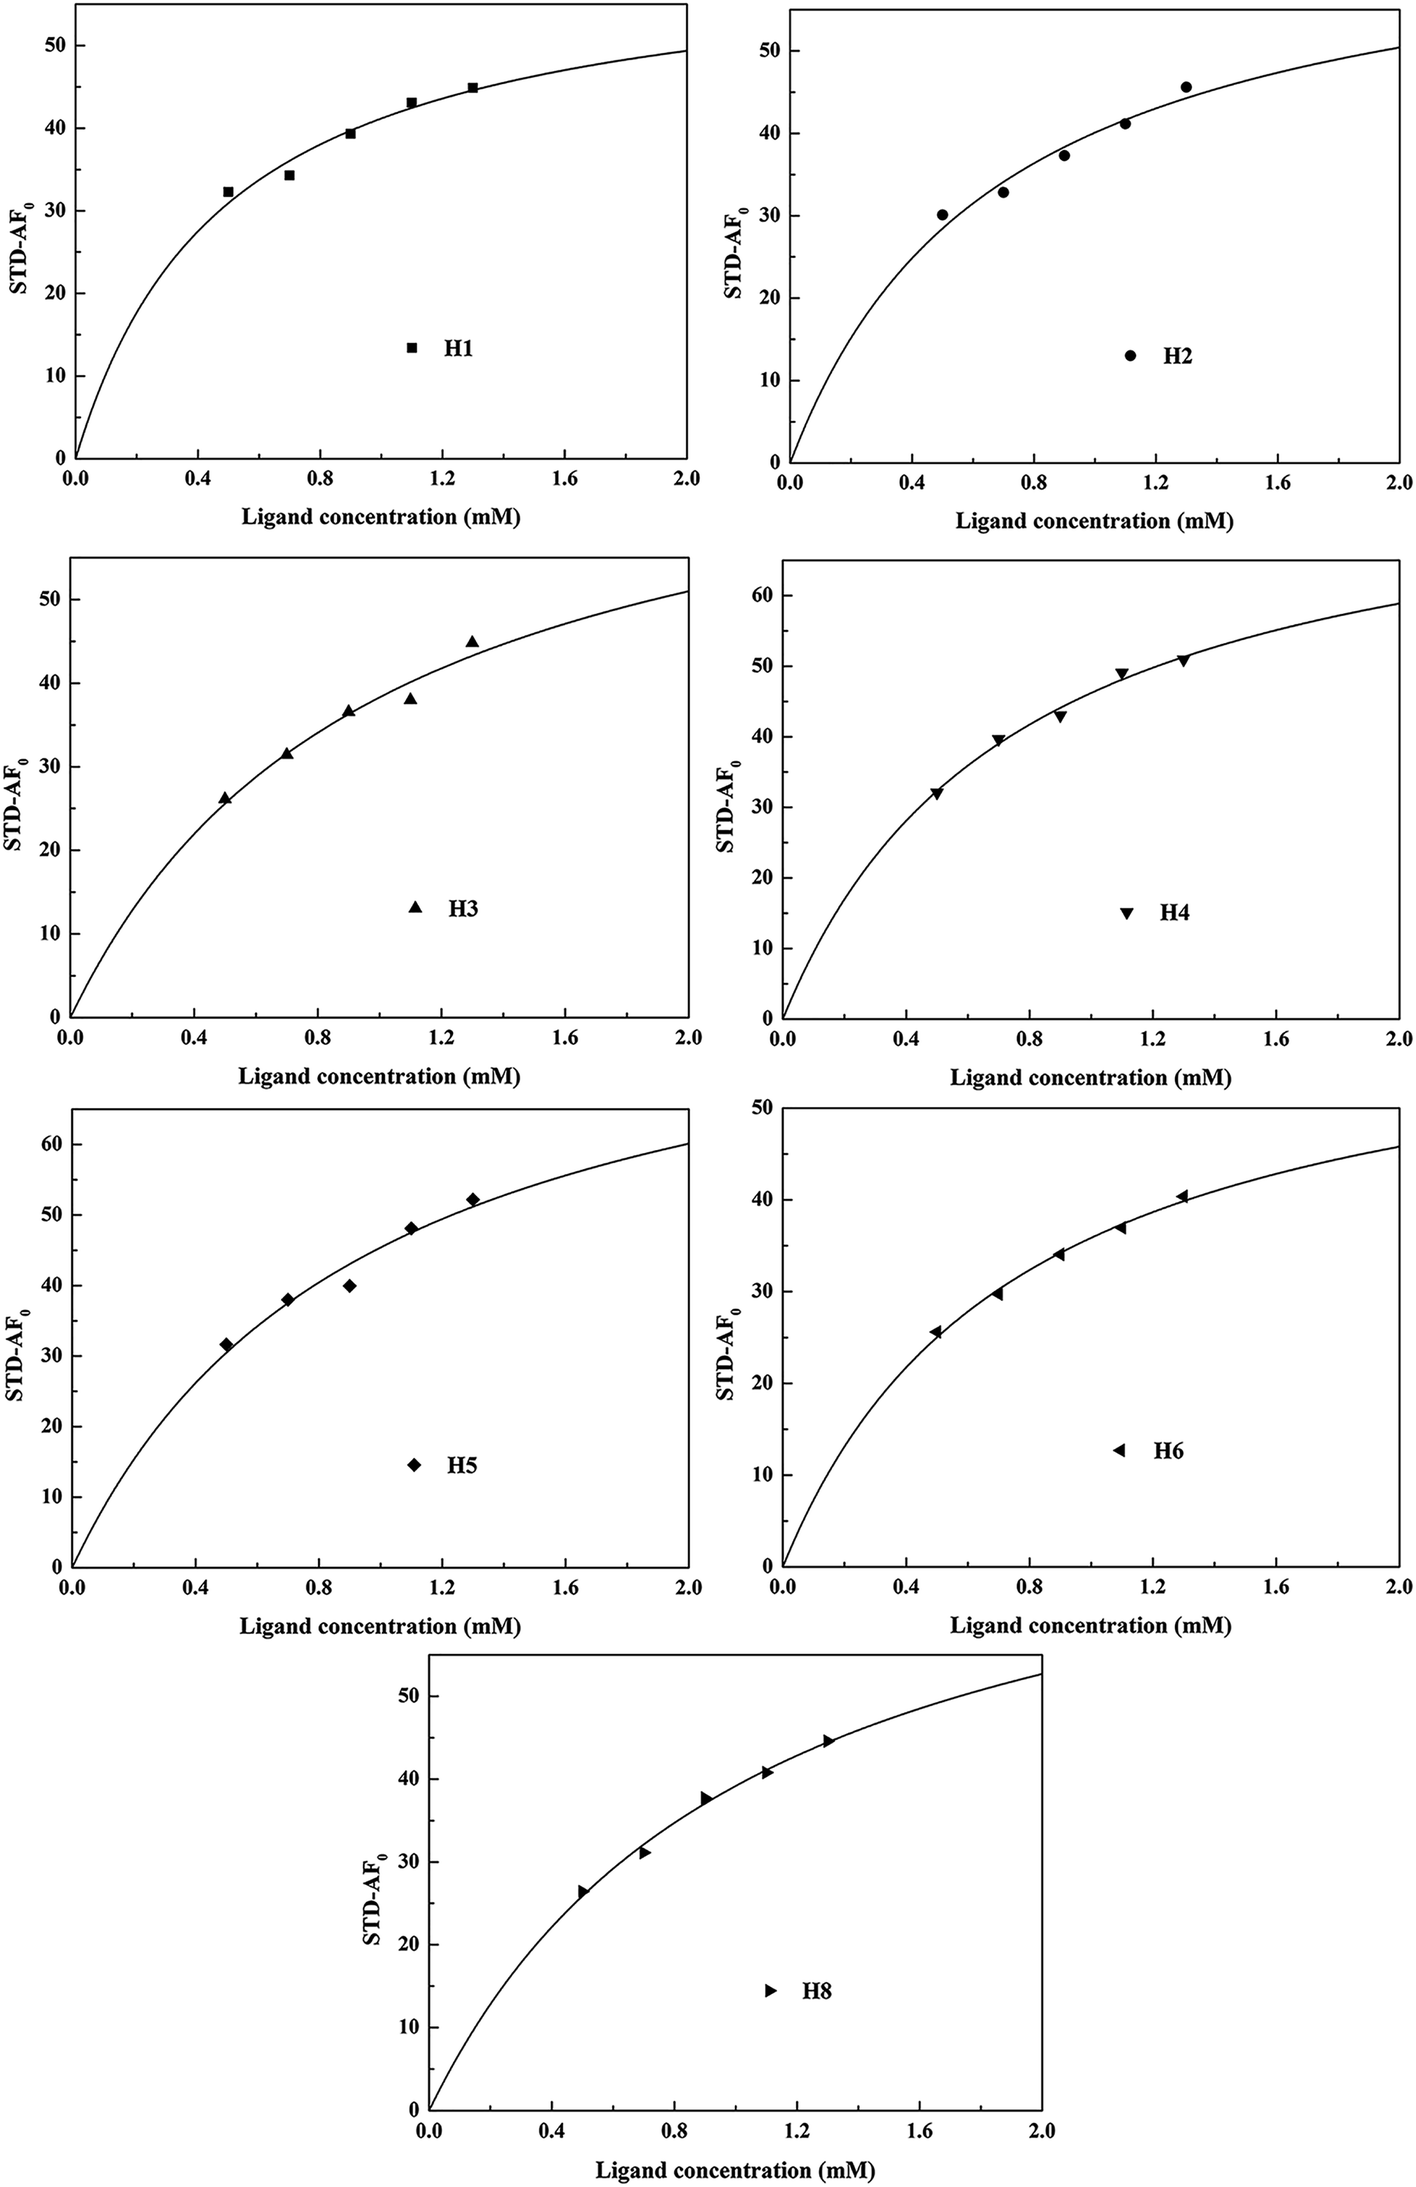
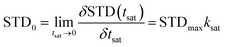
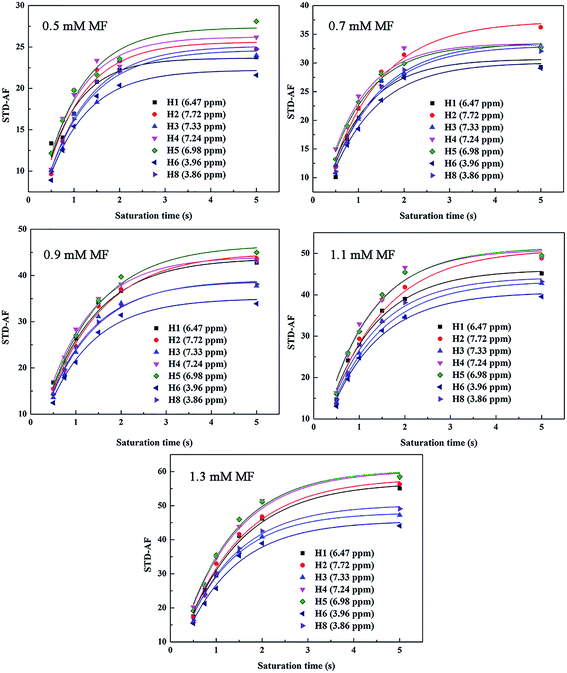
The STD signal intensity primarily reflects two factors, namely, the efficiency of protein proton saturation transfer in the bound state and the rate at which a saturated ligand molecule accumulates in a free state during saturation time. The first factor is related to the 3D geometry of the protein–ligand system, while the second factor depends on saturation time, ligand concentration, protein-to-ligand ratio, and temperature.24 The influence of the above parameters is a source of bias for Kd values. However, these factors are easily optimized with appropriate experimental parameters settings. The Kd calculated using the STD-NMR techniques is sensitive to the saturation time of the STD-NMR experiment, the degree of saturation of the considered proton, and the fraction of the bound ligand. Hence, the initial growth rate of the STD amplification factors (STD-AF0) at each ligand concentration was used to construct a binding (Langmuir) isotherm to obtain Kd with small bias.25 STD-AF0 is the value that extrapolates the STD amplification factor (STD-AF) to zero time, and it is obtained using the following equations:
| | |
STD-AF(tsat) = εη(tsat)
| (5) |
| | |
STD-AF(tsat) = STD-AFmax(1 − exp(−Ksattsat))
| (6) |
| | |
STD-AF0 = STD-AFmaxKsat
| (7) |
where
ε is the ratio of ligand to HSA ([L]/[P]), which makes STD-AF proportional to the fraction of bound protein, STD-AF
max is the maximum STD-AF achievable for a given proton, and
Ksat is its saturation rate constant. The fit curves of
eqn (6) for HSA–MF interaction are shown in
Fig. 3. The
Kd value is then determined based on the Langmuir curve using the following equation:
| | |
STD-AF0([L]) = αSTD[L]/([L] + Kd)
| (8) |
where
αSTD is a dimensionless scaling factor representing the maximum STD amplification for the monitored signal. The Langmuir curves of HSA–MF interaction are shown in
Fig. 4. According to
eqn (5)–(8), the
Kd and
Ka values of HSA–MF interaction were 0.816 × 10
−3 M and 1.298 × 10
3 M
−1, respectively. The
Ka of HSA–MF interaction was moderate compared with that of other strong protein–ligand complexes with binding constants ranging from 10
6 M
−1 to 10
8 M
−1, indicating that MF can achieve normal physiological processes such as binding, storage and transportation by HSA.
 |
| | Fig. 3 Fitting curves of STD−AF(tsat) = STD−AFmax(1 − exp(−Ksattsat)) for each ligand proton of MF for its interaction with HSA. | |
 |
| | Fig. 4 Langmuir curves of HSA-MF interaction. | |
Identification of binding site study on HSA
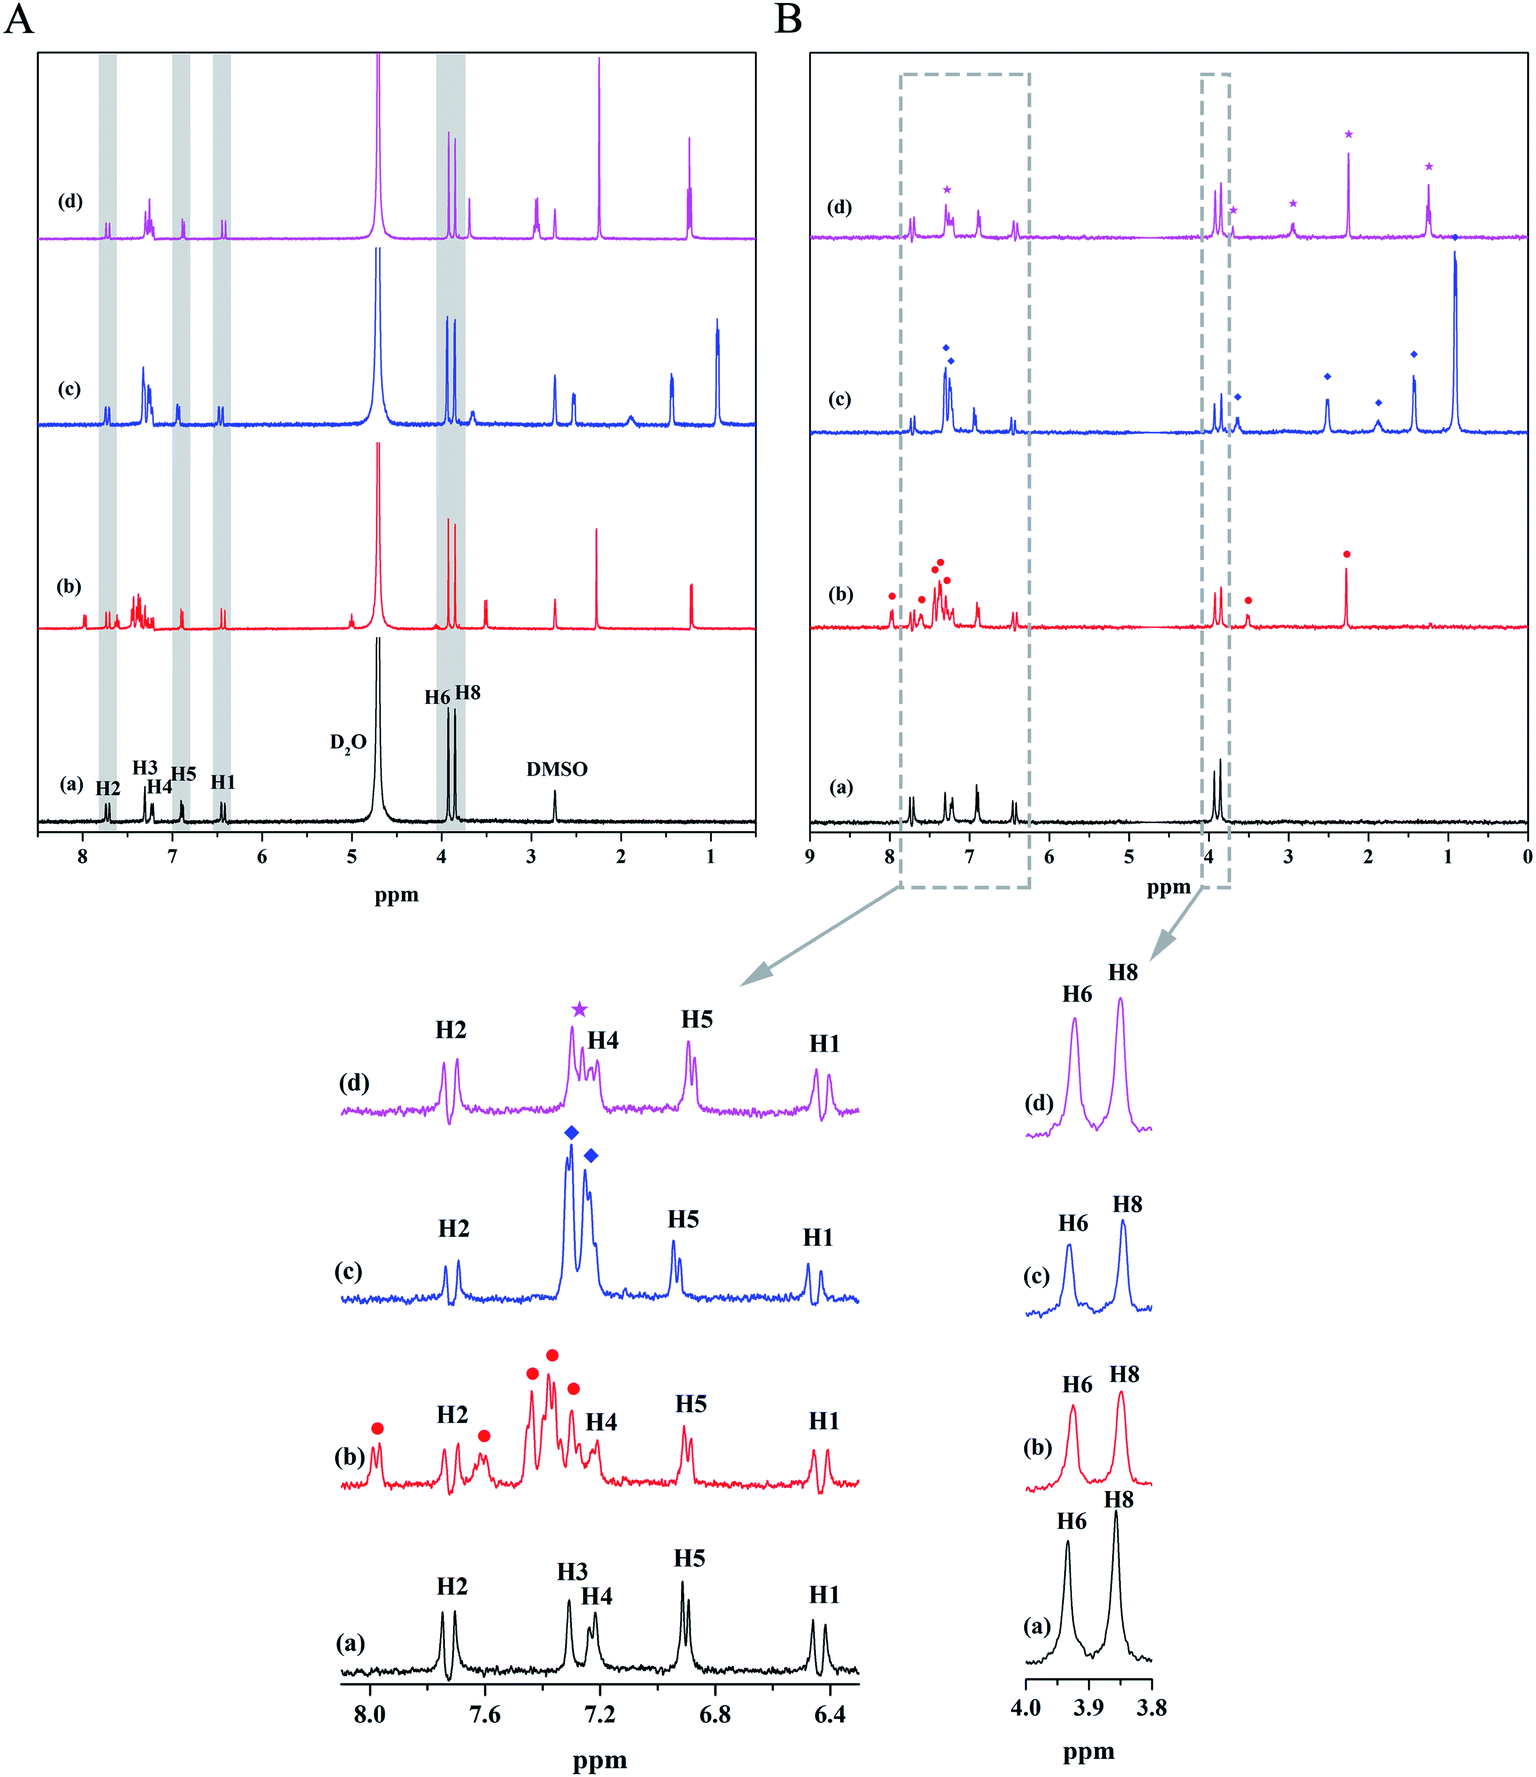
Small molecule ligands are primarily bound at three sites of HSA, namely, site I (subdomain IIA), site II (subdomain IIIA), and site III (subdomain IB).26 Warfarin sodium binds preferentially to site I, ibuprofen is considered as a typical binding ligand for site II, and lidocaine can bind well to site III.27–29 They can be used as probes to determine the binding sites of ligands with unknown binding sites. We first attained the 1H NMR spectrum of the mixed solutions of the three probes and MF to determine whether there is any interaction between probe and MF. As can be seen from Fig. 5A, the signal peaks of H3 and H4 of MF overlap the signal peak of the probes seriously, while other peaks are well separated. Besides, there is no chemical shift change of MF signal peaks after mixing with probes, which proved that probe and MF have no interaction. Then, probes were separately added to the HSA–MF mixed solution, and the STD-NMR spectra were measured to determine the site at which MF might bind to HSA, as shown in Fig. 5B. After the addition of warfarin sodium and ibuprofen, the STD signal of MF decreased to some extent, and lidocaine had almost no effect on the STD signal of MF, that is, both warfarin sodium and ibuprofen can compete with MF for the binding site of HSA, whereas lidocaine cannot. Hence, MF may bind to sites I and II. Ligands first bind to the major binding sites of the target protein, and excess ligand binds to other secondary binding sites.30 Through the magnified view, it was found that the STD intensities after adding ibuprofen decreased slightly more than that after adding warfarin sodium. Those well-separated signal peaks such as H1, H2, H5, H6, and H8 were used as comparison objects to compare the changes in STD intensity of MF after adding ibuprofen and warfarin sodium. Results showed that after adding ibuprofen, the STD intensity decreased by an average of 41.44%, while the STD intensity decreased an average of 34.24% after adding warfarin sodium, indicating that MF was prefer to bind to site II.
 |
| | Fig. 5 (A) 1H NMR spectra of: (a) MF; (b) MF–warfarin sodium (1:1); (c) MF–ibuprofen (1:1); (d) MF–lidocaine (1:1). CMF = 1.3 × 10⁻³ M. (B) STD-NMR spectra of the site-marker-displacement experiments: (a) HSA–MF (1:130); (b) HSA–MF–warfarin sodium (1:130:130); (c) HSA–MF–ibuprofen (1:130:130); (d) HSA–MF–lidocaine (1:130:130). CHSA = 10 × 10−6 M. The bottom figures show the magnified view of the portion of the corresponding dashed box. ★: lidocaine, ◆: ibuprofen, ●: warfarin sodium. | |
Study on the conformation change of HSA
As an important transport protein, the key to play its biological transport activity is that the specific spatial conformation and basic carbon framework of HSA does not change significantly after small molecules are bound. The binding of small molecules to HSA usually disturbs the secondary structure of HSA, such as the change of amino acid residue microenvironment and α-helix content. Based on the analysis of steady-state fluorescence spectra, it was observed that the microenvironment of HSA amino acid residues has slightly changed by MF (Fluorescence quenching between MF and HSA).
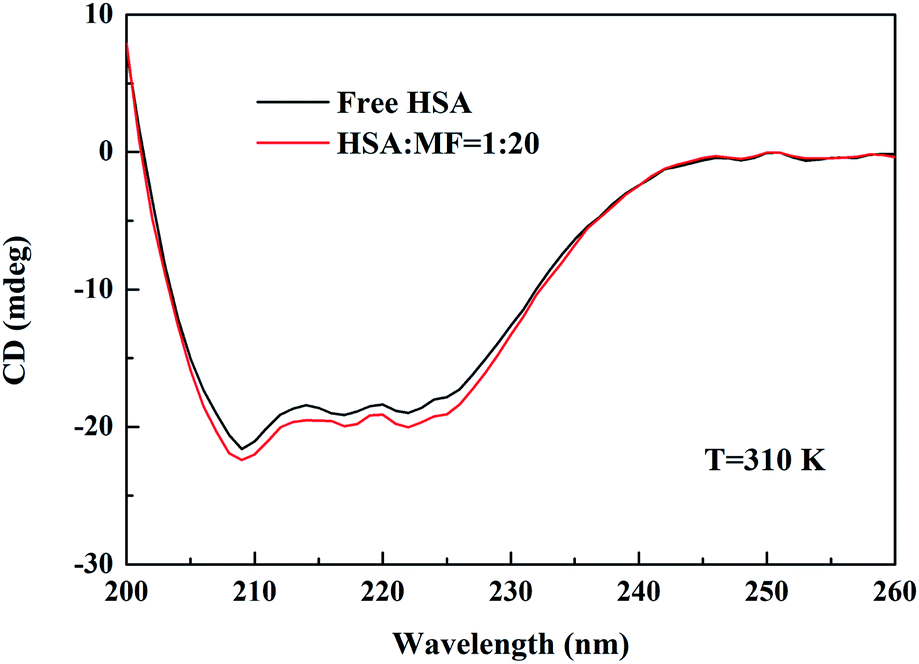
Measuring the CD spectrum of proteins is the most commonly used method for monitoring changes in the secondary structure of macromolecules in protein–ligand interaction systems. The CD signal of proteins is mainly related to peptide bonds, aromatic amino acid side chains, and disulfide bonds.31 Fig. 6 shows the CD spectra of the interaction between MF and HSA. Free HSA has two negative CD signal peaks at 208 and 222 nm, which can be attributed to n → π* transitions for the α-helix of the protein.32,33 Upon the addition of MF, CD signal was slightly enhanced, but the shape and position of peak were not changed, representing that the addition of MF did not change the skeleton structure of HSA but increased the content of α-helix. An increase in the α-helix content indicated that the binding of MF resulted in localized contraction of HSA.
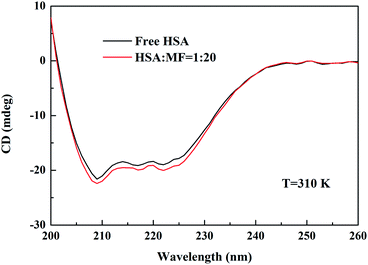 |
| | Fig. 6 CD spectra of HSA in the absence and presence of MF at 310 K. CHSA = 2.0 × 10⁻⁶ M and CMF = 40.0 × 10⁻⁶ M. | |
The content of α-helix in HSA with and without MF can be calculated based on the mean residue ellipticity (MRE) at 208 nm as follows:34
| | |
MRE208 = observerd CD(mdeg)/(Cpnl × 10)
| (9) |
| | |
α-helix(%) = (−MRE208 − 4000)/(33000 − 4000) × 100
| (10) |
where
Cp is the molar concentration of HSA,
n is the number (585) of amino acid residues in HSA, and
l is the path length (0.1 cm) of the cell used in the test. According to the above two equations, the α-helix of free HSA was 47.13%, which became 50.17% after the addition of 40 × 10
−6 M MF. In conclusion, MF slightly increases the HSA α-helix content, thereby affecting the secondary conformation of HSA. However, it does not change the basic skeleton of HSA, and the effect of MF on HSA function is negligible.
Molecular docking study
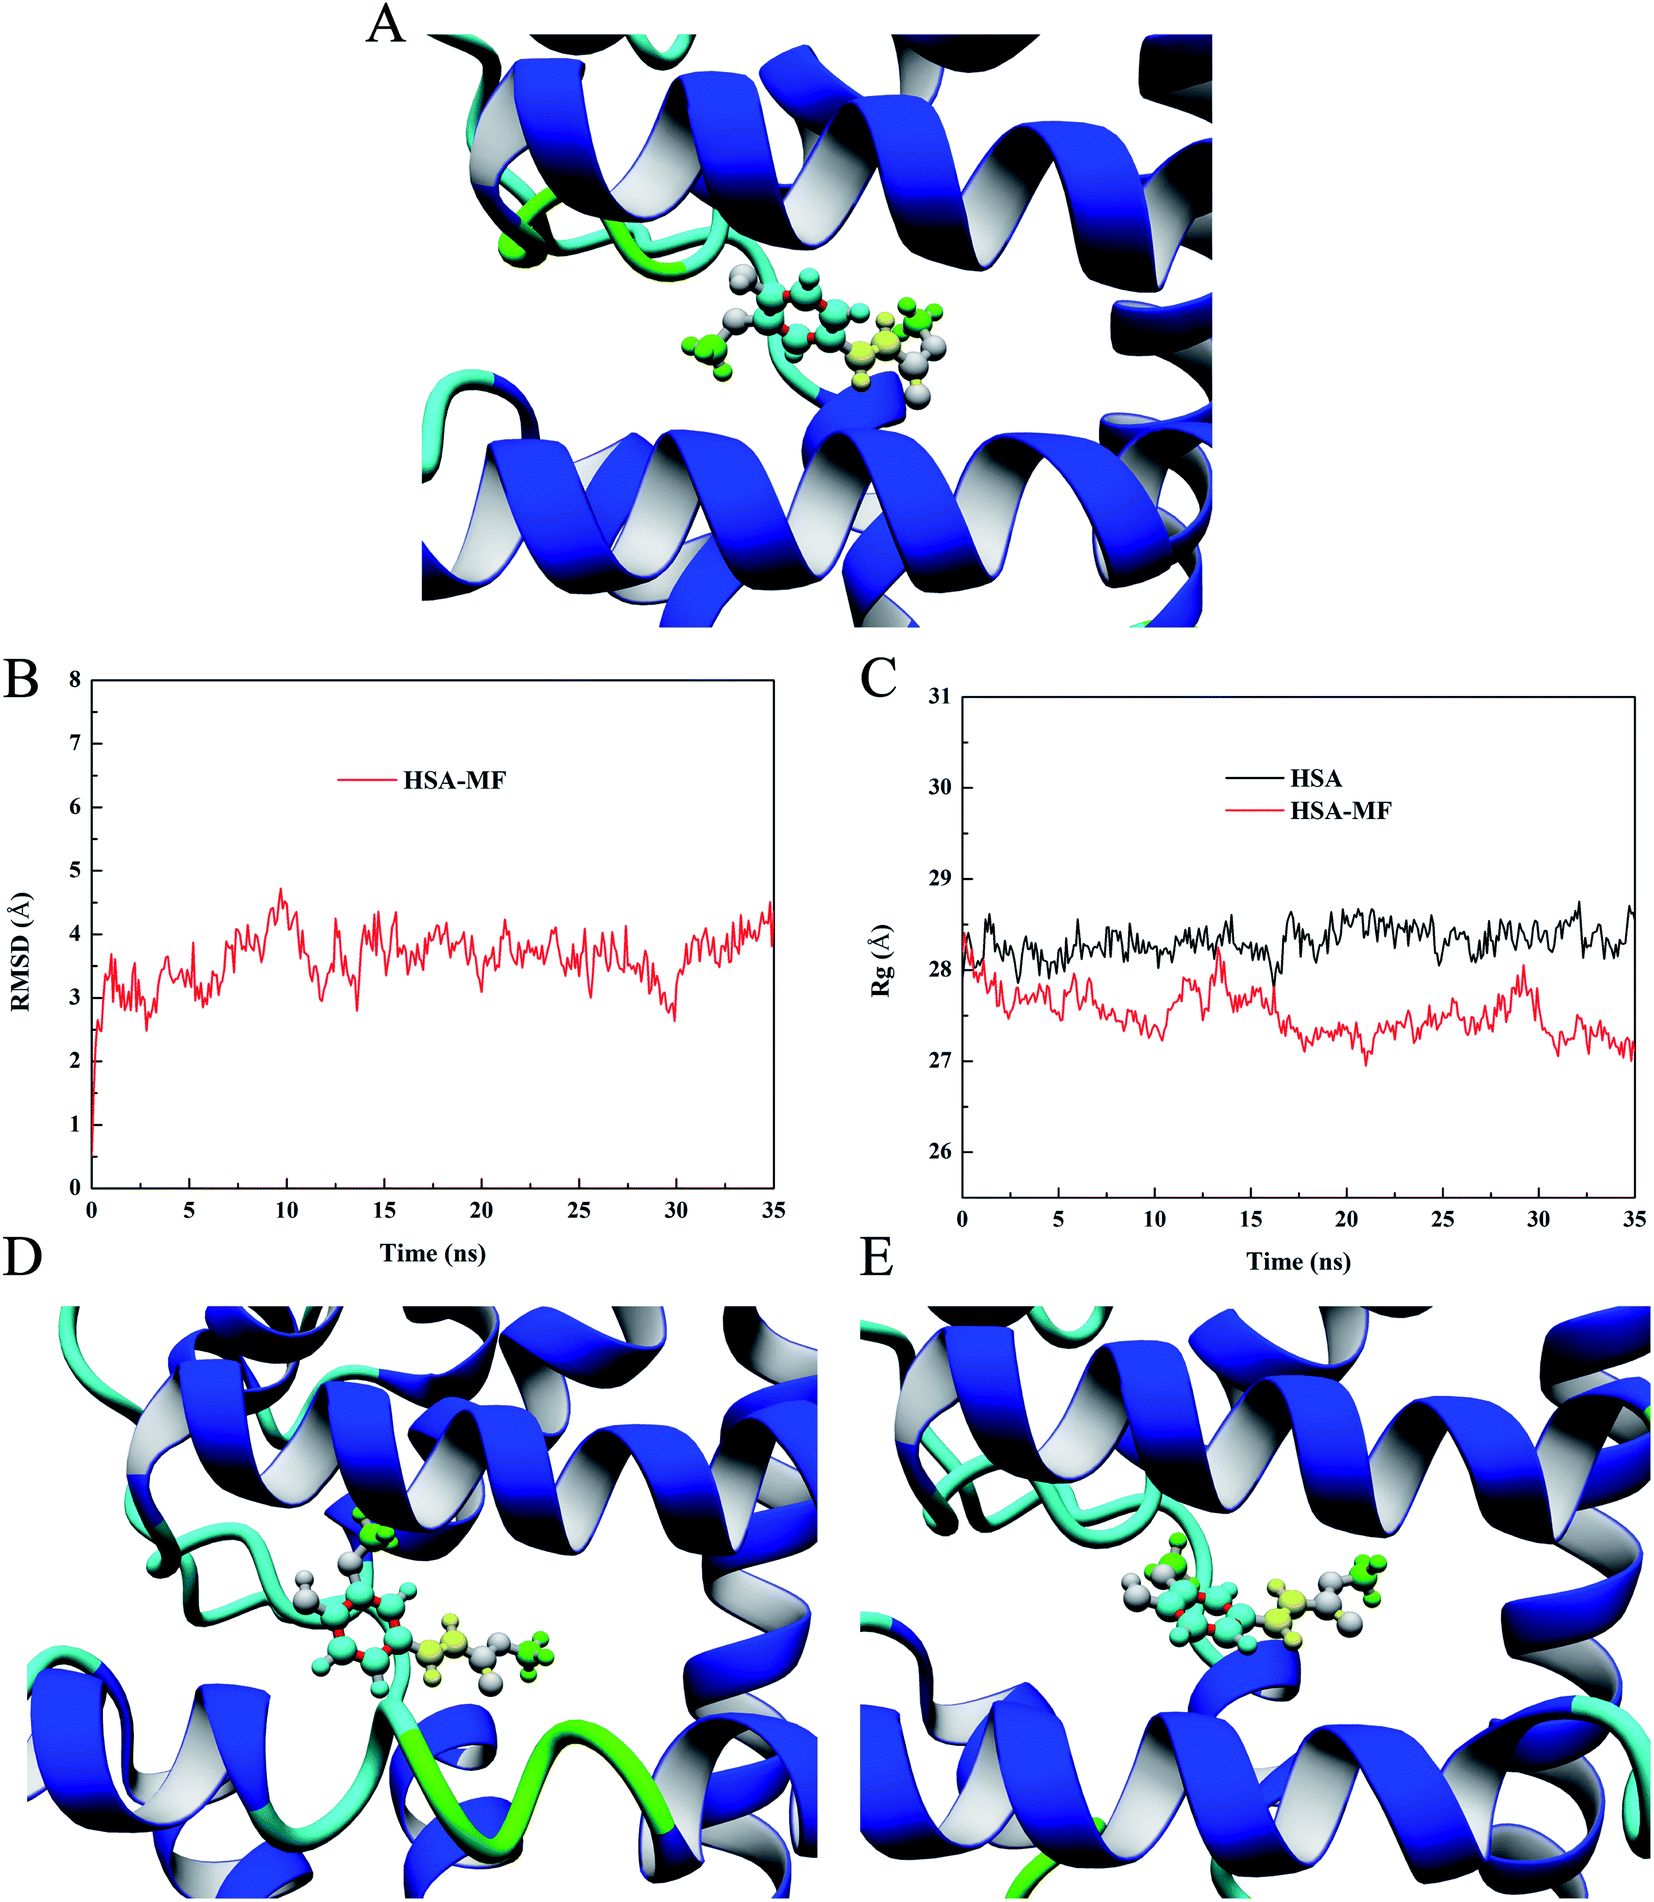
Molecular docking technology has developed rapidly and has become an internationally recognized research method for screening and predicting ligands that may bind to target macromolecules.35 It can visualize the binding mode and the spatial orientation of ligands and the chemical groups involved in the interaction of macromolecules and ligands. In this study, the YASARA software was used for local docking, and the dock results were compared with the binding epitope mapping to determine the reliability of the experimental results. According to the results of the site-marker-displacement experiments, MF was docked into the site II of HSA, and the conformation with the highest binding energy was selected as the most likely binding conformation. The binding energy of this conformation was 7.12 kcal mol−1. In YASARA, the binding energy is defined as follows: binding energy = receptor energy + ligand energy − complex energy; hence, the more positive the docking energy is, the more stable the conformation is.36 The corresponding 3D diagrams of the HSA–MF interaction system are shown in Fig. 7A in which the entire MF molecule can be successfully embedded into the hydrophobic cavity of site II. The aromatic ring was obviously closer to HAS and the average distance from the interacting amino acid residues (hereafter referred to as average distance) was 4.56 Å, followed by the carbon–carbon double bond with an average distance of 4.77 Å. The methoxy groups were protruding outward from the ring plane and the average distance was 4.84 Å, which were relatively far away from the surface of the HAS. This finding is highly consistent with the conclusion and guess obtained via binding epitope mapping. It was further confirmed the reliability of STD-NMR technique in predicting the conformational information of the bound state ligand. The docking results showed that MF was surrounded by Val473, Leu460, Leu430, Val426, Tyr411, Leu491, Phe488, Val415, and Leu457 amino acid residues and connected to them by hydrophobic force (Fig. S1†), indicating that hydrophobic interaction is the major binding force for HSA–MF interaction.
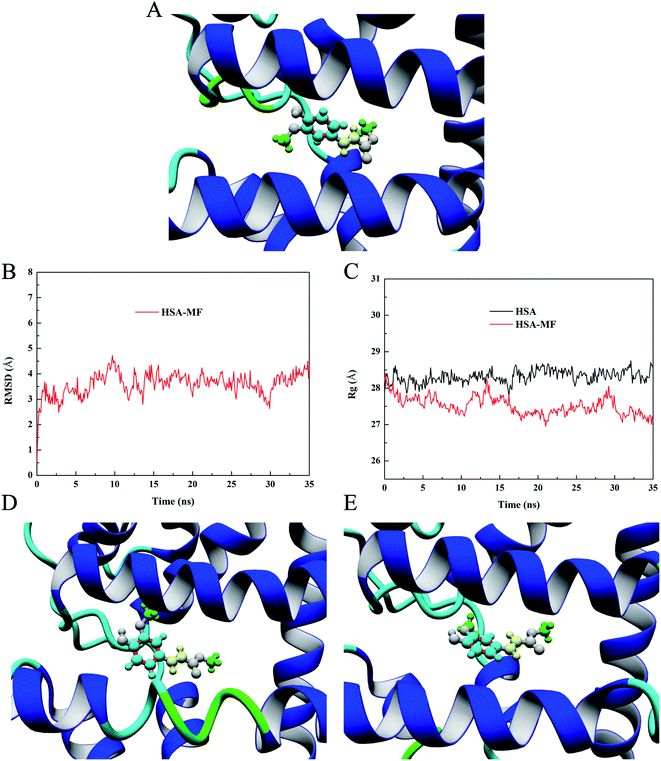 |
| | Fig. 7 (A) Best dock result of the HSA–MF interaction system. Blue: aromatic ring, yellow: carbon–carbon double bond, Green: methyl. RMSD (B) and Rg (C) trajectory of HSA–MF interaction system. Simulation snapshots of HSA–MF interaction system at 20 ns (D) and 30 ns (E). | |
MD simulation study
The molecular docking result can only represent the transient state. The stable binding mode of MF and HSA needs further study. MD simulation has been widely used in protein–ligand studies to explore the stability, conformation change, and dynamic properties of HSA after binding the ligand. In other words, the MD simulation process provides more than just a single binding state but also considers the details at the molecule level during the molecular movement. Therefore, the root mean square deviations (RMSD), radius of gyration (Rg) and the simulation snapshot obtained from MD simulation were used to discuss dynamic properties of HSA–MF interaction in this study.
RMSD can describe how much the HSA conformation changes relative to the original conformation during the simulation to determine whether the HSA–MF interaction system is stable during simulation.37 The RMSD trajectory of the HSA–MF interaction system is shown in Fig. 7B and a considerable increase was observed in the initial 2 ns, indicating a significant change in the conformation after HSA binding MF, resulting in an increase in RMSD from 0.51 Å to 2.28 Å. After 12 ns, the fluctuations decreased, forming a stable trajectory, indicating that the HSA–MF interaction system reached a stable state after 12 ns, which provided a reliable basis for subsequent analysis.
Rg, which refers to the mass-weight root mean square distance of a collection of atoms from their common center of mass, provides insight into the changes in the overall size of the protein during the simulation.38 Fig. 7C shows that the Rg values of free HSA and HSA–MF interaction system were almost identical at the beginning with values of 27.91 Å for free HSA and 28.20 Å for the HSA–MF interaction system. After approximately 2 ns, the Rg value of the HSA–MF interaction system was much less than that of free HSA, indicating that MF caused the local contraction of HSA. Hence, the overall size of the HSA combined with MF was less than that of free HSA; this finding is consistent with the conclusion drawn by CD experiments. At 12–35 ns, the average Rg value of the HSA–MF interaction system was 27.45 ± 0.23 Å, while that of HSA was 28.37 ± 0.16 Å.
In dynamic simulation, simulated snapshot refers to a 3D model of protein–ligand interaction at a specific time, where the binding state of the protein and ligand at that time can be seen. The above analysis shows that the HSA–MF interaction system reaches a stable state after 12 ns, so we take two simulation snapshots after 12 ns to observe the change of the position orientation of MF in the dynamic simulation. Fig. 7D and E are simulation snapshots at 20 ns and 30 ns, respectively. It can be seen that the orientation of the MF has changed during the simulation. The average distances of aromatic ring, carbon–carbon double bond, and methoxy groups were 4.43 Å, 4.70 Å, 4.78 Å at 20 ns and 4.81 Å, 4.83 Å, 5.1 Å at 30 ns. The results showed that although the orientation of MF was changed in the dynamic simulation, the aromatic ring was the most closely bound to the protein and more important for the HSA–MF interaction, and the methyl groups had the weakest affinity for HSA, which was consistent with the results obtained by STD-NMR.
Conclusions
In this study, STD-NMR technique provided reliable binding information on the interaction between MF and HSA. All the hydrogens of MF driven by hydrophobic interactions were close to HSA at a distance with a low apparent affinity of 103 M−1, and the order of affinity relationship was: H5 > H4 > H2 > H1 > H3 ≈ H8 > H6. The binding mode of HSA–MF suggested that the MF was prefer to bind to the subdomain IIIA of HSA, causing a slightly increase of the α-helix content of HSA. In summary, the findings of this study provide the potential for MF to apply in food and medicine industries and will provide a reference for the physiological safety characteristics of natural products in plants to be food additives or drugs, which would be of great interest to researchers developing new food additives and new drugs. However, further in vivo and in vitro studies are needed to provide more evidence for the widespread use of MF in food and medicine industries.
Conflicts of interest
There are no conflicts to declare.
Acknowledgements
This work was supported by the National Natural Science Foundation of China (NNSFC Grant 21704069).
References
- Y. S. Kwon and C. M. Kim, Arch. Pharmacal Res., 2003, 26, 535–539 CrossRef CAS.
- W. Wang, J. Guo, J. Zhang, J. Peng, T. Liu and Z. Xin, Food Chem., 2015, 171, 40–49 CrossRef CAS.
- W.-M. Zhang, W. Wang, J.-J. Zhang, Z.-R. Wang, Y. Wang, W.-J. Hao and W.-Y. Huang, J. Food Sci., 2016, 81, M1192–M1196 CrossRef CAS.
- X. Qiu, C. Jacobsen, P. Villeneuve, E. Durand and A.-D. M. Sørensen, J. Agric. Food Chem., 2017, 65, 9496–9505 CrossRef CAS.
- A.-D. M. Sørensen, K. S. Lyneborg, P. Villeneuve and C. Jacobsen, J. Funct. Foods, 2015, 18, 959–967 CrossRef.
- T. Masuda, K. Yamada, T. Maekawa, Y. Takeda and H. Yamaguchi, J. Agric. Food Chem., 2006, 54, 6069–6074 CrossRef CAS.
- R. Merkl, I. Hrádková, V. Filip and J. Šmidrkal, Czech J. Food Sci., 2010, 28, 275–279 CrossRef CAS.
- N. T. M. Phuong, T. T. Cuong and D. N. Quang, Asian Pac. J. Trop. Med., 2014, 7, S327–S331 CrossRef CAS.
- A. Raza, F. Muhammad, D. P. de Sousa, T. Khaliq, B. Aslam, L. Andrade, S. Bashir, M. I. Anwar, M. Shahid and M. Qamar, Pharm. Biol., 2016, 54, 523–529 CrossRef CAS.
- T. Hushcha, Talanta, 2000, 53, 29–34 CrossRef CAS.
- S. Walpole, S. Monaco, R. Nepravishta and J. Angulo, Methods Enzymol., 2019, 615, 423–451 CAS.
- C. A. Lepre, J. M. Moore and J. W. Peng, Chem. Rev., 2004, 104, 3641–3676 CrossRef CAS.
- M. Mayer and B. Meyer, J. Am. Chem. Soc., 2001, 123, 6108–6117 CrossRef CAS.
- S. A. K. Tanoli, N. U. Tanoli, T. M. Bondancia, S. Usmani, Z. Ul-Haq, J. B. Fernandes, S. S. Thomasi and A. G. Ferreira, RSC Adv., 2015, 5, 23431–23442 RSC.
- D. M. Dias, J. P. G. L. M. Rodrigues, N. S. Domingues, A. M. J. J. Bonvin and M. M. C. A. Castro, Eur. J. Inorg. Chem., 2013, 2013, 4619–4627 CrossRef CAS.
- L. Zhao, J. Liu, R. Guo, Q. Sun, H. Yang and H. Li, RSC Adv., 2017, 7, 27796–27806 RSC.
- P. Yadav, J. K. Yadav, A. Agarwal and S. K. Awasthi, RSC Adv., 2019, 9, 31969–31978 RSC.
- D. Wu, R. Duan, F. Geng, X. Hu, N. Gan and H. Li, Food Chem., 2019, 284, 180–187 CrossRef CAS.
- L. A. MacManus-Spencer, M. L. Tse, P. C. Hebert, H. N. Bischel and R. G. Luthy, Anal. Chem., 2010, 82, 974–981 CrossRef CAS.
- J. R. Lakowicz, Principles of fluorescence spectroscopy, Springer, New York, 3rd edn, 2006 Search PubMed.
- Y. Xiao, P. X. Qi and E. D. Wickham, Food Hydrocolloids, 2018, 83, 61–71 CrossRef CAS.
- T. Haselhorst, A.-C. Lamerz and M. von Itzstein, Methods Mol. Biol., 2009, 534, 375–386 CAS.
- J. Angulo, I. Díaz, J. J. Reina, G. Tabarani, F. Fieschi, J. Rojo and P. M. Nieto, ChemBioChem, 2008, 9, 2225–2227 CrossRef CAS.
- B. Meyer and T. Peters, Angew. Chem., Int. Ed., 2003, 42, 864–890 CrossRef CAS.
- J. Angulo, P. M. Enríquez-Navas and P. M. Nieto, Chem.–Eur. J., 2010, 16, 7803–7812 CrossRef CAS.
- J. Ghuman, P. A. Zunszain, I. Petitpas, A. A. Bhattacharya, M. Otagiri and S. Curry, J. Mol. Biol., 2005, 353, 38–52 CrossRef CAS.
- G. Sudlow, D. Birkett and D. Wade, Mol. Pharmacol., 1975, 11, 824–832 CAS.
- G. Sudlow, D. Birkett and D. Wade, Mol. Pharmacol., 1976, 12, 1052–1061 CAS.
- F. Zsila, Mol. Pharmaceutics, 2013, 10, 1668–1682 CrossRef CAS.
- M. Maciazek-Jurczyk, A. Sułkowska, B. Bojko, J. Równicka-Zubik and W. W. Sułkowski, Spectrochim. Acta A, 2009, 74, 1–9 CrossRef CAS.
- S. Beychok, Proc. Natl. Acad. Sci. U. S. A., 1965, 53, 999–1006 CrossRef CAS.
- B. Ahmad, G. Muteeb, P. Alam, A. Varshney, N. Zaidi, M. Ishtikhar, G. Badr, M. H. Mahmoud and R. H. Khan, Int. J. Biol. Macromol., 2015, 75, 447–452 CrossRef CAS.
- Z. Beiranvand, F. Bani, A. Kakanejadifard, E. Laurini, M. Fermeglia, S. Pricl and M. Adeli, RSC Adv., 2016, 6, 11266–11277 RSC.
- N. Gan, Q. Sun, P. Tang, D. Wu, T. Xie, Y. Zhang and H. Li, Spectrochim. Acta A, 2019, 206, 126–134 CrossRef CAS.
- D. Wu, S. Mei, R. Duan, F. Geng, W. Wu, X. Li, L. Cheng and C. Wang, Food Chem., 2020, 303, 125407 CrossRef CAS.
- YASARA, Yet Another Scientific Artificial Reality Application, http://www.yasara.org/, 5 December 2019 Search PubMed.
- I. Aier, P. K. Varadwaj and U. Raj, Sci. Rep., 2016, 6, 34984 CrossRef CAS.
- M. Jia, B. Yang, Z. Li, H. Shen, X. Song and W. Gu, PLoS One, 2014, 9, e104311 CrossRef.
Footnote |
| † Electronic supplementary information (ESI) available: η(tsat) values for each ligand proton of MF for its interaction with HSA (Table S1). 3D diagram of amino acid residues that interact with MF (Fig. S1). See DOI: 10.1039/d0ra05844k |
|
| This journal is © The Royal Society of Chemistry 2020 |
Click here to see how this site uses Cookies. View our privacy policy here. 
 Open Access Article
 This Open Access Article is licensed under a Creative Commons Attribution-Non Commercial 3.0 Unported Licence
 *a,
Na Gana,
Yuanming Zhai
*a,
Na Gana,
Yuanming Zhai