
 Open Access Article
 This Open Access Article is licensed under a Creative Commons Attribution-Non Commercial 3.0 Unported Licence
Ratiometric electrochemical sensor for accurate detection of salicylic acid in leaves of living plants†
Lei Yangac,
Da Chenc,
Xiaodong Wanga,
Bin Luoa,
Cheng Wangab,
Guangheng Gaod,
Hongji Lie,
Aixue Li *ab and
Liping Chen*ab
*ab and
Liping Chen*ab
aBeijing Research Center for Information Technology in Agriculture, Beijing Academy of Agriculture and Forestry Sciences, Beijing 100097, China. E-mail: liax@nercita.org.cn; chenlp@nercita.org.cn
bSchool of Agricultural Equipment Engineering, Jiangsu University, Zhenjiang 212013, China
cCollege of Electronic and Information Engineering, Shandong University of Science and Technology, Qingdao 266590, China
dBiology Institute, Qilu University of Technology (Shandong Academy of Sciences), Key Laboratory for Biosensors of Shandong Province, Jinan 250353, China
eTianjin Key Laboratory of Organic Solar Cells and Photochemical Conversion, School of Chemistry and Chemical Engineering, Tianjin University of Technology, Tianjin 300384, China
First published on 23rd October 2020
Abstract
Detection of signal molecules in living plants is of great relevance for precision farming. In this work, to establish a more effective method for monitoring salicylic acid (SA) in the leaves of living plants, a ratiometric electrochemical sensor was fabricated based on a Cu metal–organic framework (Cu-MOF) and carbon black (CB) composite. The Cu-MOF and CB composite was used to catalyze SA oxidation. Ratiometric oxidation current peak intensities ISA/ICu-MOFs were used as the response signal for SA. ISA/ICu-MOFs linearly enhanced with the increase of SA concentration, together with low limits of detection (12.50 μM). Moreover, our sensor is fabricated on a screen-printed electrode (SPE), which is especially suitable for applying to the flat leaves of plants. Using this sensor, the SA level in the leaves of cucumber seedlings was monitored in vivo under salt stress. The proposed sensor is accurate, reliable and practical. This is the first report for developing a ratiometric electrochemical sensor for detecting SA in living plants. Our work can also provide a strategy for in vivo studies on the leaves of plants.
1. Introduction
The in vivo monitoring of qualitative and quantitative changes of key physiology parameters of plants will be of great importance for precision farming. Salicylic acid (SA) is a well-known phytohormone, which functions as a signal molecule in plant growth and developmental processes, such as photosynthesis, aging, and defense responses.1 Recently, in vivo detection of SA has aroused great interest.2–6 Among many in vivo methods, electrochemical sensors are convenient and suitable for in vivo application because of their high sensitivity, low cost, and ease of miniaturization and integration. For example, Sun et al.5 reported the in vivo detection of SA in the leaves of tomatoes by electrochemical devices based on paper. Hu et al.6 performed SA detection in vivo by a modified Pt microsensor in sunflower seedlings. However, it is still a great challenge to establish more effective methods for accurate and reliable SA detection in living plants.Recently, great effort has been made onto the developing of ratiometric electrochemical sensors. The ratiometric electrochemical sensors are based on two electroactive molecules which can produce distinguishable electrochemical signals. One signal is the reference signal, which can be used to correct the inherent system errors caused by environmental or personal factors.7,8 And the other signal takes a part in detecting analytes. Nowadays, ratiometric electrochemical sensors have demonstrated its unique characters of enhanced reproducibility and robustness in determination of many molecules including biological small molecules,9,10 metal ions,11,12 and proteins,13,14 etc. However, to date, few ratiometric electrochemical sensors has been developed for SA detection in living plants.
Recently, the Cu metal–organic frameworks (Cu-MOFs) have received extensive interest in view of their unique characters including particularly high surface area, uniform structured cavities, tunable pore size, and easy surface functionalization.15–17 Cu-MOFs have been used for constructing electrochemical sensors to detect glucose, hydrazine, nitrite, hemoglobin, ascorbic acid, H2O2, NADH, ethanol, etc.17–22 However, pure MOFs are still limited in fabricating electrochemical sensors because they suffer from some intrinsic deficiency such as low stability in air and aqueous environment.23,24 An efficient resolution for this problem is to combine MOFs with other functional materials. Carbon materials are good partners for this purpose. For example, graphite oxide was incorporated into typical MOFs to enhance catalytic activity and hydrothermal stability.25 A Cu-BTC/MWCNTs composite was also synthesized, and the electrode fabricated by this composite showed good sensitivity for H2O2.26 Carbon black (CB) is a promising carbon nanomaterial. It has good conductivity, high surface area and porosity, and low cost.27,28 In order to develop a practical and low-cost sensor, CB was used to form a composite with Cu-MOFs and fabricate the electrode.
For in vivo application in plants, the detection parts mainly include roots, stems and leaves. As leaves are the main part of most plants, it is very important to develop sensors for in vivo studies in the plant leaves. Plant electrophysiologist have used ion-selective electrodes (ISEs) to detect the concentrations of some ions, such as Ca2+.29 This kind of electrode was placed outside of the leaves for non-destructive detection based on the voltage difference between two points. But this kind of electrode can't be used for detecting SA. For detecting SA in the leaves by electrochemical sensors, the electrode should be inserted in the leaves or the leaves should be destructed for SA release and connected to the electrode. Most plants have flat leaves, traditional needle or column electrodes are difficult to be inserted into the leaves for some in vivo studies. Screen-printed electrodes (SPEs) are suitable to make practical and low-cost sensors which can give reproducible results in biochemical detection. Its flat shape fits well with the flat leaves of some plants. Therefore, our sensor was fabricated on SPE electrode. In our work, the sensors were constructed by immobilizing Cu-MOFs/CB nanocomposites onto SPE electrodes. The ISA/ICu-MOFs was used as the response signal to develop ratiometric electrochemical sensor. The sensor showed high accuracy and reliability. For the practical application, the cucumber seedling was used as a model. As far as we know, this is the first ratiometric electrochemical sensor for detecting SA in living plants. Our work can also give a strategy for in vivo studies in the leaves of plants (Scheme 1).
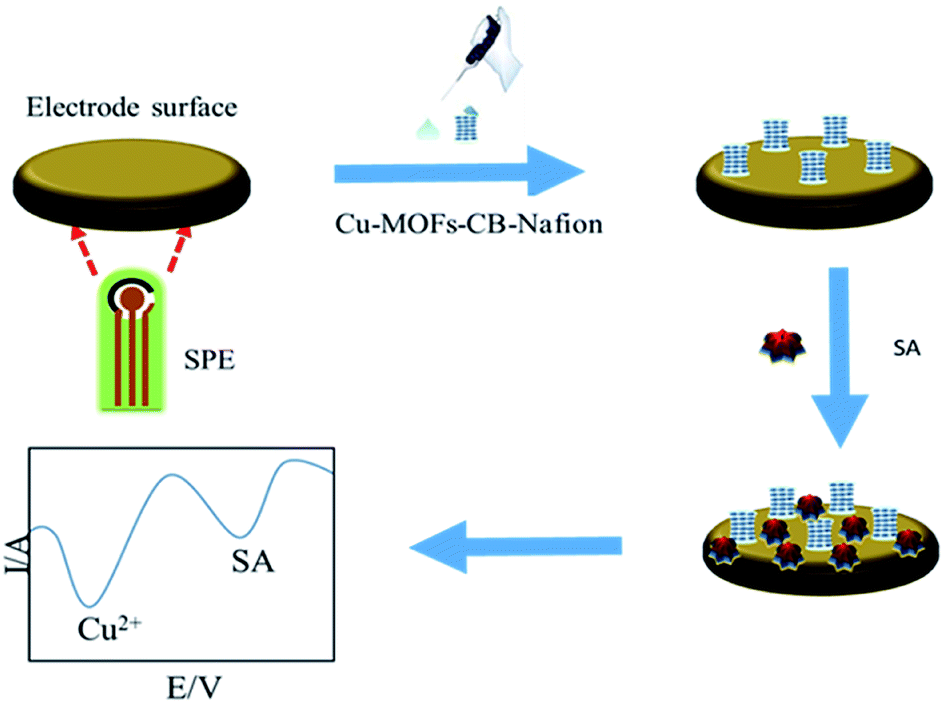 | ||
| Scheme 1 Schematic illustration of the fabrication process of the electrochemical ratiometric sensor of SA. | ||
2. Experimental section
2.1. Reagents and materials
Salicylic acid (SA), copper(II) nitrate hexahydrate, polyvinyl pyrrolidone (PVP), 2-amino terephthalic acid (NH2-BDC), nafion, tris(hydroxymethyl) methyl aminomethane (THAM), N,N-dimethylformamide (DMF), indole-3-acetic acid (IAA), citric acid (CA), jasmonic acid (JA), abscisic acid (ABA) and gibberellin (GAs) were purchased from Sigma-Aldrich (Germany). CB (VXC72R) was supplied by Cabot Chemical (Tianjin, China) Co., Ltd. Hydrochloric acid (HCl), absolute ethanol was obtained from Beijing Chemical Works. Ultrapure water was used for the whole experiments.2.2. Synthesis of Cu-MOFs
Cu-MOFs were synthesized referring to the previous report15 with some modification. Briefly, 8 ml DMF and 8 ml ethanol were mixed firstly, and 0.40 g PVP was added into this mixture. Subsequently, 46.64 mg Cu (NO3)2·6H2O and 10.86 mg NH2-BDC were dissolved in 4 ml DMF. Then this DMF solution was added into the above mixture with ultrasonication for 15 min. The solution was heated at 100 °C for 5 h. After that, the obtained precipitate was dissolved by adding 40 ml DMF. The solution was heated at 100 °C for 8 h. Finally, the Cu-MOFs were obtained by centrifuging and drying naturally.2.3. Characterization
A FESEM system (ZEISS, SEM 500, Germany) equipped with an EDS microprobe was used for investigating the morphologies of Cu-MOFs and the different modified SPE electrodes. Glassy carbon sheets with diameter of 5 mm were applied for the characterization.2.4. Electrochemical measurements
The SPE electrode was obtained from Ningbo Mxense Bio-Tech Co., Ltd. The disposable electrodes contained Ag/AgCl reference, carbon counter, and carbon working electrodes. The diameter of the working electrode is 2.5 mm. It was rinsed by ultrapure water. Then it was activated by applying a potential of 1.7 V for 180 s. Cu-MOFs and CB were dissolved in 2 ml deionized water. Then 5 μl nafion (0.01%) was added. The mass ratio of Cu-MOFs and CB (1![[thin space (1/6-em)]](https://www.rsc.org/images/entities/char_2009.gif) :3, 1:2, 1:1, 2:1, 3:1) were optimized (Cu-MOFs:CB = 1:3, 0.75 mg ml−1 Cu-MOFs, 2.25 mg ml−1 CB; Cu-MOFs:CB = 1:2, 1 mg ml−1 Cu-MOFs, 2 mg ml−1 CB; Cu-MOFs:CB = 1:1, 1.5 mg ml−1 Cu-MOFs, 1.5 mg ml−1 CB; Cu-MOFs:CB = 2:1, 2 mg ml−1 Cu-MOFs, 1 mg ml−1 CB; Cu-MOFs:CB = 3:1, 2.25 mg ml−1 Cu-MOFs, 0.75 mg ml−1 CB). After ultrasonicating for 30 min, the composite of Cu-MOFs-CB-nafion was got. 4 μl of Cu-MOFs-CB-nafion solution was used to modify the working electrode. The effect of different buffer, including Tris–HCl, PBS, PB, Na2HPO4–citric acid, KH2PO4–NaOH on the electrochemical performance of the Cu-MOFs-CB-nafion/SPE electrode was also investigated. The buffer recipes can be found in the ESI.† Cu-MOFs-nafion/SPE and CB-nafion/SPE electrode were also prepared for control.
:3, 1:2, 1:1, 2:1, 3:1) were optimized (Cu-MOFs:CB = 1:3, 0.75 mg ml−1 Cu-MOFs, 2.25 mg ml−1 CB; Cu-MOFs:CB = 1:2, 1 mg ml−1 Cu-MOFs, 2 mg ml−1 CB; Cu-MOFs:CB = 1:1, 1.5 mg ml−1 Cu-MOFs, 1.5 mg ml−1 CB; Cu-MOFs:CB = 2:1, 2 mg ml−1 Cu-MOFs, 1 mg ml−1 CB; Cu-MOFs:CB = 3:1, 2.25 mg ml−1 Cu-MOFs, 0.75 mg ml−1 CB). After ultrasonicating for 30 min, the composite of Cu-MOFs-CB-nafion was got. 4 μl of Cu-MOFs-CB-nafion solution was used to modify the working electrode. The effect of different buffer, including Tris–HCl, PBS, PB, Na2HPO4–citric acid, KH2PO4–NaOH on the electrochemical performance of the Cu-MOFs-CB-nafion/SPE electrode was also investigated. The buffer recipes can be found in the ESI.† Cu-MOFs-nafion/SPE and CB-nafion/SPE electrode were also prepared for control.
A CHI 760 electrochemical working station (Chenhua Instruments Co., Shanghai, China) was applied for the electrochemical experiments. Differential pulse voltammetry (DPV) measurements were conducted from −1.0 V to 1.5 V with a scan rate of 0.1 V s−1, and the parameters were: 0.02 s of pulse width, 0.02 V of increasing potential, 1 s of pulse period, 0.02 s of sampling width, and 0.05 V of amplitude.
2.5. In vivo test of SA in cucumber seedlings
One month old of cucumber seedlings (Zhongnong 26), which were planted in nutritious soil, were kindly supplied by Vegetable Research Center of Beijing Academy of Agricultural and Forestry Sciences. Then the seedlings were randomly divided into two groups (10 in each group). The two groups were respectively irrigated with 150 ml Hoagland solution which contained 0 and 200 mM of NaCl. After 12 h, the seedlings were used for electrochemical and UPLC-MS measurements.For the in vivo test, a puncture needle was used to punch the leaves of the cucumber seedlings to obtain a hole for release and detection of SA. The working electrode of the SPE was attached to the hole tightly by adhesive tape. 20 μl of Tris–HCl buffer was dropped into the hole for the electrochemical measurement. For different leaves, the electrodes were placed approximately the same site as possible.
2.6. Liquid chromatography-mass spectrometry (UPLC-MS) tests
The UPLC-MS tests were conducted according to our previous reports.6,30 Briefly, the fresh leaves of the cucumber seedlings of the two groups were respectively collected. After grinding, the sample (100 mg) was added with 1 ml precooled methanol, and it was placed at 4 °C for a whole night. Then the extract was added 1 ml CHCl3. After centrifuging, the underlying liquid was collected and dried. Then it was dissolved with methanol and filtrated by microporous membrane (0.22 mm).3. Results and discussion
3.1. Characterization of the modified electrodes
The morphology of the synthetized Cu-MOFs was characterized by SEM. The size of Cu-MOFs was about 2–3 μm, and they showed well-formed univalent hyperboloid structure which accumulated by single layer structure with large surface area (Fig. 1A). Fig. 1B–D showed the morphologies of different modified electrodes. As for the bare GC electrode, the surface was relatively smooth (Fig. 1B). After modified the electrode with Cu-MOFs-nafion, amorphous sheets with large surface area were covered on the surface of the electrode (Fig. 1C), indicating that Cu-MOFs-nafion was modified on the electrode. When modified the electrode with CB-nafion solution, the CB particles tended to aggregate into dense porous structures (Fig. 1D). When modified the electrode with Cu-MOFs-CB-nafion solution, a rough, porous structure were formed (Fig. 1E), which could increase the effective area of the electrode significantly. SEM data confirmed that the fabrication of the electrode was successful. For the EDS result of the Cu-MOFs-CB-nafion/SPE electrode (Fig. 1F), elements of C, O, N, Cu, F, S were observed. The glassy carbon sheets, Cu-MOFs and CB are all contained the C element, resulting in the appearance of C. The appearance of O and N elements were due to the BDC ligand of the Cu-MOFs. The observation of Cu element could be ascribed to the Cu(II) ions of the Cu-MOFs. Nafion contains F and S elements, which led to the appearance of F and S elements. This result confirmed that the Cu-MOFs-CB-nafion layer was modified on the SPE electrode successfully.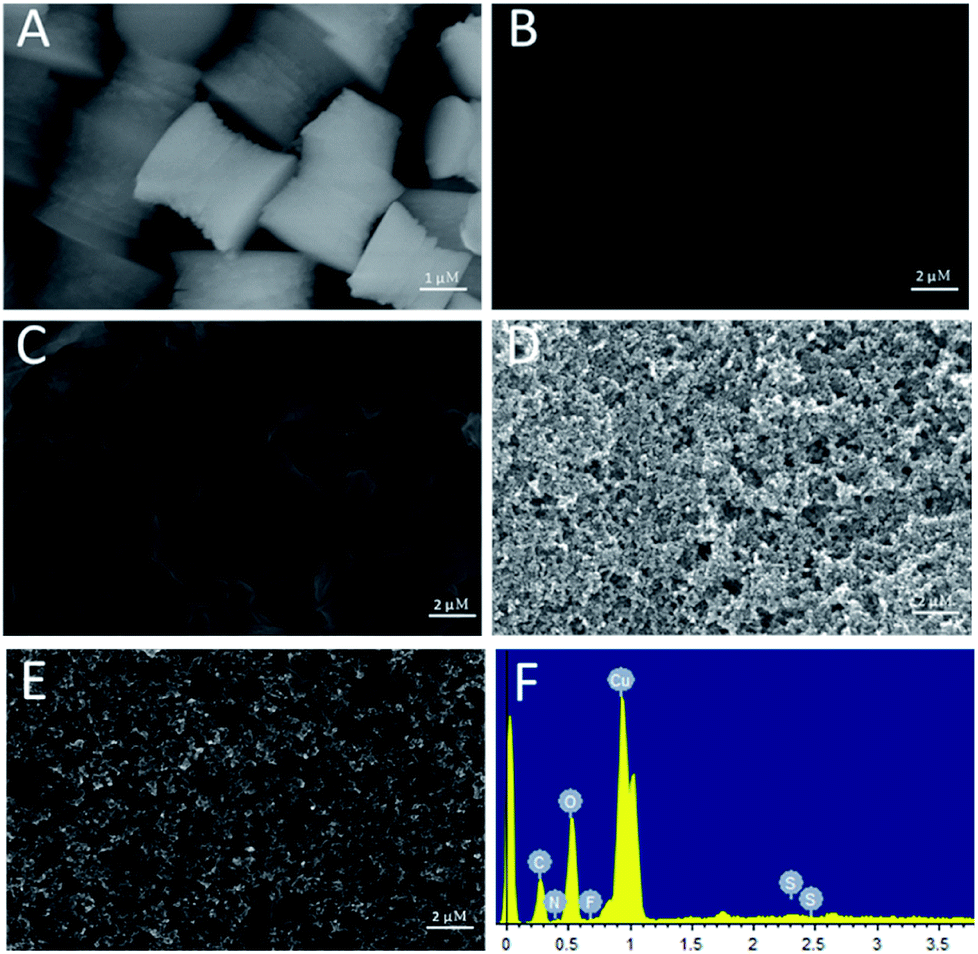 | ||
| Fig. 1 SEM images of Cu-MOFs (A), bare SPE (B), Cu-MOFs-nafion/SPE (C), CB-nafion/SPE (D), and Cu-MOFs-CB-nafion/SPE (E). (F) is the EDS image of Cu-MOFs-CB-nafion/SPE. | ||
3.2. The catalytic performance of the Cu-MOFs-CB-nafion/SPE electrode for SA
The electrocatalytic activity of bare SPE electrode, Cu-MOFs-nafion/SPE electrode, CB-nafion/SPE electrode and Cu-MOFs-CB-nafion/SPE to SA was investigated by DPV. As shown in Fig. 2a, the bare SPE electrode showed a weak redox peak of SA at about 0.75 V in the presence of 400 μM SA. The catalytic ability of Cu-MOFs-nafion/SPE electrode for SA was significantly improved than the bare SPE electrode (Fig. 2b and 3 mg ml−1 Cu-MOFs was used), suggesting that Cu-MOFs could effectively promote the oxidation of SA, which may due to their unique characters such as the large surface areas, ordered pore structure and multiple coordination sites, etc. Another redox peak was also observed at about −0.15 V, which was due to the oxidation of Cu2+ in Cu-MOFs. The redox peak of Cu-MOFs reduced significantly in the presence of SA than that of in the absence of SA (Fig. S1†), suggesting that the Cu-MOFs catalyzed the oxidation of SA to transform Cu2+ into Cu+ and the oxidation peak of Cu2+ was reduced in the presence of SA accordingly. The oxidation peaks of Cu2+ and SA are separated by ∼900 mV, indicating that the oxidation of Cu2+ and SA in this sensor system can be measured simultaneously without mutual interference. Therefore, the ISA/ICu-MOFs can be used as the response signal for developing ratiometric sensor for SA. The catalytic ability of CB-nafion/SPE electrode (3 mg ml−1 CB was used) for SA was similar to that of Cu-MOFs-nafion/SPE (Fig. 2c), which may be due to that CB has high surface to area ratio and good conductivity. As for the Cu-MOFs-CB-nafion/SPE electrode (Fig. 2d, Cu-MOFs:CB = 2:1, 2 mg ml−1 Cu-MOFs, 1 mg ml−1 CB), the redox peak of SA was slightly decreased compared with that of Cu-MOFs-nafion/SPE and CB-nafion/SPE. However, the redox peak of Cu-MOFs of the Cu-MOFs-CB-nafion/SPE also greatly reduced compared with that of Cu-MOFs-nafion/SPE, resulting in a significant increase in the value of ISA/ICu-MOFs (the value of ISA/ICu-MOFs of Cu-MOFs-CB-nafion/SPE is 0.151 ± 0.0032, and the value of ISA/ICu-MOFs of Cu-MOFs-nafion/SPE is 0.068 ± 0.0021). This result may be due to that there is a synergy effect for the Cu-MOFs and CB, resulting in the change of the electrochemical properties of the electrode. This change has a significant impact on the redox of Cu-MOFs, which was mainly due to that the mass of Cu-MOFs was reduced by one-third for the Cu-MOFs-CB-nafion/SPE electrode. But it has little effect on the redox of SA, as both Cu-MOF and CB has similar catalytic properties for SA. Therefore, the Cu-MOFs-CB-nafion/SPE electrode was used for the construction of the ratiometric sensor for SA in the following experiments.
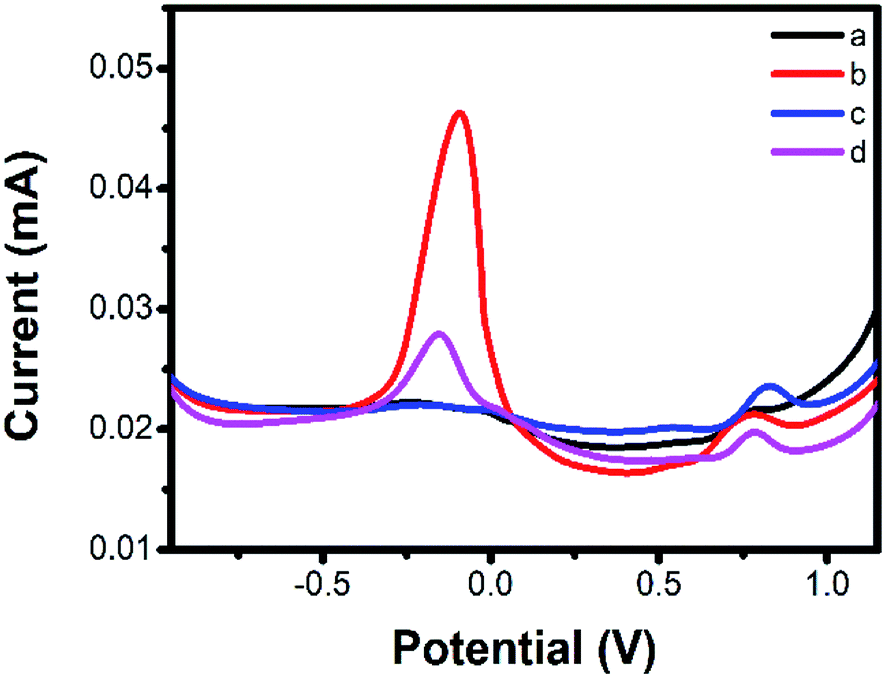 | ||
| Fig. 2 DPV curves of bare SPE (a), Cu-MOFs-nafion/SPE (b), CB-nafion/SPE (c), Cu-MOFs-CB-nafion/SPE (d) in 400 μM SA. | ||
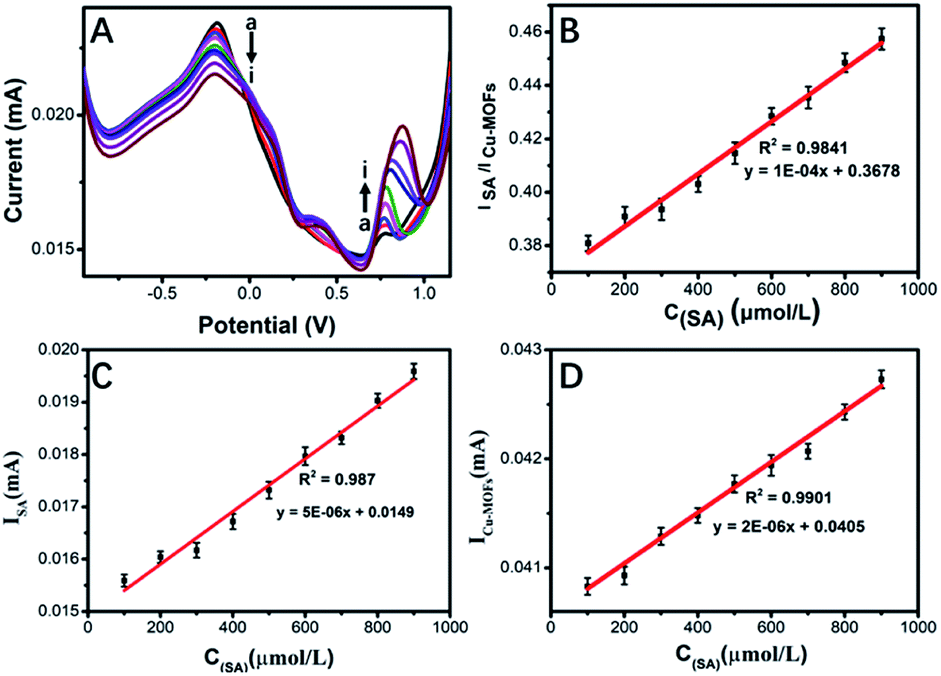 | ||
| Fig. 3 DPV responses of Cu-MOFs-CB-nafion/SPE electrode in 0.05 M Tris–HCl buffer (pH 7.0) toward different SA concentration (A). The calibration curves between ISA/ICu-MOFs (B), ISA (C) and ICu-MOFs (D) with the concentrations of SA. | ||
3.3. Optimization of the experimental conditions
The experimental conditions, such as the mass ratio of Cu-MOFs and CB, concentration of buffer and types of buffer, were optimized to get a more sensitive biosensor. As shown in Fig. S2A,† the effect of five different mass ratios of Cu-MOFs and CB on the electrochemical performance of the Cu-MOFs-CB-nafion/SPE was investigated. When the mass ratio increased from 1:3 to 2:1, the ratio of ISA/ICu-MOFs (in the presence of 400 μM SA) increased significantly. When the ratio increased further, the ratio of ISA/ICu-MOFs decreased, indicating the optimal mass ratio of Cu-MOFs and CB was 2:1. The effect of different buffer on the electrochemical performance of the Cu-MOFs-CB-nafion/SPE electrode was investigated. From Fig. S2B,† the ratio of ISA/ICu-MOFs was the highest using Tris–HCl buffer. The ratio of ISA/ICu-MOFs was the lowest when PBS buffer was used. The response of the other three buffers was between Tris–HCl and PBS. So Tris–HCl buffer was selected for the following test. The concentration of Tris–HCl buffer was also optimized. From Fig. S2C,† the ratio of ISA/ICu-MOFs was the highest in 0.05 M Tris–HCl buffer and fell drastically when the concentrations of Tris–HCl buffer increased to 0.1 M. The ratio of ISA/ICu-MOFs decreased further when the concentrations of Tris–HCl buffer increased further. So 0.05 M Tris–HCl buffer was applied in the following measurements.
3.4. Performance of the Cu-MOFs-CB-nafion/SPE electrode for detecting SA
The performance of the prepared Cu-MOFs-CB-nafion/SPE for detection of SA was investigated. The peak current of SA increased and the peak current of Cu-MOFs decreased correspondingly with the increasing concentrations of SA (Fig. 3A). There is a linear relationship between the ratio of ISA/ICu-MOFs and SA concentration in the range of 100–900 μM. The linear equation was y = 1 × 10⁻⁴x + 0.3678 (R2 = 0.9841) (Fig. 3B), the LOD of the ratiometric sensor for SA was 12.50 μM.Furthermore, there is also a linear relationship between the peak current of SA and SA concentration in the range of 100–900 μM. Its equation was y = 5 × 10⁻⁴x + 0.0149 (R2 = 0.9870) (Fig. 3C). And the peak current of Cu-MOFs is linear with SA in the same concentration range. Its equation was y = 2 × 10⁻⁴x + 0.0405 (R2 = 0.9901) (Fig. 3D). The linear fitting slope of the ratiometric sensor was significantly improved compared with that of Fig. 3C and D, suggesting the sensitivity of the sensor can be improved by the double signal output greatly. Compared with some other electrochemical sensors of SA summarized in Table 1,1,31–36 although the LOD of our sensor was not lower than other sensors, the detection range of our sensor was wider than that of most sensors, and it can cover a large part of concentration range of SA in most plants, which is in the range of nM to mM.37 More importantly, it is accurate, reliable and practical. Therefore, the performance of the proposed ratiometric electrochemical biosensor is acceptable.
| Electrode | Method | Linear range/μM | LOD/μM | References |
|---|---|---|---|---|
| Multiwalled carbon nanotubes-chitosan modified glassy carbon electrode | DPV | 0.67–48.82 | 0.1 | 31 |
| Modified CB-MWNT-nafion/Fc/CBMWNT/GC electrode | DPV | 25.0–1000 | 3.3 | 32 |
| Carbon tape modified electrode | DPV | 1–100 | 0.1 | 33 |
| Pt nanoparticles modified Pt disk electrode | I–T | 20–500 | 6.4 | 1 |
| Nickel titanate nanoceramic modified carbon paste electrode | DPV | 3.0–40.0, 40.0–1000.0 | 0.068 | 34 |
| Screen printed electrodes | SWV | 16–300 | 5.6 | 35 |
| Pencil trace modified carbon tape electrode | SWV | 0.1–100 | 0.1 | 36 |
| Cu-MOFs-CB-nafion/SPE electrode | DPV | 100–900 | 12.5 | This work |
The influence of common interfering species on the detection of SA was examined. Fig. 4 showed the DPV response of the Cu-MOFs-CB-nafion/SPE electrode in presence of 400 μM IAA, ABA, MeJA, GA, CA, SA and mix of all the chemicals. The ISA/ICu-MOFs signal of the sensor in the presence of SA was tremendously higher than that of in the presence of other interfering species. The inset in Fig. 4 showed a typical voltammogram for each of the interfering compounds measured. The characteristic peak of SA appeared at 0.75 V. One or more characteristic peaks were found for other interferences, which are all different from that of SA. These results suggested that our sensor possessed high selectivity. In presence of 400 μM SA, the RSD was 5.6% for 6 different Cu-MOFs-CB-nafion/SPE. 87% sensing ability was remained after the sensor was stored at 4 °C for two weeks (Fig. S3†), suggesting the sensor had high stability.
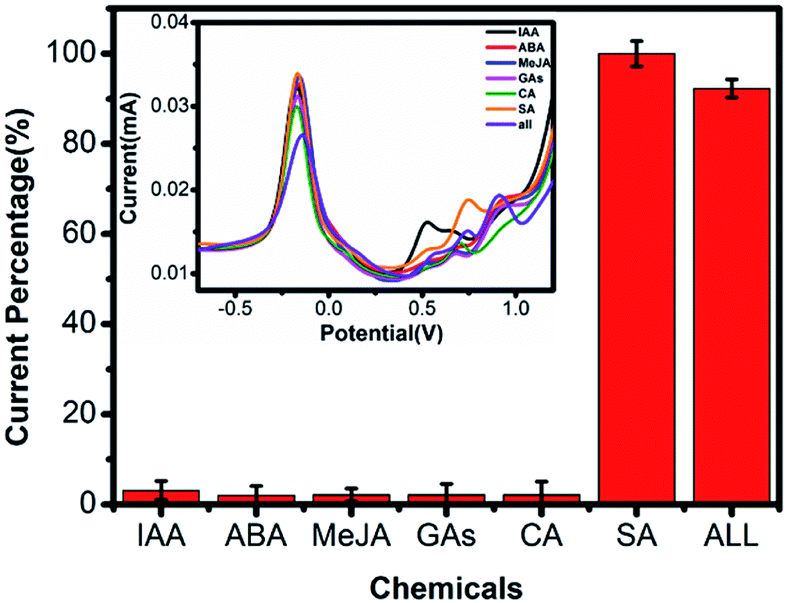 | ||
| Fig. 4 DPV responses of Cu-MOFs-CB-nafion/SPE electrode to different chemicals: IAA, ABA, MeJA, GA, CA, SA and all the chemicals in 0.05 M Tris–HCl (pH 7.0). The concentrations of all the chemicals are 400 μM. | ||
3.5. Detection of SA in vivo in cucumber seedlings
It has been reported that SA plays a critical role in mediating plants resistance to salt stress.38 In our work, the prepared Cu-MOFs-CB-nafion/SPE electrode was applied to detect the SA concentration of cucumber seedlings leaves in vivo under different NaCl treatment. The leaves of cucumber seedlings are flat, which is difficult to be studied in vivo using traditional needle or column electrodes. However, the modified SPE electrode is very suitable for this application. Fig. S4† showed the photo for the detection. As shown in Table 2, the concentrations of SA in the leaves of cucumber seedlings were 140.55 ± 2.74 μM and 174.06 ± 4.35 μM for 0 mM and 200 mM of salt stress, respectively. This result suggested that the SA level increased in the leaves of cucumber seedlings under 200 mM of salt stress, which may be due to its important role in the induction of systemic acquired resistance against biotic and abiotic stresses.39,40 A similar trend was obtained by the UPLC-MS (Table 2), confirming the reliability of the developed ratiometric sensor. Compared with the traditional technologies, the information obtained by our sensor can better reflect the actual situation of plants. For some traditional methods, the plant samples need to undergo complex preprocessing, such as grinding, centrifugation, extraction and so on. This process often causes great damage to plants and loses some biological information. For detecting SA in vivo by sensors, a small hole should be opened in the leaves of the cucumber seedlings, and then the releasing SA can be directly detected by the sensor, which can provide more instant and accurate information of the levels of SA. This difference may explain the discrepancy between the results obtained with HPLC and our sensor. Our proposed sensor is simple, accurate, reliable and practical. The diameter of the punched hole in the leaves is only 1 mm, so the influences on the following plants growth can be neglected.| NaCl concentrations (mM) | HPLC (μM) | SA sensor (μM) | Relative deviation (%) |
|---|---|---|---|
| 0 | 128.27 ± 4.61 | 140.55 ± 2.74 | 5.1% |
| 200 | 165.38 ± 3.80 | 174.06 ± 4.35 | 8.12% |
4. Conclusions
In summary, a ratiometric electrochemical sensor for detection of SA in the leaves of living plants was developed on SPE electrode based on Cu-MOFs/CB composite. The Cu-MOFs and CB were used to catalyze SA oxidation. The ISA/ICu-MOFs was used as the response signal for SA detection. The fabricated ratiometric sensor is accurate, reliable and practical. Using this sensor, the SA level in the leaves of cucumber seedlings was successfully detected in vivo. This work offers a new platform for detecting phytohormones by ratiometric electrochemical sensors. Our work can also give a strategy for in vivo studies for the leaves of plants.Conflicts of interest
There are no conflicts to declare.Acknowledgements
The authors are thankful for the fundings from Key-Area Research and Development Program of GuangDong Province (No. 2019B020219002), the National Natural Science Foundation of China (Grant No. 21974012), Beijing Municipal Natural Science Foundation (No. 2182022).References
- Z. Wang, F. Ai, Q. Xu, Q. Yang, J. H. Yu, W. H. Huang and Y. D. Zhao, Colloids Surf., B, 2010, 76, 370–374 CrossRef CAS.
- P. J. Tseng, C. Y. Wang, T. Y. Huang, Y. Y. Chuang, S. F. Fu and Y. W. Lin, Anal. Methods, 2014, 6, 1759–1765 RSC.
- W. Huang, L. Huang, G. Preston, M. Naylor, J. Carr, Y. Li, A. Singer, A. Whiteley and H. Wang, Plant J., 2010, 46, 1073–1083 CrossRef.
- M. I. Gonzálezsánchez, P. T. Lee, R. H. Guy and R. G. Compton, Chem. Commun., 2015, 51, 16534–16536 RSC.
- L. Sun, Q. Feng, Y. Yan, Z. Pan, X. Li, F. Song, H. Yang, J. Xu, N. Bao and H. Gu, Biosens. Bioelectron., 2014, 60, 154–160 CrossRef CAS.
- Y. Hu, J. Zhao, H. Li, X. Wang, P. Hou, C. Wang, A. Li and L. Chen, RSC Adv., 2018, 8, 23404–23410 RSC.
- X. Cai, S. Weng, R. Guo, L. Lin, W. Chen, Z. Zheng, Z. Huang and X. Lin, Biosens. Bioelectron., 2016, 81, 173–180 CrossRef CAS.
- E. Xiong, L. Wu, J. Zhou, P. Yu, X. Zhang and J. Chen, Anal. Chim. Acta, 2015, 853, 242–248 CrossRef CAS.
- C. Deng, X. Pi, P. Qian, X. Chen, W. Wu and J. Xiang, Anal. Chem., 2017, 89, 966–973 CrossRef CAS.
- L. Wang, C. Gong, Y. Shen, W. Ye, M. Xu and Y. Song, Sens. Actuators, B, 2017, 242, 625–631 CrossRef CAS.
- J. Jia, H. G. Chen, J. Feng, J. L. Lei, H. Q. Luo and N. B. Li, Anal. Chim. Acta, 2016, 908, 95–101 CrossRef CAS.
- Y. Luo, L. Zhang, W. Liu, Y. Yu and Y. Tian, Angew. Chem., Int. Ed., 2015, 54, 14053–14056 CrossRef CAS.
- D. Yao, W. Zhao, L. Zhang and Y. Tian, Analyst, 2017, 142, 4215–4220 RSC.
- H. Zhao, R. Liang, J. Wang and J. Qiu, Chem. Commun., 2015, 51, 12669–12672 RSC.
- W. Shen, Y. Zhuo, Y. Chai and R. Yuan, Anal. Chem., 2015, 87, 11345–11352 CrossRef CAS.
- J. Ma, S. Wang, C. Zhao, Y. Yu and Y. Dong, Chem. Mater., 2015, 27, 3805–3808 CrossRef CAS.
- W. Meng, S. Xu, L. Dai, Y. Li, J. Zhu and L. Wang, Electrochim. Acta, 2017, 230, 324–332 CrossRef CAS.
- Y. Zhang, X. Bo, C. Luhana, H. Wang, M. Li and L. Guo, Chem. Commun., 2013, 49, 6885–6887 RSC.
- M. Saraf, R. Rajak and S. M. Mobin, J. Mater. Chem. A, 2016, 4, 16432–16445 RSC.
- J. Zhou, X. Li, L. Yang, S. Yan, M. Wang, D. Cheng, Q. Chen, Y. Dong, P. Liu, W. Cai and C. Zhang, Anal. Chim. Acta, 2015, 899, 57–65 CrossRef CAS.
- N. Travlou, K. Singh, E. Rodriguez-Castellon and T. Bandosz, J. Mater. Chem. A, 2015, 3, 11417–11429 RSC.
- H. Hosseini, H. Ahmar, A. Dehghani, A. Bagheri, A. Fakhari and M. A mini, Electrochim. Acta, 2013, 88, 301–309 CrossRef CAS.
- X. Wang, Q. Wang, Q. Wang, F. Gao, F. Gao, Y. Yang and H. Guo, ACS Appl. Mater. Interfaces, 2014, 6, 11573–11580 CrossRef CAS.
- A. Morozan and F. Jaouen, Energy Environ. Sci., 2012, 5, 9269–9290 RSC.
- D.-D. Zu, L. Lu, X.-Q. Liu, D.-Y. Zhang and L.-B. Sun, J. Phys. Chem. C, 2014, 118, 19910–19917 CrossRef CAS.
- E. Zhou, Y. Zhang, Y. Li and X. He, Electroanalysis, 2014, 26, 2526–2533 CrossRef CAS.
- T. Miyake, K. Haneda, N. Nagai, Y. Yatagawa, H. Onami, S. Yoshino, T. Abe and M. Nishizawa, Energy Environ. Sci., 2011, 4, 5008–5012 RSC.
- J.-S. Lee, G. S. Park, H. I. Lee, S. T. Kim, R. Cao, M. Liu and J. Cho, Nano Lett., 2011, 11, 5362–5366 CrossRef CAS.
- L. Yan, M. Jingjing and Y. Sha, et al., Front. Plant Sci., 2017, 8, 1241 CrossRef.
- H. Li, C. Wang, X. Wang, P. Hou, B. Luo and P. Song, et al., Biosens. Bioelectron., 2019, 126, 193–199 CrossRef CAS.
- L. Sun, X. Liu, L. Gao, Y. Lu, Y. Li and Z. Pan, et al., Anal. Lett., 2015, 48, 1578–1592 CrossRef CAS.
- Y. Hu, X. Wang, C. Wang, P. Hou, H. Dong, B. Luo and A. Li, RSC Adv., 2020, 10, 3115–3121 RSC.
- L. Sun, J. Zhou, J. Pan, Y. Liang, Z. Fang and Y. Xie, et al., Sens. Actuators, B, 2018, 276, 545–551 CrossRef CAS.
- S. M. Ghoreishi, F. Z. Kashani, A. Khoobi and M. Enhessari, J. Mol. Liq., 2015, 211, 970–980 CrossRef CAS.
- S. Rawlinson, A. McLister, P. Kanyong and J. Davis, Microchem. J., 2018, 137, 71–77 CrossRef CAS.
- H. Wang, X. Bi, Z. Fang, H. Yang, H. Gu and L. Sun, et al., Sens. Actuators, B, 2019, 286, 104–110 CrossRef CAS.
- S. Hayat, A. Ahmad and M. N. Alyemeni, Salicylic acid: plant growth and development, Springer, Netherlands, 2013 Search PubMed.
- C. An, Z. Mou and J. Integr, Plant Biol., 2011, 53, 412–428 CAS.
- S. Hayat, M. Irfan, A. S. Wani, A. Nasser and A. Ahmad, Plant Signaling Behav., 2012, 7, 93–102 CrossRef CAS.
- M. S. Jahan, Y. Wang, S. Shu, M. Zhong, Z. Chen, J. Wu, J. Sun and S. Guo, Sci. Hortic., 2019, 247, 421–429 CrossRef.
Footnote |
| † Electronic supplementary information (ESI) available. See DOI: 10.1039/d0ra05813k |
| This journal is © The Royal Society of Chemistry 2020 |