 Open Access Article
In silico decryption of serotonin–receptor binding: local non-covalent interactions and long-range conformational changes†
Padmabati Mondal *
*
Department of Chemistry and Center for Atomic, Molecular and Optical Sciences and Technologies, Indian Institute of Science Education and Research (IISER) Tirupati, Tirupati, 517507, Andhra Pradesh, India. E-mail: padmabati.mondal@iisertirupati.ac.in; Tel: +91 877 2500 926
First published on 14th October 2020
Abstract
Serotonin–receptor binding is the key step in the process behind serotonin functionality, including several psychological and physiological behaviours. This study is focused on identifying the main non-covalent interactions controlling the stability of serotonin–receptor complexes as well as the main conformational changes in the receptor due to serotonin–receptor binding using classical molecular dynamics simulations and quantum chemical calculations. A qualitative analysis based on two order parameters ((i) the centre of mass distance and (ii) the angle between the surface normals of each aromatic residue and serotonin in the binding site) on the serotonin–receptor complex trajectory suggests that the T-type stacking interaction is predominant in the binding site. Quantum chemical calculations of the stacking interaction energy provide the quantitative contributions of important aromatic residues to the stabilization of the complex. Furthermore, a three body stacking interaction (named ‘L’-type) was observed and likely contributes to the stability of the complex. Direct and water-mediated hydrogen bonding between the residues in the binding site and serotonin contributes to the complex stability. Principal component analysis of the molecular dynamics simulation trajectory of the serotonin–receptor complex and the apo-receptor in water indicates that the whole receptor is significantly stabilized due to serotonin binding. An analysis based on the dynamic cross correlation function reflects the strong correlation between trans-membrane (TM)3, TM5, TM6 (containing residues responsible for the stacking interaction and hydrogen bonding) and mini-G0 which may participate in signal transduction leading to the functionality of serotonin.
1 Introduction
Molecular recognition, the process where biological macromolecules interact with each other or with small molecules via noncovalent interactions to form complexes, lies at the heart of all biological processes.1,2 Proteins, an important class of biological macromolecules, interact with other proteins or small molecules (ligands) leading to protein functionality.2,3 A detailed understanding of the protein–ligand interactions is central to unraveling the mechanism of protein and drug functionality which is the key step towards computational drug/inhibitor discovery. Therefore, it is important to systematically decrypt the non-covalent protein–ligand interactions at the atomistic and electronic level which can only be achieved via computational studies. On the other hand, detection of mutational hotspots which induce the conformational changes (leading to signal transduction) is crucial in identifying the important part of the receptor involved in the functionality.The purpose of this work is two-fold. First, to develop a detailed general protocol via (i) decrypting protein–ligand interactions by looking into the binding site contributing to the stability of the complex and (ii) detecting the important residues/parts of the protein involved in allostery. The protocol can be applied to most protein–ligand complexes which rely on stacking interactions and hydrogen bonding interactions. Second, to detect and categorize the important residues and interactions contributing to the stability of serotonin–receptor interactions and the allosteric effects leading to several psychological behaviours.
Serotonin, known chemically as 5-hydroxy-tryptamine (5-HT), is the neurotransmitter responsible for diverse physiological and psychological functions in the human body.4–7 The functionality of serotonin is controlled upon binding to the serotonin receptor (often called the 5-HT receptor). The 5-HT receptor proteins can be grouped into seven subfamilies (5-HT1–7) depending on the signaling mechanism and sequence homology.8 Among them, all except 5-HT3 (which is a ligand-gated ion channel) are guanine nucleotide binding protein (G-protein)-coupled receptors (GPCRs) that are coupled to the G-protein via the mini-G0 region.8,9 These 5-HT receptors, depending on their presynaptic or postsynaptic position, can decrease or increase 5-HT secretion, leading to inhibited or accelerated action of 5-HT, respectively.10,11 The binding mechanism and the conformational changes of the serotonin–receptor complex due to binding are important in identifying the key factors involved in controlling the functionality.
Among the seven 5-HT receptors, the crystal structure is known only for the 5-HT1B and 5-HT2B receptors along with their agonist/antagonist.9,11 These two 5-HT receptors are structurally and functionally quite similar. Several studies have focused on the crystal structure determination and molecular recognition of the agonist- and antagonist-bound 5-HT receptors and their activation/deactivation effect, both experimentally and theoretically.9,11,12 But systematic atomic and subatomic-level decryptions of serotonin–receptor binding, which can be used as the basis of efficient drug design, are still scarce in the literature.
Non-covalent interactions play the key role in every protein–ligand binding mechanism.3,13 Among them, stacking, hydrogen bonding, halogen bonding, and n–π* interactions are the most common ones. In this work, qualitative detection of the main non-covalent interactions between serotonin and the 5-HT1B receptor and their quantitative contribution to the stability of the serotonin–receptor complex are investigated using molecular dynamics simulations and quantum chemical calculations, respectively. Furthermore, the main conformational changes in the receptor due to serotonin binding are also identified using coarse-grained analysis. The article is organised as follows: first the computational methodologies used for simulation and data analysis are described, then the results are provided and discussed, and finally the study is summarized.
2 Computational details
2.1 Simulation set up
The initial receptor structure was taken from the crystal structure of the methiothepin-bound 5-HT1B receptor (chain B), PDB ID: 5V54.9 To prepare the apo-receptor, the methiothepin bound to the 5-HT1B receptor is removed. To prepare the serotonin–receptor complex, the gas phase optimized structure (at the b3lyp/6-31g** level) of serotonin was docked to the 5-HT1B apo-receptor using SwissDock software.14 The most stable (protein–ligand binding free energy ≈ −9 kcal mol−1) and reasonable structure of the serotonin-bound 5-HT1B receptor was taken as the initial structure of the serotonin–receptor complex. Fig. 1 shows the G-protein coupled 5-HT1B receptor (green) bound to serotonin (in VDW representation) along with mini-G0 (orange) which is an important part of the G-protein. The 5-HT1B receptor consists of seven alpha helices named TM1–TM7 where TM stands for transmembrane. The apo-receptor and the complex were separately solvated in rectangular water boxes of volume 120 Å × 90 Å × 90 Å. The systems (apo-receptor and the complex) were then separately neutralized by Na+ and Cl− ions and energy minimization was performed using the steepest descent method. Both the apo-receptor and the complex were then equilibrated for 200 ps using the NVT ensemble and for 1 ns using the NPT ensemble. The production run was performed for 100 ns for each case. All simulations were performed using the GROMACS molecular dynamics simulation package.15 The CHARMM22/CMAP16,17 force fields implemented in GROMACS18 were used for the receptor protein. The force fields for serotonin were obtained from the CGENFF force field19 database which was included in the local CHARMM force field database of GROMACS for this work. While the analysis of the local non-covalent interactions was performed on the data over 35 ns simulation time, the coarse-grained analysis to identify the long timescale conformational changes and the allosteric correlation between different parts was performed for 100 ns simulation time. The reason for considering only 35 ns for the first case is that the local non-covalent interactions are statistically converged within a short (few ns) time scale.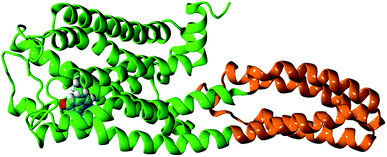 | ||
| Fig. 1 The structure of the G-protein coupled 5-HT1B receptor (green) bound to serotonin (in VDW representation) along with mini-G0 (orange). | ||
2.2 Methodologies to determine non-covalent interactions
First, to fix a reference for benchmarking the method and the basis set, gas phase interaction energies for each of the 5 pairs were calculated using domain-based local pair natural orbital methods combined with coupled-cluster singles and doubles (triples), known as DLPNO-CCSD(T),27 implemented in ORCA4.2 (ref. 28 and 29) with the aug-cc-pVTZ basis set in conjunction with the matching auxiliary basis set30 including the correction of basis set superposition errors.31 The DLPNO-CCSD(T) method provides a correlation energy almost as accurate as the one obtained using the CCSD(T) method (which is known as the gold standard of quantum chemistry) but at a reduced computational cost. The same calculations were done for the 5 sets from another random snapshot. The calculations were repeated for the same sets using the b3lyp functional32 with the 6-31g** basis set,33 the ωB97XD functional34 with the 6-31g** basis set and the MP2 method35 with the 6-31g** basis set using Gaussian09.36 For all 5 sets from both snapshots, the results from the ωB97XD/6-31g** level of theory provide the best match (within the error bar of ±0.4 kcal mol−1). Therefore, finally, the calculations of the interaction energy were done for 700 snapshots using the range-separated dispersion-corrected ωB97XD functional with the 6-31g** basis set using the counterpoise method which takes the basis set superposition error into account.31
2.3 Methodology for the determination of conformational changes
 | (1) |
In this work, to detect the main allosteric effect due to serotonin–receptor binding, a variant dynamic cross correlation analysis approach, named difference dynamic cross correlation (DDCC) analysis, is applied. In this approach, first the DCCs between all α carbons of the receptor were calculated for 10![[thin space (1/6-em)]](https://www.rsc.org/images/entities/char_2009.gif) 000 snapshots from a 100 ns trajectory for both the serotonin–receptor complex and the apo-receptor. After that, the DDCC was calculated by taking the difference in DCC between the complex and the apo-receptor for each of the α-carbons.
000 snapshots from a 100 ns trajectory for both the serotonin–receptor complex and the apo-receptor. After that, the DDCC was calculated by taking the difference in DCC between the complex and the apo-receptor for each of the α-carbons.
| DDCC(i,j) = DCC(i,j)complex − DCC(i,j)apo-receptor | (2) |
This approach renders it easier to detect the correlation of conformational changes which occurs exclusively due to serotonin–receptor binding.
3 Results and discussion
3.1 Serotonin–receptor local non-covalent interactions
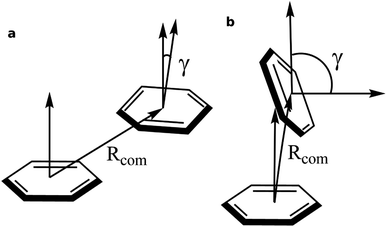
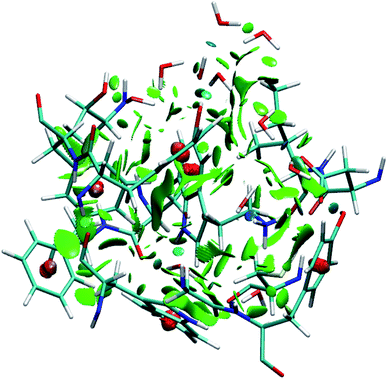
To identify the non-covalent interactions at the binding site, an NCI plot analysis was done, and all non-covalent interactions within 4 Å of serotonin are shown in Fig. 3 in a RGB color scale where red, green and blue colors represent the strong/repulsive, weak/attractive and strong/attractive interactions, respectively. This analysis provides the first indication that there are several weak/attractive (green) interactions between residue side chains and serotonin (stacking interactions) as well as strong/attractive (blue) interactions between the electron-donating and accepting groups (hydrogen bonding) including water. The role of stacking interactions and hydrogen bonding interactions in controlling the stability and structure–function relationship in biomolecules, e.g. protein–drug complexes and protein/drug–nucleic acid complexes, are well known in the literature.41–46 Therefore, a more detailed analysis of these interactions was performed.To obtain qualitative insight into the probable types of stacking interactions in the serotonin–receptor complex, an order parameter analysis is done which is based on the two order parameters described in the methodology section. This follows a similar approach to that reported by McGaughey et al.47 The criteria for the T-type and parallel stacking interactions are considered as follows: (i) Rcom: for off-set parallel stacking, 3 Å ≤ Rcom ≤ 5 Å and for T-type stacking, 5 Å ≤ Rcom ≤ 7.5 Å; (ii) γ: for T-type stacking interactions, γ ≈ 60–120° and for parallel stacking interactions, γ ≈ 0–30°. Here, it is to be noted that for an ideal static case γ should be 0° and 90° for parallel and T-type stacking, respectively. However, since this analysis is applied on the data obtained from molecular dynamics simulation, relaxed criteria have been adopted to take the statistical fluctuations into account.
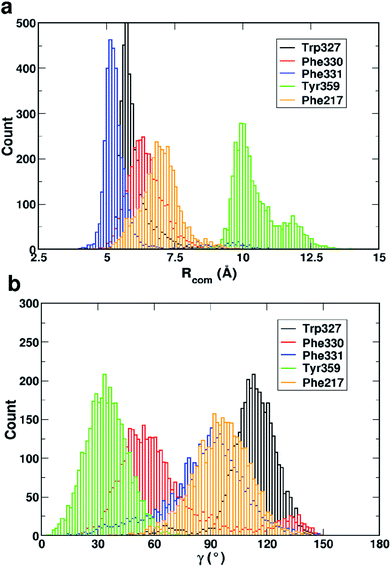
Fig. 4 shows that while the Rcom values for the residues Trp327, Phe330, Phe331 and Phe217 with serotonin lie in between 5–7.5 Å, the Rcom values for Tyr359 are distributed around a mean value of 10 Å which provides the first indication that Trp327, Phe330, Phe331 and Phe217 are likely to have T-type stacking interactions (following the criteria mentioned above) with serotonin. On the other hand, the position of Tyr359 is beyond the range of stacking interactions. Moreover, the narrower distribution (with higher probability count) of Rcom for Phe331 and Trp327 (around Rcom = 5 Å) indicates strong interactions with serotonin.
The distribution of the γ angle in Fig. 4 indicates that Trp327, Phe331 and Phe217 favour T-type stacking (60° < γ < 130°) with serotonin. However, for Tyr359 γ ranges between 0–60° and thus it does not contribute to T-type stacking interactions. On the other hand, Phe330 partially contributes to T-type stacking interactions. From both analyses it is clear that Trp327, Phe331, Phe330 and Phe217 are the four important aromatic residues in the binding site that likely contribute to the stability of the complex via T-type stacking interactions with serotonin.
3.1.1.1 Quantitative estimation of stacking interaction energy. For a quantitative estimation of the stacking interaction energy and the stabilization offered by the above mentioned residues, the gas phase interaction energies between the important residues and serotonin were calculated for 700 snapshots from the 35 ns trajectory using quantum chemical methods as described in the methodology section. The ab initio method and basis sets are benchmarked by comparing the results with the stacking interaction energy calculated using the DLPNO-CCSD(T)/aug-cc-pVTZ level of theory (see Table 1). Finally, the ωB97XD functional in combination with the 6-31g** basis set is chosen as the best method for the calculation.
| Method/functional | Basis set | ΔE327 | ΔE330 | ΔE331 | ΔE359 | ΔE217 |
|---|---|---|---|---|---|---|
| DLPNO-CCSD(T) | aug-cc-pVTZ (str. 1) | −6.38 | −6.61 | −3.80 | −2.94 | −0.06 |
| ωB97XD | 6-31g** (str. 1) | −6.35 | −6.46 | −3.74 | −2.50 | −0.21 |
| MP2 | 6-31g** (str. 1) | −4.36 | −4.51 | −2.39 | −1.85 | −0.19 |
| DLPNO-CCSD(T) | aug-cc-pVTZ (str. 2) | −5.20 | −3.47 | −4.32 | −0.81 | −1.43 |
| ωB97XD | 6-31g** (str. 2) | −5.11 | −3.29 | −4.00 | −0.17 | −1.38 |
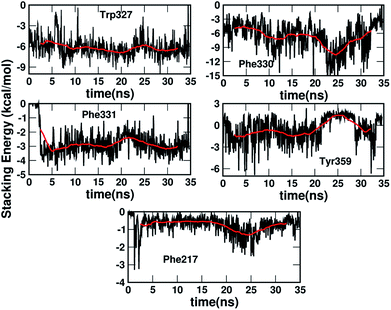
Fig. 5 shows the dynamics of the stacking interaction energy for each pair (residue and serotonin) over the 35 ns simulation time. The evolution of the gas phase stacking interaction energies shows that the Phe331, Phe330 and Trp327 residues contribute most to the stacking interaction and the stability of the protein–ligand complex. On the other hand, the average quantitative contributions to the stacking interaction energy and the stability of the serotonin–receptor complex from the Tyr359 and Phe217 residues are close to zero. The sudden jump in stacking energy from 0 to −4 kcal mol−1 at ∼3 ns indicates a structural change of Phe331 in the presence of serotonin, which favours the stacking interaction. To assess the validity of the used force fields in representing non-covalent interactions, a comparison of the quantum mechanical and molecular mechanical interaction energies for the serotonin–residue pairs is provided in Section I of the ESI.†
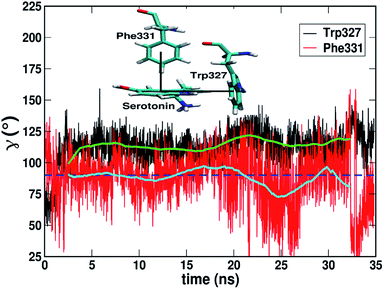
3.1.1.2 Trimeric L-type interactions. A three-body stacking interaction, hereby named ‘L-type’ stacking, has been observed in serotonin–receptor complexes. The trimeric L-type stacking interaction is formed when two T-type stacking interactions between three residues are combined. In this case Trp327, serotonin and Phe331 form L-type stacking where both the Trp327/serotonin pair and the serotonin/Phe331 pair are in the T-type orientation (as shown in the inset of Fig. 6). Although there is significant fluctuation in the γ angle for Phe331 around 25–35 ns, the average γ angles for Phe331 and Trp327 remain ∼90° and ∼115° (see the cyan and green lines, respectively). Table 2 shows a comparison of the stabilization energies due to L-type stacking obtained using the DLPNO-CCSD(T) method with the aug-cc-pVTZ basis set and the DFT ωB97XD functional and the 6-31g** basis set. In Table 2, ΔE327 + ΔE331 and ΔE327+331 refer to the summation of the stacking interaction energies for Trp327/serotonin and Phe331/serotonin and the three-body stacking interaction energy between Trp327, serotonin and Phe331, respectively, while ΔΔE refers to the difference between ΔE327+331 and ΔE327 + ΔE331.
| Method/basis set | ΔE327+331 | ΔE327 + ΔE331 | ΔΔE |
|---|---|---|---|
| DLPNO-CCSD(T)/aug-cc-pVTZ | −10.36 | −9.52 | −0.84 |
| ωB97XD/6-31g** | −10.11 | −9.11 | −1.00 |
Quantitatively, the trimeric L-type stacking interaction contributes ∼0.6–1.2 kcal mol−1 stabilization energy to the system, which has been confirmed by calculations of the stacking interaction energies of several random snapshots at the ωB97XD/6-31g** level of theory.
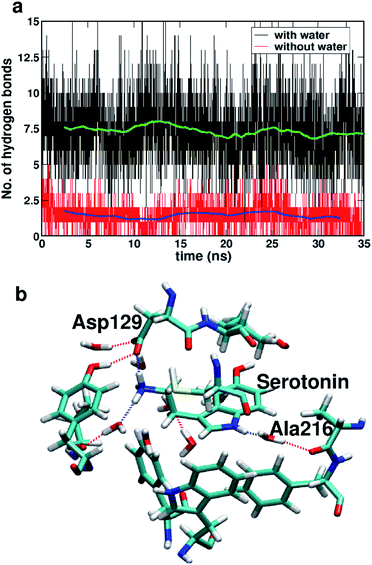
Fig. 7a shows the number of hydrogen bonds within 3.5 Å of serotonin without and with water, which indicates that the average number of hydrogen bonds increases from ∼2 to ∼7.5 with inclusion of water molecules within the binding sites. To further examine the origin of this increase in the number of hydrogen bonds in detail, a thorough visual inspection of the snapshots over the 35 ns trajectory is carried out. It is found that most of the hydrogen bonds are water-mediated hydrogen bonds between serotonin and the receptor residues, with a partial contribution from hydrogen bonds between water and the receptor residues as well. A typical snapshot showing the hydrogen bonds in the binding site involving water molecules is shown in Fig. 7b.
The hydrogen bonding lifetimes for receptor–water hydrogen bonds and serotonin–water hydrogen bonds are found to be 12 ps and 6.8 ps, respectively. Details of the lifetime calculation are provided in Section II of the ESI.† Among these hydrogen bonds, the water-mediated hydrogen bonds between Ala216 and serotonin as well as the direct hydrogen bonds between Asp129 and serotonin are the strongest ones with long lifetimes (details provided in Section II of the ESI†).
3.2 Long-range conformational changes due to serotonin–receptor binding in aqueous solution
To account for the long-range conformational changes due to serotonin–receptor binding, principle component analysis and DCC analysis were performed on 10![[thin space (1/6-em)]](https://www.rsc.org/images/entities/char_2009.gif) 000 snapshots from the 100 ns simulation data.
000 snapshots from the 100 ns simulation data.
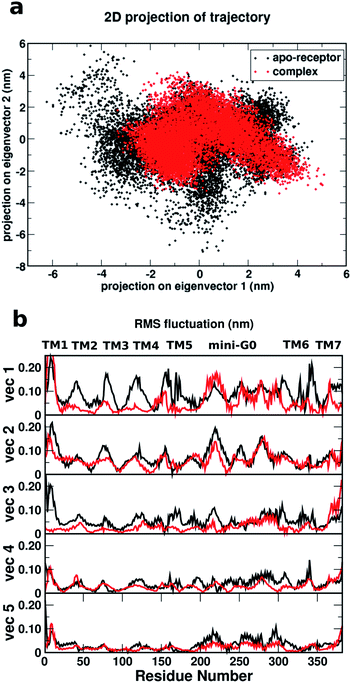
Fig. 8a shows a comparison of the 2D projections of eigenvector 1 and eigenvector 2 corresponding to the changes in the two most important collective motions for the apo-receptor (black) and the complex (red). The fact that the black dots are distributed over a wider region than the red dots indicates that the binding of serotonin stabilizes the receptor and therefore introduces smaller conformational fluctuations/transitions. The non-overlapping region between the red and black dots accounts for the stability due to serotonin–receptor binding in water. To describe the important regions contributing to the conformational stability/instability due to the serotonin–receptor binding, the root mean square fluctuations (RMSF) of the Cα atom of each residue for the first five important collective motions (starting from vec1 with the largest eigenvalue) are plotted against the residue numbers for the apo-receptor (black) and the complex (red). The figure shows that while the RMSF for residue number 50–200 (TM2–TM5) and 300–350 (TM6) is drastically reduced for the complex with respect to the apo-receptor for vec1 and vec3, the RMSF for residue number 200–300 (TM5 and mini-G0) is reduced for the complex with respect to the apo-receptor for vec2, vec4 and vec5. This indicates that these regions, i.e. almost the whole receptor, are significantly stabilized due to the serotonin binding.
Therefore, it can be concluded that the whole receptor (especially the TM2–TM6 region) is highly stabilized due to the serotonin–receptor binding which in turn contributes to the conformational changes in the mini-G0 region of the G-protein and very likely helps in signal transduction through the G-protein. This finding is in line with previously reported results for the ergotamine-bound 5-HT1B receptor9 and is known to be a common characteristic of antagonist-bound class A GPCR structures.48
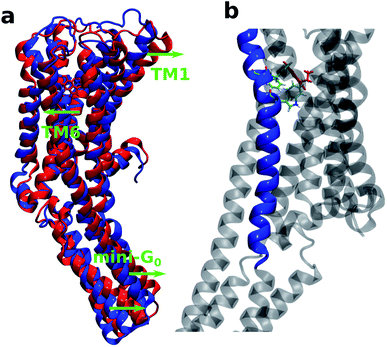
It is also interesting to note that TM6 contains the most important residues Phe330, Phe331 and Trp327 which provide stability to the protein–ligand complex via stacking interactions (see Fig. 9b). Fig. 9a shows the initial (at t = 0 ns) and final (at t = 100 ns) structures of the serotonin–receptor complex. The green arrows indicate the movement of serotonin and mini-G0 during the simulation. It is noticed that serotonin and TM6 move towards the left to stabilize the stacking interactions with Phe331, Trp327 and Phe330, and this movement in turn induces movement of the mini-G0 region to the right (green arrow at the bottom).
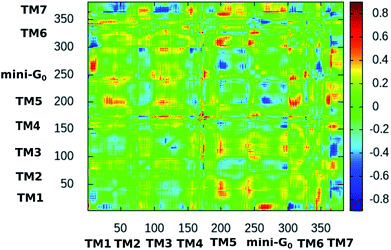
Fig. 10 shows the difference dynamic cross correlation (DDCC) map where the difference between the DCC maps for the serotonin–receptor complex and the apo-receptor is plotted as a color map in the range of [−0.8![[thin space (1/6-em)]](https://www.rsc.org/images/entities/char_2009.gif) :
:![[thin space (1/6-em)]](https://www.rsc.org/images/entities/char_2009.gif) 0.8]. The DCC maps were obtained for the Cα atom of the receptor from 10
0.8]. The DCC maps were obtained for the Cα atom of the receptor from 10![[thin space (1/6-em)]](https://www.rsc.org/images/entities/char_2009.gif) 000 snapshots (in 10 ps intervals) of the 100 ns simulation. The figure indicates that the correlations between TM6 and mini-G0, TM3 and mini-G0 as well as TM5 and mini-G0 are different in the complex with respect to those in the apo-receptor. It should be noted here that the TM6 region contains Phe330, Phe331 and Trp327 which are the three most important aromatic residues exhibiting stacking interactions with serotonin. On the other hand, the TM5 region contains Ala216 which exhibits strong water-mediated hydrogen bonding with the –NH group of serotonin. The TM3 region contains Asp129 which shows strong hydrogen bonding with the amine group of serotonin. All these interactions induce a long-range allosteric effect, rendering conformational changes in the mini-G0 region which is part of the G-protein. Correlations between TM1 and mini-G0 as well as between TM7 and TM1/TM3/TM5/TM6 were also noticed in the DDCC map and were found in the case of the receptor as well (and not in the case of the complex) (see Fig. S3 and S4 in ESI†), and therefore can be considered as not directly originating from serotonin–receptor binding.
000 snapshots (in 10 ps intervals) of the 100 ns simulation. The figure indicates that the correlations between TM6 and mini-G0, TM3 and mini-G0 as well as TM5 and mini-G0 are different in the complex with respect to those in the apo-receptor. It should be noted here that the TM6 region contains Phe330, Phe331 and Trp327 which are the three most important aromatic residues exhibiting stacking interactions with serotonin. On the other hand, the TM5 region contains Ala216 which exhibits strong water-mediated hydrogen bonding with the –NH group of serotonin. The TM3 region contains Asp129 which shows strong hydrogen bonding with the amine group of serotonin. All these interactions induce a long-range allosteric effect, rendering conformational changes in the mini-G0 region which is part of the G-protein. Correlations between TM1 and mini-G0 as well as between TM7 and TM1/TM3/TM5/TM6 were also noticed in the DDCC map and were found in the case of the receptor as well (and not in the case of the complex) (see Fig. S3 and S4 in ESI†), and therefore can be considered as not directly originating from serotonin–receptor binding.
4 Summary
In this work, serotonin–receptor binding was investigated using computational methodologies based on quantum chemical calculations and molecular dynamics simulations. Specifically, the important interactions between serotonin and the receptor and the key residues contributing to the stability of the complex were identified. The long-range allosteric effect of serotonin–receptor binding, which leads to different psychological phenomena, was also identified.The stacking interactions and hydrogen bonding between the receptor residues and serotonin were found to play an important role in serotonin–receptor binding. In particular, the focus was on the stacking interactions of serotonin with the aromatic residues in the binding site e.g. Trp327, Phe330, Phe331, Tyr359 and Phe217. Qualitative analysis based on the center of mass distances and the angle between the surface normals of serotonin and the residues suggests that the T-type interaction is predominant in the serotonin–receptor complex and Trp327, Phe330 and Phe331 are the three most important residues providing stability to the complex via stacking interactions. Quantum chemical calculations of the stacking energy provide a quantitative estimation of the interaction energies and further confirm the importance of these three aromatic residues. In a future extension of the present work, the effect of the backbone and surroundings in modulating the stability via stacking interactions can be explored using a combined quantum mechanical/molecular mechanical method. An ‘L’-type trimeric stacking interaction is observed between Trp327, serotonin and Phe331, providing extra stability to the complex. Direct hydrogen bonding interactions between Asp129 and serotonin as well as water-mediated hydrogen bonding between serotonin and Ala216 were found to play an important role in serotonin–receptor binding.
The long-range conformational changes in the receptor due to serotonin–receptor binding were analyzed using coarse-grained analysis methods e.g. the principle component analysis and difference dynamic cross correlation methods. For comparison, apo-receptor data was used as a reference. The analyses show that the whole complex is stabilized due to serotonin binding. For the conformational changes, correlations between the TM6 region and mini-G0, TM3 and mini-G0 as well as TM5 and mini-G0 were found. While TM6 is the transmembrane helix containing the aromatic residues Phe331, Trp327 and Phe330, TM3 and TM5 are the transmembrane helices containing Asp129 and Ala216, respectively. Therefore a direct conformational correlation is established between the serotonin–receptor binding and the mini-G0 region which is part of the G-protein i.e. the main channel for signal transduction for psychological functionality. These results consider only an aqueous solution environment instead of the membrane environment of the serotonin–receptor complex. Therefore, the long-range conformational transitions and allosteric effect reported here may vary when a realistic membrane environment is considered. However, the basic qualitative correlations between the important residues/helices and the mini-G0 region obtained in this work will pave the way for further investigation in a realistic membrane environment. In a future extension of the present work, the effect of the membrane environment will be explicitly considered and compared with the results in aqueous solution.
Finally, this work serves two purposes. First, the serotonin–receptor binding mechanism and allosteric effect were decrypted using computational methodologies based on quantum chemistry, molecular dynamics simulation and coarse-grained analysis. Second, it provides a general theoretical protocol (i) to identify the important residues and interactions for protein–ligand binding and (ii) to identify important long-range conformational changes which induce allostery and can be applied to any protein–ligand or protein–drug system. In a future extension of the present work, a rigorous study based on free-energy simulations of serotonin and other possible drugs with different receptors in the membrane environment is planned. It is also hoped that the present study will encourage a series of future investigations leading to efficient design of antidepressants or other drugs.
Conflicts of interest
There are no conflicts to declare.Acknowledgements
P. M. acknowledges Dr Debasish Koner for fruitful discussions and Mr Soumyadip Ray for help in preparing figure 2.References
- X. Du, Y. Li, Y. L. Xia, S. M. Ai, J. Liang, P. Sang, X. L. Ji and S.-Q. Liu, Int. J. Mol. Sci., 2016, 17, 144–178 CrossRef.
- J. Janin, Prog. Biophys. Mol. Biol., 1995, 64, 145–166 CrossRef CAS.
- P. Mondal and M. Huix-Rotllant, Phys. Chem. Chem. Phys., 2019, 21, 8874–8882 RSC.
- M. Berger, J. A. Gray and B. L. Roth, Annu. Rev. Med., 2009, 60, 355–366 CrossRef CAS.
- D. Hoyer, et al., Pharmacol. Rev., 1994, 46, 157–203 CAS.
- B. L. Roth, S. M. Hanizavareh and A. E. Blum, Psychopharmacology, 2004, 174, 17–24 CrossRef CAS.
- B. L. Roth, D. J. Sheffler and W. K. Kroeze, Nat. Rev. Drug Discovery, 2004, 3, 353–359 CrossRef CAS.
- D. Hoyer and G. Martin, Neuropharmacology, 1997, 36, 419–428 CrossRef CAS.
- W. Yin, et al., Cell Discovery, 2018, 4, 12–25 CrossRef.
- S. M. Wang, C. Han, S.-J. Lee, A. A. Patkar, P. S. Masand and C.-U. Pae, Psychiatry Invest., 2015, 12, 155–163 CrossRef CAS.
- C. Wang, et al., Science, 2013, 340, 610–614 CrossRef CAS.
- D. Wacker, et al., Cell, 2017, 168, 377–389 CrossRef CAS.
- P. Mondal and M. Meuwly, Phys. Chem. Chem. Phys., 2017, 19, 16131–16143 RSC.
- A. Grosdidier, V. Zoete and O. Michielin, Nucleic Acids Res., 2011, 39, W270–W277 CrossRef CAS.
- H. J. C. Berendsen, D. van der Spoel and R. van Drunen, Comput. Phys. Commun., 1995, 91, 43–56 CrossRef CAS.
- A. D. J. Mackerell, M. Feig and C. L. R. Brooks, J. Comput. Chem., 2004, 25, 1400–1415 CrossRef CAS.
- A. D. J. Mackerell, et al., J. Phys. Chem. B, 1998, 102, 3586–3616 CrossRef CAS.
- P. Bjelkmar, P. Larsson, M. A. Cuendet, B. Hess and E. Lindahl, J. Chem. Theory Comput., 2010, 6, 459–466 CrossRef CAS.
- K. Vanommeslaeghe, E. Hatcher, C. Acharya, S. Kundu, S. Zhong, J. Shim, E. Darian, O. Guvench, P. Lopes, I. Vorobyov and A. D. MacKerell Jr, J. Comput. Chem., 2010, 31, 671–690 CAS.
- E. R. Johnson, S. Keinan, P. Mori-Sá nchez, J. Contreras-Garciá, A. J. Cohen and W. Yang, J. Am. Chem. Soc., 2010, 132, 6498–6506 CrossRef CAS.
- F. L. Hirshfeld, Theor. Chim. Acta, 1977, 44, 129–138 CrossRef CAS.
- E. Cauet, M. Rooman, R. Wintjens, J. Lievin and C. Biot, J. Chem. Theory Comput., 2005, 1, 472–483 CrossRef.
- L. R. Rutledge, H. F. Durst and S. D. Wetmore, J. Chem. Theory Comput., 2009, 5, 1400–1410 CrossRef CAS.
- L. R. Rutledge, L. S. Campbell-Verduyn, K. C. Hunter and S. D. Wetmore, J. Phys. Chem. B, 2006, 110, 19652–19663 CrossRef CAS.
- P. Cysewski, Phys. Chem. Chem. Phys., 2008, 10, 2636–2645 RSC.
- C. D. M. Churchill and S. D. Wetmore, J. Phys. Chem. B, 2009, 113, 16046–16058 CrossRef CAS.
- C. Riplinger and F. Neese, J. Chem. Phys., 2013, 138, 034106–034118 CrossRef.
- F. Neese, Wiley Interdiscip. Rev.: Comput. Mol. Sci., 2012, 2, 73–78 CAS.
- F. Neese, Wiley Interdiscip. Rev.: Comput. Mol. Sci., 2018, 8, e1327 Search PubMed.
- R. A. Kendall, T. H. Dunning Jr and R. J. Harrison, J. Chem. Phys., 1992, 96, 6796–6806 CrossRef CAS.
- S. F. Boys and F. Bernardi, Mol. Phys., 1970, 19, 553–566 CrossRef CAS.
- P. J. Stephens, F. J. Devlin, C. F. Chabalowski and M. J. Frisch, J. Phys. Chem., 1994, 98, 11623–11627 CrossRef CAS.
- P. C. Hariharan and J. A. Pople, Theor. Chim. Acta, 1973, 28, 213–222 CrossRef CAS.
- J. D. Chai and M. Head-Gordon, Phys. Chem. Chem. Phys., 2008, 10, 6615–6620 RSC.
- M. Head-Gordon, J. A. Pople and M. J. Frisch, Chem. Phys. Lett., 1988, 153, 503–506 CrossRef CAS.
- M. J. Frisch, G. W. Trucks, H. B. Schlegel, G. E. Scuseria, M. A. Robb, J. R. Cheeseman, G. Scalmani, V. Barone, G. A. Petersson, H. Nakatsuji, X. Li, M. Caricato, A. V. Marenich, J. Bloino, B. G. Janesko, R. Gomperts, B. Mennucci, H. P. Hratchian, J. V. Ortiz, A. F. Izmaylov, J. L. Sonnenberg, D. Williams-Young, F. Ding, F. Lipparini, F. Egidi, J. Goings, B. Peng, A. Petrone, T. Henderson, D. Ranasinghe, V. G. Zakrzewski, J. Gao, N. Rega, G. Zheng, W. Liang, M. Hada, M. Ehara, K. Toyota, R. Fukuda, J. Hasegawa, M. Ishida, T. Nakajima, Y. Honda, O. Kitao, H. Nakai, T. Vreven, K. Throssell, J. A. Montgomery Jr, J. E. Peralta, F. Ogliaro, M. J. Bearpark, J. J. Heyd, E. N. Brothers, K. N. Kudin, V. N. Staroverov, T. A. Keith, R. Kobayashi, J. Normand, K. Raghavachari, A. P. Rendell, J. C. Burant, S. S. Iyengar, J. Tomasi, M. Cossi, J. M. Millam, M. Klene, C. Adamo, R. Cammi, J. W. Ochterski, R. L. Martin, K. Morokuma, O. Farkas, J. B. Foresman and D. J. Fox, Gaussian 09 Revision A.01, Gaussian Inc., Wallingford CT, 2009 Search PubMed.
- I. T. Jolliffe, Principle Component Analysis, Springer-Verlag, New York, 2nd edn, 2002 Search PubMed.
- J. A. McCammon, Rep. Prog. Phys., 1984, 47, 1–46 CrossRef.
- Y. Komeiji, M. Uebayasi and I. Yamato, Proteins: Struct., Funct., Genet., 1994, 20, 248–258 CrossRef CAS.
- W. E. Harte Jr, S. Swaminathan, M. M. Mansuri, J. C. Martin, I. E. Rosenberg and D. L. Beveridge, Proc. Natl. Acad. Sci. U. S. A., 1990, 87, 8864–8868 CrossRef CAS.
- C. D. M. Churchill, L. Rutledge and S. D. Wetmore, Phys. Chem. Chem. Phys., 2010, 12, 14515–14526 RSC.
- M. Brylinski, Chem. Biol. Drug Des., 2018, 91, 380–390 CrossRef CAS.
- D. D. Boehr, A. R. Farley, G. D. Wright and J. R. Cox, Cell Chem. Biol., 2002, 9, 1209–1217 CAS.
- P. Mondal, M. Biswas, T. Goldau, A. Heckel and I. Burghardt, J. Phys. Chem. B, 2015, 119, 11275–11286 CrossRef CAS.
- K. E. Riley and P. Hobza, WIRES, Wiley & Sons, 2011, vol. 1, pp. 3–17 Search PubMed.
- G. A. Jeffrey and W. Saenger, Hydrogen Bonding in Biomolecules, Springer-Verlag, Berlin, Heidelberg, 1991 Search PubMed.
- M. G. G. B. McGaughey and A. K. Rappé, J. Biol. Chem., 1998, 273, 15458–15463 CrossRef.
- K. Zhang, et al., Nature, 2014, 509, 115–118 CrossRef CAS.
Footnote |
| † Electronic supplementary information (ESI) available. See DOI: 10.1039/d0ra05559j |
| This journal is © The Royal Society of Chemistry 2020 |

