DOI:
10.1039/D0RA05530A
(Paper)
RSC Adv., 2020,
10, 37050-37063
Use of nanohybrid nanomaterials in water treatment: highly efficient removal of ranitidine†
Received
24th June 2020
, Accepted 5th September 2020
First published on 8th October 2020
Abstract
Entire elimination of pharmaceutical drugs from waste- and domestic-waters has attracted great attention due to their potent adverse effects on human health, particularly the human immune system. Many risks have been related to the presence of different types of drugs at different concentrations in wastewater. These risks include antimicrobial resistance (AMR), endocrine action, hormonal activation of cancers, and photodegradation of drugs. In this study, new nanohybrid materials consisting of graphene oxide (GO) and oxidized carbon nanotubes (OCNTs) were developed to remove a well-known drug, namely, ranitidine that treats stomach ulcers and gastrointestinal (GI) reflux disease from aqueous solutions. The characterization of synthesized nanohybrid GO-OCNTs was performed using spectroscopic (FTIR, and XRD), thermogravimetric (TGA) and microscopic (SEM) techniques. Batch adsorption experiments were used to investigate the technical feasibility of using synthesized GO-OCNTs for the removal of ranitidine from aqueous solutions. The effects of different operating conditions such as contact time, nanohybrid mass, solution temperature, solution pH, % crosslinking agent, and GO-to-OCNT ratio on the entire elimination of ranitidine were investigated. The experimental results indicated that the removal of ranitidine was very efficient, where 98.3% removal of the drug from aqueous solutions was achieved with a drug uptake of 97.8 mg g−1. Moreover, the results indicated the optimum conditions for the removal of ranitidine, which are as follows: contact time = 140 minutes, nanohybrid GO-OCNT mass = 10 mg, solution temperature = 290 K, solution pH = 6.4, % crosslinking agent = 0.5%, and GO to O-CNT ratio = 1![[thin space (1/6-em)]](https://www.rsc.org/images/entities/char_2009.gif) :4. The equilibrium data were fitted to different adsorption isotherms and Langmuir was found to best describe our data. Dynamic studies demonstrated that ranitidine adsorption followed pseudo-second order, and the thermodynamic parameters confirmed exothermic drug adsorption as well as the physisorption process.
:4. The equilibrium data were fitted to different adsorption isotherms and Langmuir was found to best describe our data. Dynamic studies demonstrated that ranitidine adsorption followed pseudo-second order, and the thermodynamic parameters confirmed exothermic drug adsorption as well as the physisorption process.
Introduction
Pharmaceuticals existing in sewage treatment plant effluents, wastewaters, and daily drinking waters have been found responsible for acute and chronic effects on humans and the environment.1 The adverse effects of pharmaceuticals in wastewater are ringing the bell for hidden threats on the human health, animals, and plants.2–4 Due to millions of medical prescriptions of drugs worldwide, unmetabolized pharmaceuticals are accumulated in wastewater either through human urine or dislodged faeces.5,6 Whenever the concentration of drugs in wastewater exceeds the shelf concentration, it causes toxicity to humans, animals and plants. Latest statistics indicate that there are more than 3000 different drugs prescribed. Such enormous number of drugs in wastewater indicates the difficulty in efficiently treating wastewater that contains some of these drugs.7
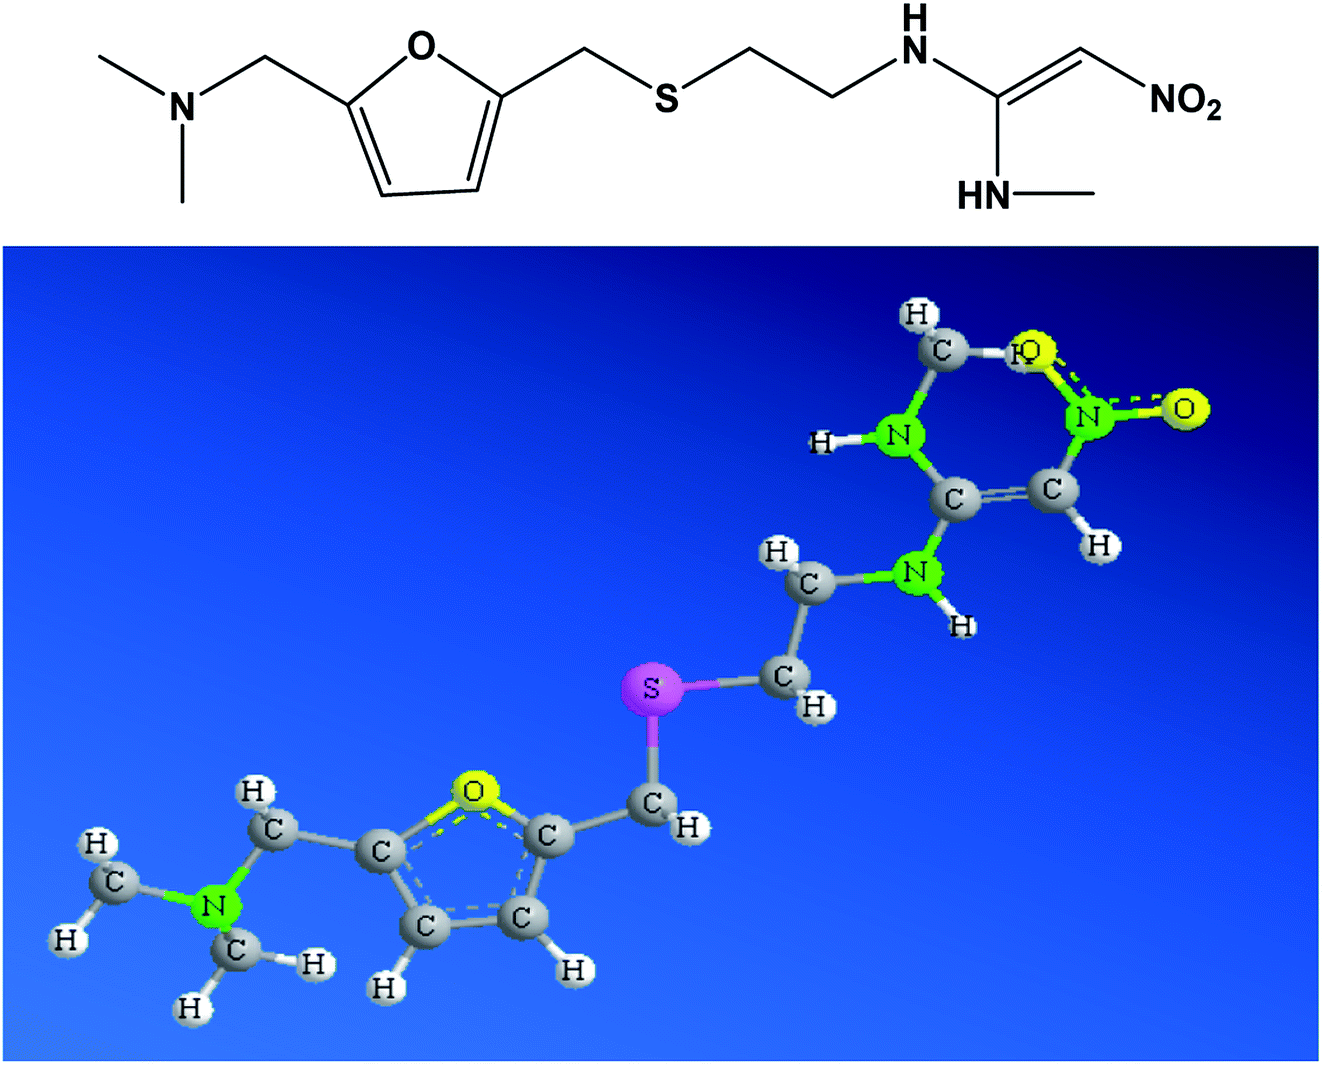
Ranitidine (Fig. 1) is a histamine H2-receptor antagonist drug and it is a widely used medication for treating gastric ulcers, active duodenal ulcers, Zollinger-Ellison syndrome and gastroesophageal diseases.8 Ranitidine reduces the amount of acid secreted by blocking histamine,9 and can also induce the activation of immune system in patients.10 In some cases, there are some bacteria producing histamine that causes acidity; therefore, antihistamines should be taken in addition to antibacterial agents.11 In 2019, more than 12 million medical prescriptions for ranitidine were reported in the US.12
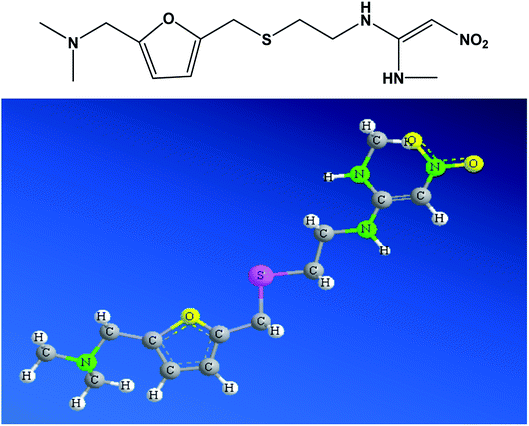 |
| | Fig. 1 Chemical and 3D structures of ranitidine. | |
Ranitidine has been identified in many wastewater effluents with various concentrations.13–17 It was identified as one of the pharmaceuticals with a high predicted environmental concentration of around 100 ng L−1 that causes risks to the aquatic environment18 and ranitidine toxicity occurs when organisms are exposed for a long time. A chronic toxicity test for ranitidine showed that it has ecotoxicity effects on aquatic organisms with half maximal effective concentrations (EC50) of 2.5 ppm for calyciflorus and 1.5 ppm for dubia. Another dangerous risk resulting from the presence of ranitidine in the wastewater is the formation of a dangerous substance during the sterilization process named N-nitrosodimethylamine (NDMA) and classified as a carcinogen. Ranitidine is considered the main source of NDMA where the conversion rate reaches 90%,19 and consequently, it was banned.20 In addition, the risk quotient (RQ) for ranitidine is identified as a medium risk.21,22 It has been reported that the removal of ranitidine from wastewater plants is weak and poor.23
Different techniques have been employed to remove pharmaceuticals including ranitidine from wastewater. These techniques include activated sludge and trickling filter processes,24,25 biosorption,26 oxidation,27 reverse osmosis,28 adsorption by activated carbon29 and multifunctional carbon nanotubes in water treatment.30 However, these techniques are either expensive or not efficient. Nanomaterials such as carbon nanotubes (CNTs) have a high adsorption capacity due to the presence of voids, pores, and adsorption sites.31 They are categorized by their excellent chemical and thermal stability,32 high adsorption surface area over 1000 m2 g−1 and low-cost materials.33,34 In addition, graphene oxide (GO) nanocomposites were used for the removal of pharmaceuticals and personal care products from wastewater.35–39
In this work, we combined graphene oxide (GO) with oxidized carbon nanotubes (O-CNTs) to make nanohybrid GO-OCNT materials that could efficiently remove ranitidine from aqueous solutions. The new nanohybrid material was characterized by different spectroscopic, thermal, and microscopic techniques. The effects of different operating conditions such as temperature, pH, initial drug concentrations, contact time, % crosslinking agent, and GO-to-O-CNT ratio were investigated. Different kinetics, mass transfer, and isotherm models were used to analyze the dynamics and the thermodynamics of the experimental results.
Experimental
Materials
Graphene was purchased from Sigma-Aldrich, and carbon nanotubes were purchased from Nanocyl® NC7000™, Belgium. Ranitidine (assay > 99%) was supplied by a local pharmaceutical company, Jordan. Other reagents were of analytical grade and used as received: Tween® 80 used as a high–dispersion power surfactant with a micellar average molar mass of 79000 (BBC chemicals), HCl 37% (Scharlau), H2SO4 acid 95–97% (Riedel dehaen), HNO3 69–70% (BBC Chemicals), H2O2 (Merk), CaCl2 and KMnO4, NaOH (Scharlau), and H3PO4 85% (Riedel dehaen).
Investigation tools
Fourier transform infrared (FTIR). FTIR spectroscopy (Bruker, Germany) was used to investigate the functional groups of functionalized GO and oxidized multi-walled CNTs. The recorded spectra were in the range of 4000–400 cm−1 using a KBr powder.
Thermogravimetric analysis (TG). TG thermograms (Netzsch Proteus, Germany) were used to study the thermal stability of GO and multi-walled CNTs before and after the oxidation processes. Samples were heated from room temperature up to 900 °C at a heating rate of 10 °C min−1 under the flux of inert nitrogen gas. Derivative thermogravimetry (DTG) technique was used to determine the decomposition temperature of the samples.
Scanning electron microscope (SEM). A SEM (Inspect F50), a high-resolution Schottky field emission gun (FEG), a high vacuum and Bruker EDS microanalyser, an X-Flash silicon drift detector (SDD) were used to study the morphological changes of graphene and multi-walled CNTs before and after the oxidation processes. Samples were sputtered by gold ions prior to imaging. All images were tuned and resolved using the software programs of the instrument.
X-ray diffraction (XRD). A Rigaku Goniometer X-ray diffractometer (Ultima IV (1 & 5 mm), Japan) equipped with a Cu-Kα radiation source operating at an accelerating tube voltage of 40 kV and tube current of 40 mA was used to demonstrate the crystalline structure of graphene and multiwall CNTs before and after the oxidation process. The scanning rate was 2° per min from 5° to 60° angle range.
UV-vis spectrophotometry. A UV-vis spectrophotometer (Hach Lange DR5000™) was used to measure the concentrations of ranitidine. A calibration curve for ranitidine was established. The samples were scanned in the range of 200–800 nm and the maximum wavelength (λmax) was set at 227 nm.
Synthesis of graphene oxide (GO)
Around 225 mg of graphene powder was mixed with 30 mL of 9:1 ratio of sulfuric acid (H2SO4) to phosphoric acid (H3PO4) under continuous stirring for six hours according to Hummers method.40 Then, 1.32 g potassium permanganate (KMnO4) was added and 675 μL hydrogen peroxide (H2O2) was dropped slowly to remove excess potassium permanganate and dilute hydrochloric acid (HCl) was added. The solution was centrifuged and decanted. The final product was washed with a 1:3 ratio of concentrated hydrochloric acid to water solution and finally dried.41
Synthesis of oxidized carbon nanotubes (OCNTs)
An amount of 2000 mg multi-walled carbon nanotubes were placed in a 50 mL dried round-bottomed flask equipped with a condenser, to which 30 mL of 9.0 M nitric acid (HNO3) solution was slowly added. The mixture was refluxed at 75 °C for 24 hours. After completion, the oxidized CNTs were filtered and the trace amount of O-CNTs suspended in the solution was collected by centrifugation. Finally, the oxidized CNTs were purified from nitric acid traces by washing several times with distilled water until the pH of the filtrate solution became neutral. The O-CNTs samples were dried at ambient temperature and stored until used elsewhere.42
Fabrication of nanohybrid GO-OCNTs
An amount of 500 mg of graphene oxide (GO) was dispersed in 150 mL of 2.5% Tween-80 surfactant solution (w/w) under continuous stirring at 70 °C for two hours to make water-dispersed GO solution. Similarly, in a separate tube, 500 mg of oxidized carbon nanotubes (O-CNTs) was dispersed in 150 mL of 2.5% Tween-80 surfactant solution at 70 °C to make water-dispersed CNT solution.43 The water-dispersed solutions of GO and O-CNTs were mixed and slowly dropped in a calcium chloride solution to make 2% CaCl2 concentration under 100 rpm stirring. For complete nucleation of the nanohybrid sample, the mixture was left stirring overnight at ambient temperature. The final product was collected by centrifugation and the nanohybrid GO-OCNT materials were dried and stored until use.
Drug removal
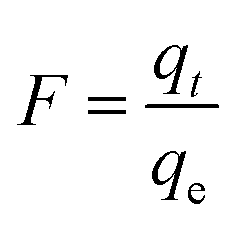
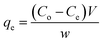
The nanohybrid GO-OCNTs were placed in the ranitidine solution at different concentrations and shaken in the Memmert shaker for different periods of time. After time completion, the samples were centrifuged at 4000 rpm for 15 minutes and the supernatant was decanted. The drug uptake by nanohybrid GO-OCNTs was calculated using the following equation:| |
 | (1) |
where qe is the equilibrium drug uptake (in mg g−1), Co is the initial concentration of the drug (in mg L−1), Ce is the equilibrium drug concentration (in mg L−1), V is the volume of the solution (in L) and w is the mass of the nanohybrid material (in g).
In order to establish a calibration curve to obtain the linear equation between the absorbance and the concentration, a stock solution of 100 ppm ranitidine was prepared with deionized water and then diluted to obtain 25, 20, 15, 10, 5, and 1 ppm solutions. The absorbance was measured by UV-vis spectroscopy at a maximum wavelength (λmax) of 227 nm.
Batch adsorption experiments were conducted to investigate and optimize the adsorption conditions. The effect of time and the optimum time for adsorption were investigated at a pH value of 6.4 and a temperature of 17 °C using 10 mg nanohybrid mass and a ranitidine solution concentration of 20 ppm for time intervals from 20 to 180 minutes. The GO-OCNT ratio was kept at 1/1 and the % CaCl2 was 2.0%. The effect of nanohybrid mass was investigated by conducting adsorption experiments with masses 10–30 mg for 140 minutes at a pH value of 6.5, 17 °C, GO/O-CNT ratio of 1/1, and 2.0% CaCl2. The effect of temperature was investigated over a temperature range of 17–30 °C, for 140 minutes at pH 6.5, GO/O-CNT ratio of 1/1, and 2.0% CaCl2. The effect of solution pH on drug removal was studied in the pH range of 2–11 for 140 minutes at 17 °C, GO/O-CNT ratio of 1/1, and 2.0% CaCl2. For the effect of crosslinker concentrations, three concentrations of CaCl2 (0.5, 2 and 4%) were investigated for 140 minutes at pH 6.5, 17 °C, and a GO/O-CNT ratio of 1/1. The effect of GO/O-CNT ratio was studied in adsorption experiments with different GO/O-CNT ratios of 1/2, 1/3, 1/4, 1/1, 2/1, 3/1, and 4/1, for 140 minutes at pH of 6.5, 17 °C, and 2.0% CaCl2. Adsorption isotherm experiments were studied using initial concentration solutions from 10 to 25 ppm at three temperatures 290, 298 and 303 K, for 140 minutes at pH 6.5, 17 °C, GO/O-CNT ratio of 1/1, and 2.0% CaCl2.
Desorption process
Regeneration of adsorbents is an extremely significant step after completion of drug adsorption process. It allows use of the nanohybrid GO-OCNTs several times. For this purpose, 500 mg nanohybrid GO-OCNTs was soaked in 500 mL of 0.4 M NaOH solution and allowed to mix overnight at ambient temperature, and then the solution was decanted and washed several times with distilled water to remove traces of the drug and the remaining basic solution. The nanohybrid GO-OCNTs were dried and stored until re-use.44
Results and discussion
Characterization of nanohybrid GO-OCNTs
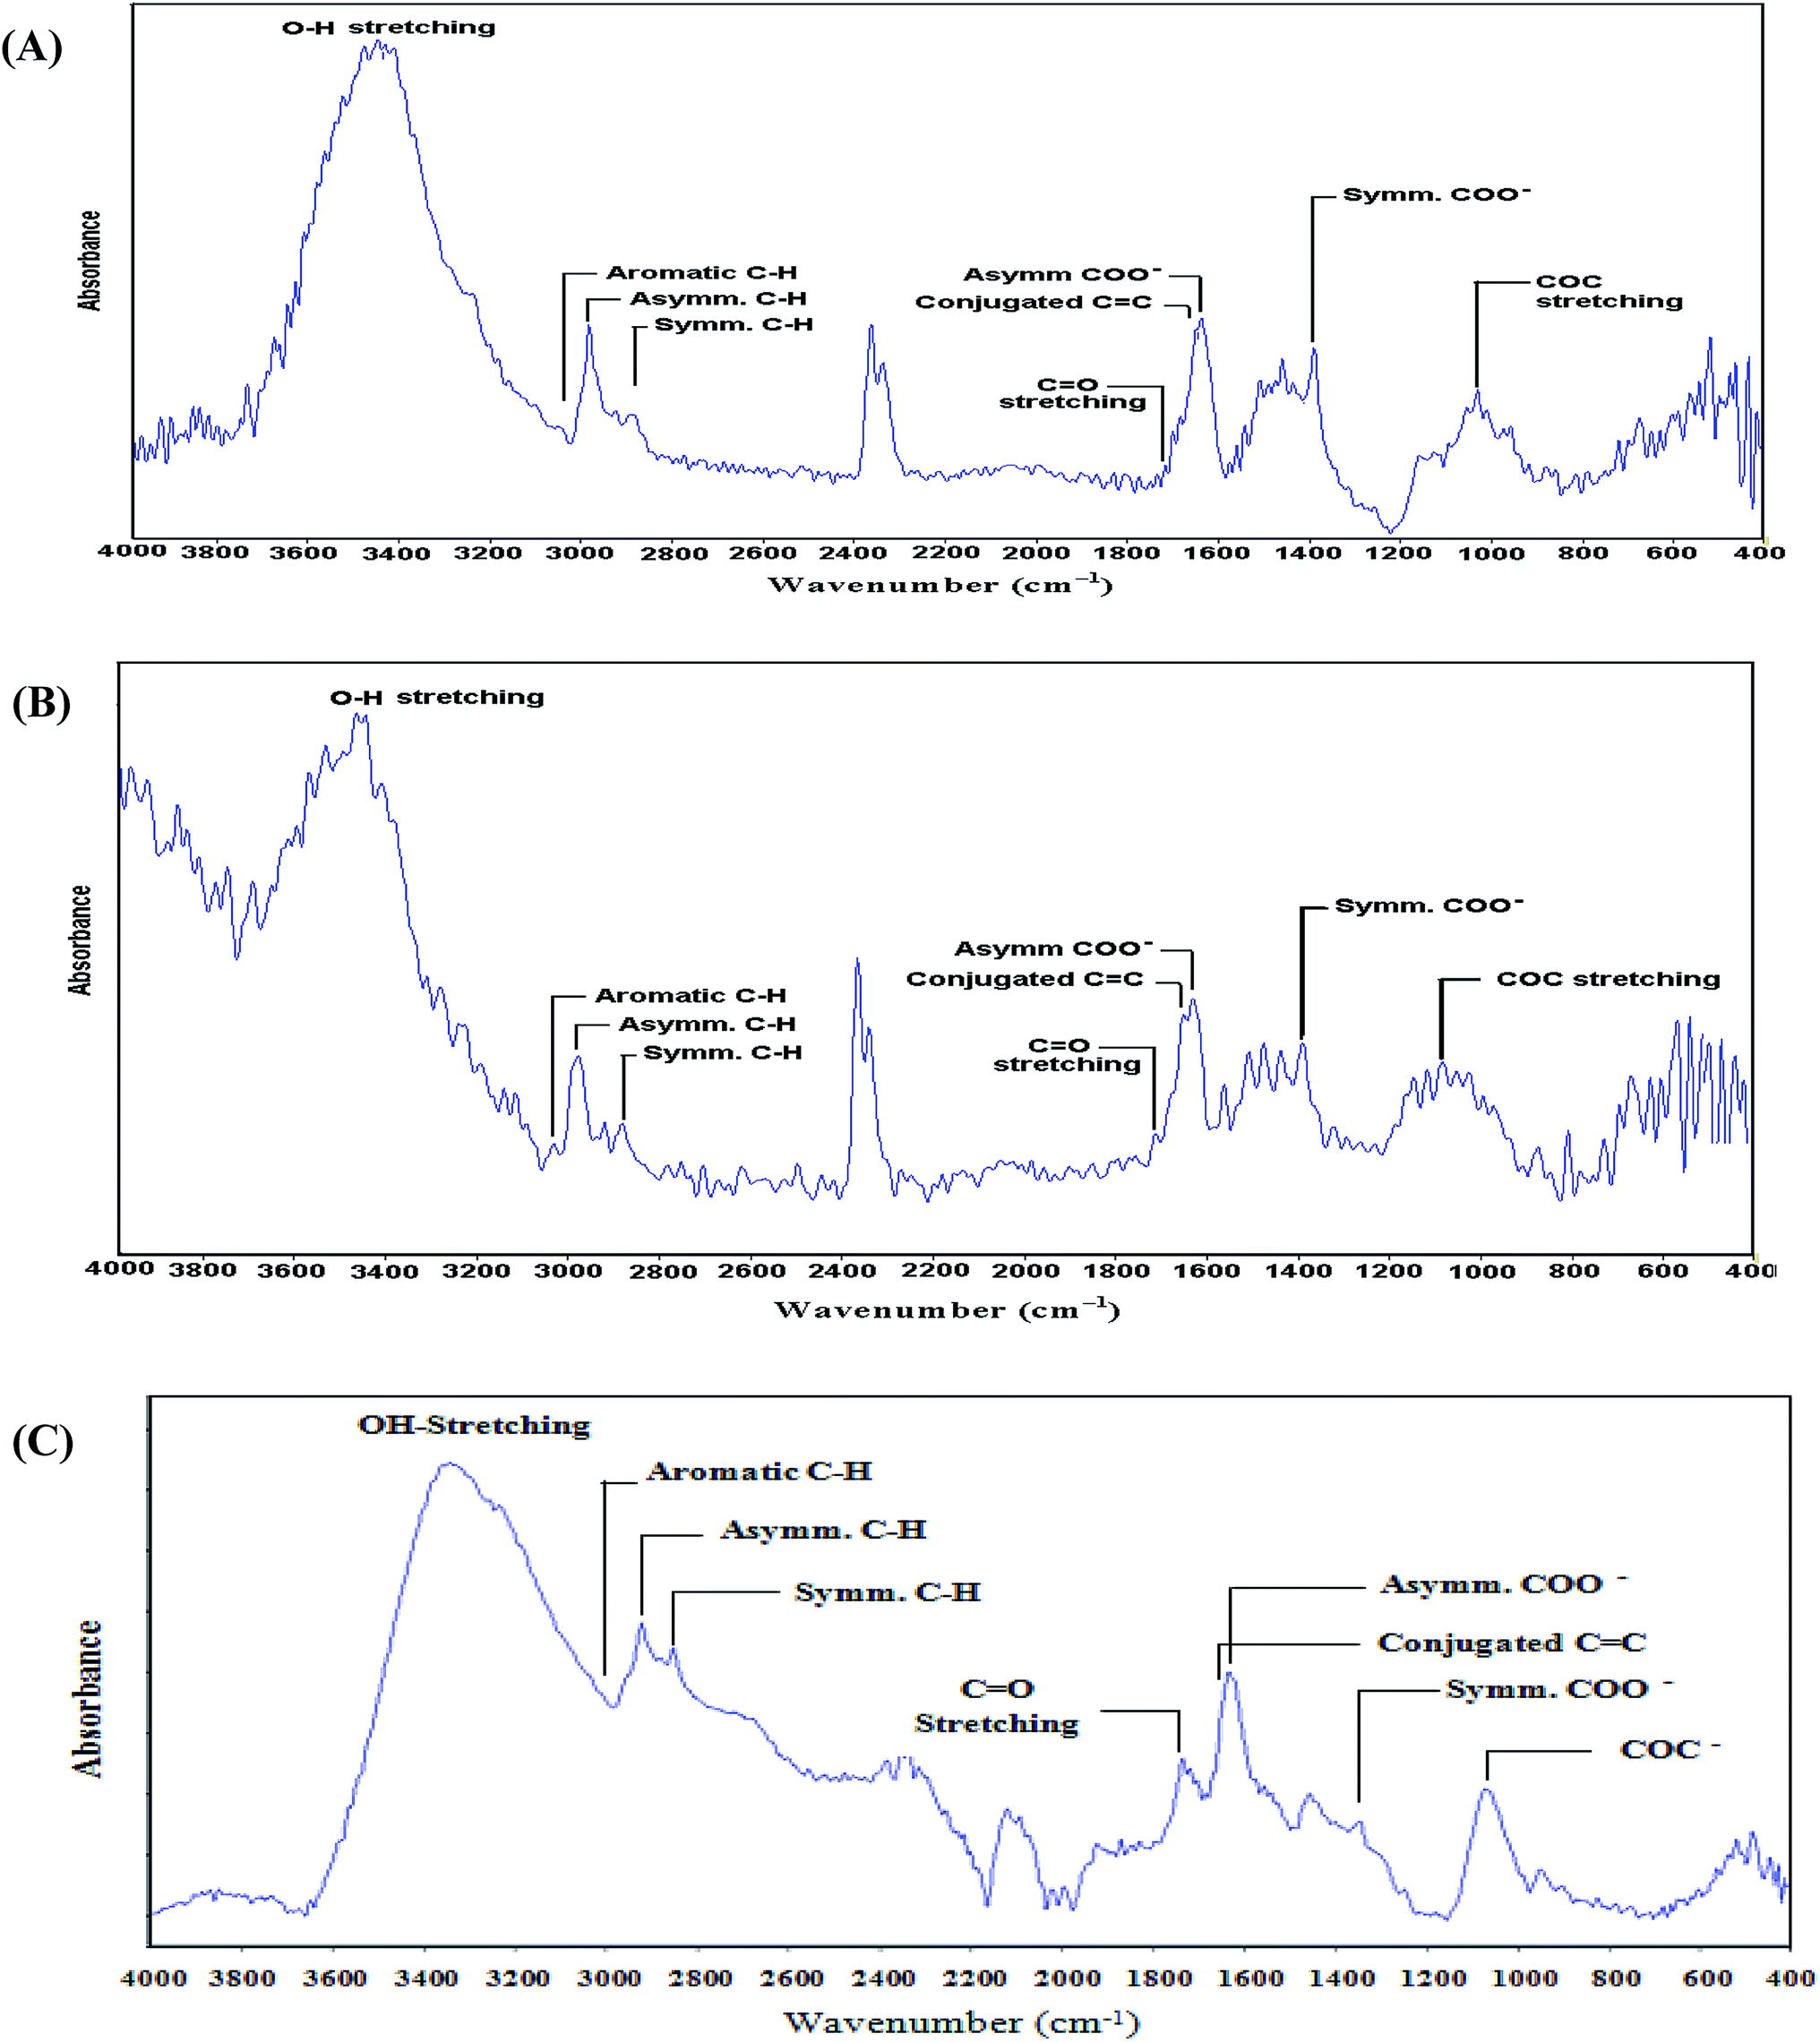
Chemical structure. The functionalization of graphene and carbon nanotubes with different functional groups during the oxidation process was monitored by Fourier transform infrared (FTIR) spectroscopy. Fig. 2 shows the FTIR spectra for graphene oxide (GO), oxidized carbon nanotubes (O-CNTs), and nanohybrid GO-OCNTs. In addition, Table 1 ESI† illustrates the functional groups and their corresponding wavenumbers. In graphene oxide (Fig. 2A), a highly intense hydroxyl (OH) group at 3447 cm−1, asymmetric and symmetric carboxylate (COO−) groups at 1632 and 1385 cm−1, a carbonyl (C![[double bond, length as m-dash]](https://www.rsc.org/images/entities/char_e001.gif) O) group at 1711 cm−1, and appearance of epoxy (COC) groups at 1031 cm−1 demonstrated the successful oxidation process of graphene. Moreover, the presence of highly intense conjugated CC stretching at 1645 cm−1 endorsed the complete oxidation process with a nondestructive carbon skeleton of graphene. This step is extremely important because some oxidation process may end up with the complete destruction of the carbon skeleton. Similarly, in oxidized carbon nanotubes (O-CNTs), an intense hydroxyl (OH) group at 3451 cm−1, respective asymmetric and symmetric carboxylate (COO−) groups at 1625 and 1385 cm−1, a carbonyl (CO) group at 1709 cm−1 and the presence of epoxy (COC) groups at 1080 cm−1 demonstrated the successful oxidation process of CNTs (Fig. 2B). Besides, the presence of a highly intense conjugated CC peak at 1649 cm−1 endorsed the complete oxidation process with the retained structure of carbon nanotubes. The nanohybrid GO-OCNTs showed similar functional groups of GO and O-CNTs (Fig. 2C). Crosslinking of carboxyl groups (COO−) of GO and O-CNTs via Ca2+ ions was confirmed by the decay of asymmetric and symmetric COO− peaks and the simultaneous development of a carbonyl (CO) peak, as observed in Fig. 2C.
O) group at 1711 cm−1, and appearance of epoxy (COC) groups at 1031 cm−1 demonstrated the successful oxidation process of graphene. Moreover, the presence of highly intense conjugated CC stretching at 1645 cm−1 endorsed the complete oxidation process with a nondestructive carbon skeleton of graphene. This step is extremely important because some oxidation process may end up with the complete destruction of the carbon skeleton. Similarly, in oxidized carbon nanotubes (O-CNTs), an intense hydroxyl (OH) group at 3451 cm−1, respective asymmetric and symmetric carboxylate (COO−) groups at 1625 and 1385 cm−1, a carbonyl (CO) group at 1709 cm−1 and the presence of epoxy (COC) groups at 1080 cm−1 demonstrated the successful oxidation process of CNTs (Fig. 2B). Besides, the presence of a highly intense conjugated CC peak at 1649 cm−1 endorsed the complete oxidation process with the retained structure of carbon nanotubes. The nanohybrid GO-OCNTs showed similar functional groups of GO and O-CNTs (Fig. 2C). Crosslinking of carboxyl groups (COO−) of GO and O-CNTs via Ca2+ ions was confirmed by the decay of asymmetric and symmetric COO− peaks and the simultaneous development of a carbonyl (CO) peak, as observed in Fig. 2C.
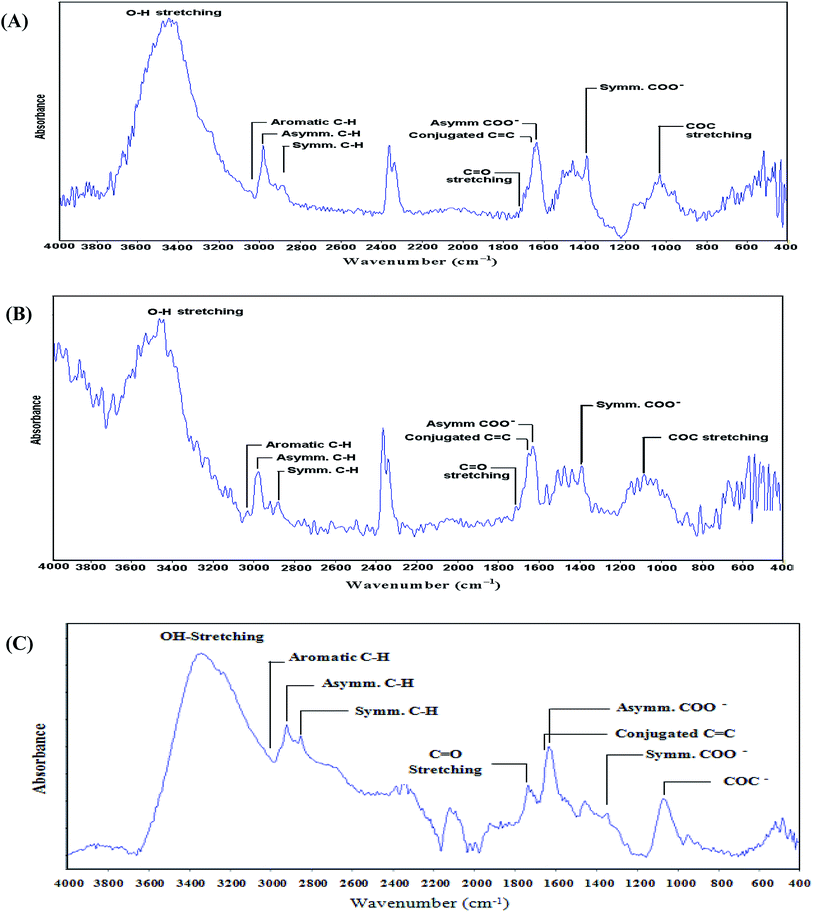 |
| | Fig. 2 FTIR absorbance spectra of (A) graphene oxide (GO), (B) oxidized carbon nanotubes (O-CNTs) and (C) nanohybrid GO-OCNTs. | |
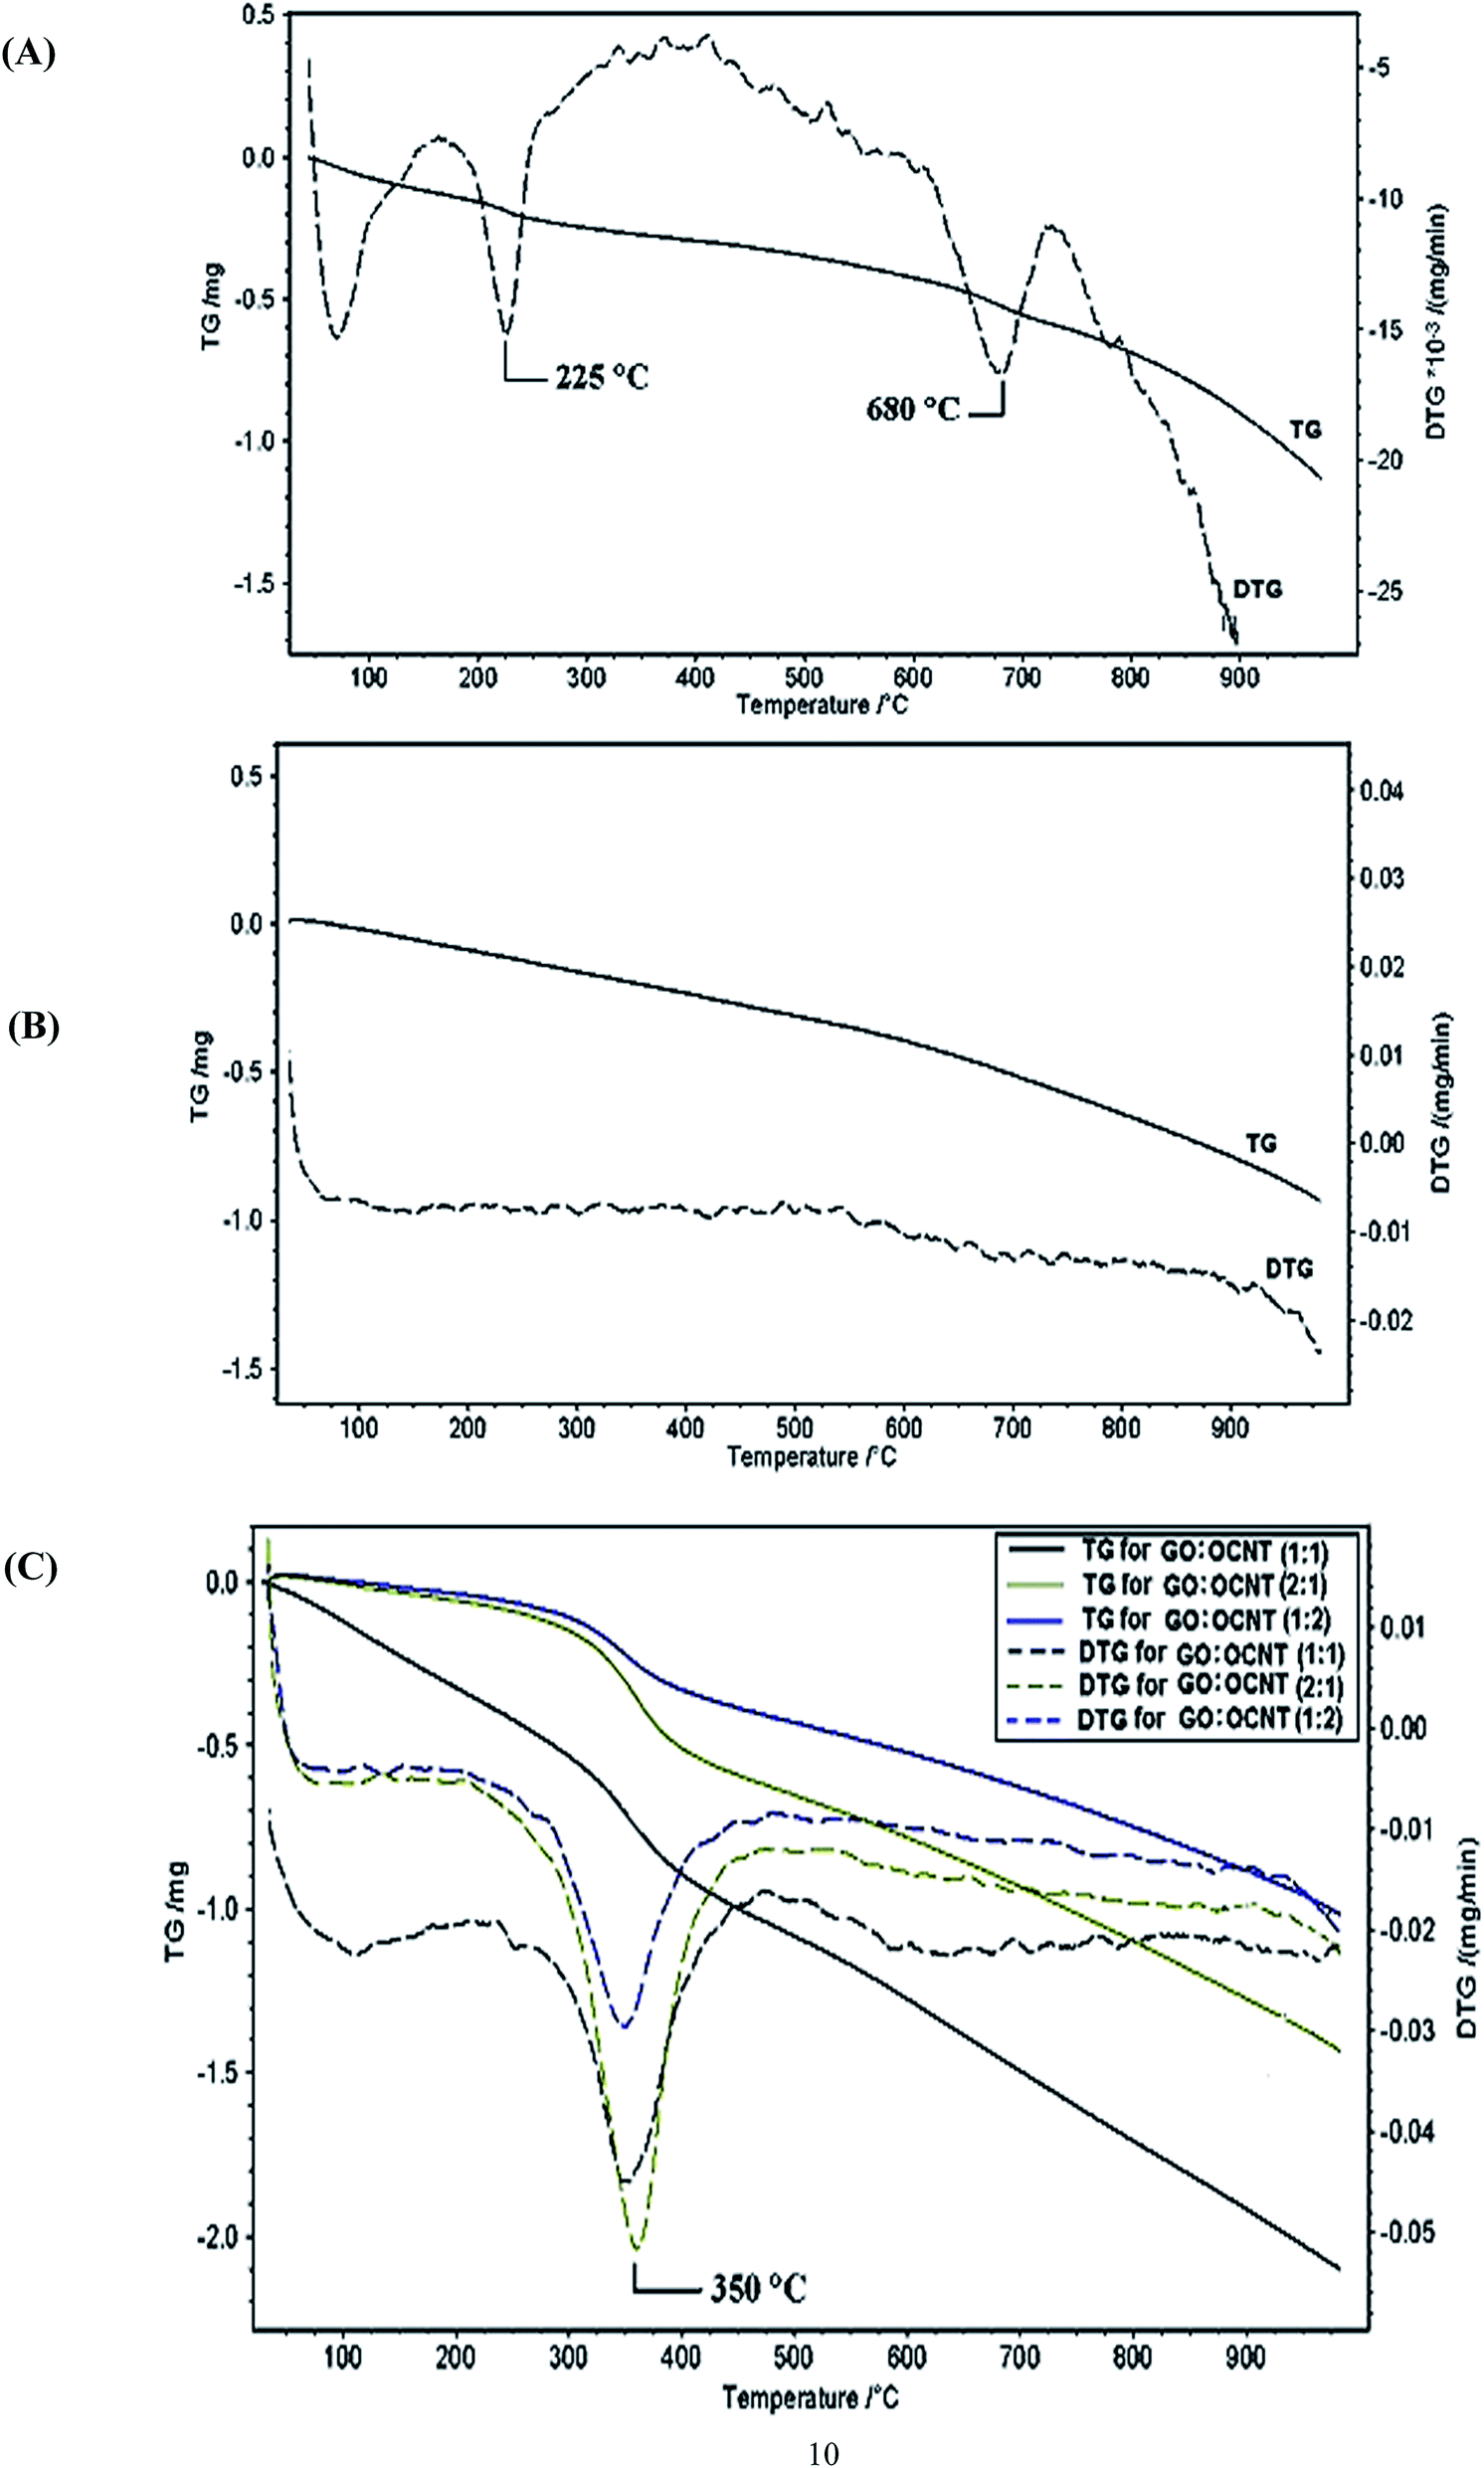
Thermal stability. Thermogravimetric analysis technique (TG) measures the endurance of samples when exposed to elevated temperatures until decomposition occur. Therefore, decomposition temperature exhibits the thermal stability of the sample. Fig. 3A shows the thermogravimetric analysis (TGA) curves and its derivative thermogravimetry (DTG) thermograms for graphene oxide. Two decomposition temperatures of GO were observed at 225 °C and 680 °C, respectively. The peak below 100 °C was attributed to adsorbed water on the surface of GO, which immediately evaporated as soon as heating started. The peak at 225 °C was attributed to pyrolysis of labile oxygen functional groups like CO, CO2 gases and steam.45–47 Consequently, the decomposition peak at 680 °C was attributed to mass destruction and pyrolysis of the carbon skeleton of graphene oxide.48 However, oxidized carbon nanotubes display nearly steady resistance for decomposition up to 900 °C, as observed in the DTG thermogram (Fig. 3B). The high resistance for degradation demonstrated the absence of disordered carbon responsible for degradation and confirmed robust carbon skeleton during the heating process, which result in high thermal stability of oxidized carbon nanotubes samples.49 It also indicated that the oxidation process took place on the outer surface of carbon nanotubes as evidenced in the FTIR spectra. Nanohybrid GO-OCNTs displayed onset decomposition at 250 °C and its end at 450 °C with a decomposition temperature of 350 °C for different GO-to-O-CNT ratios (Fig. 3C). Upon crosslinking of COO− groups of GO sheets with COO− groups of O-CNT cylinders, the decomposition temperature of the labile oxygen functional groups in GO shifted from 225 °C (Fig. 3A) to 350 °C (Fig. 3C), and moreover, the decomposition peak at 680 °C disappeared in the nanohybrid samples. This clearly demonstrate that GO sheets became more thermally stable due to self-crosslinking and crosslinking with O-CNTs cylinders regardless of the ratio of GO to O-CNTs in the nanohybrid structures.
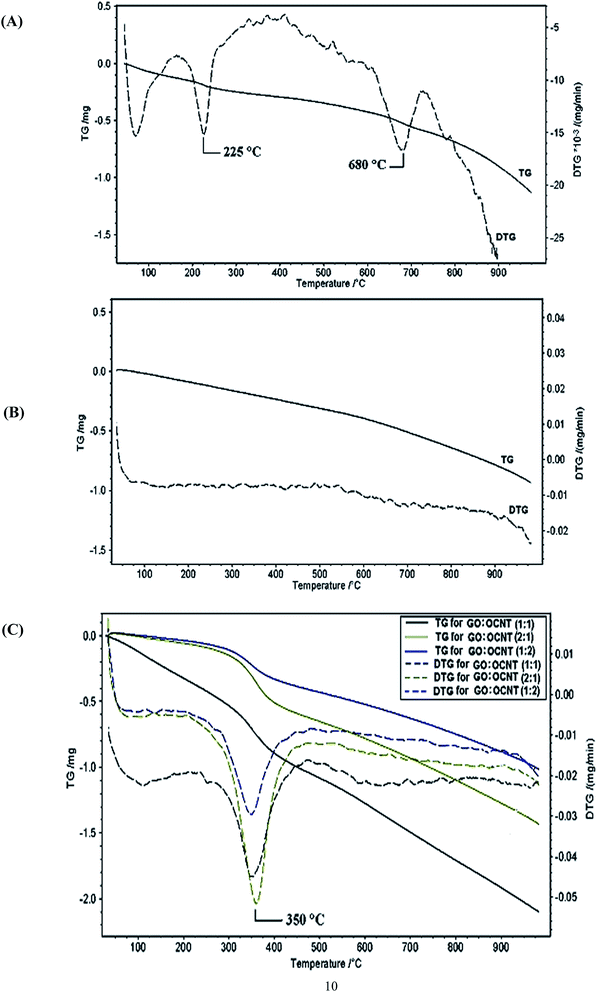 |
| | Fig. 3 TG and DTG thermograms of (A) graphene oxide (GO), (B) oxidized carbon nanotubes (O-CNTs), and (C) nanohybrid GO-OCNTs (1:1, 1:2 and 2:1 ratios). | |
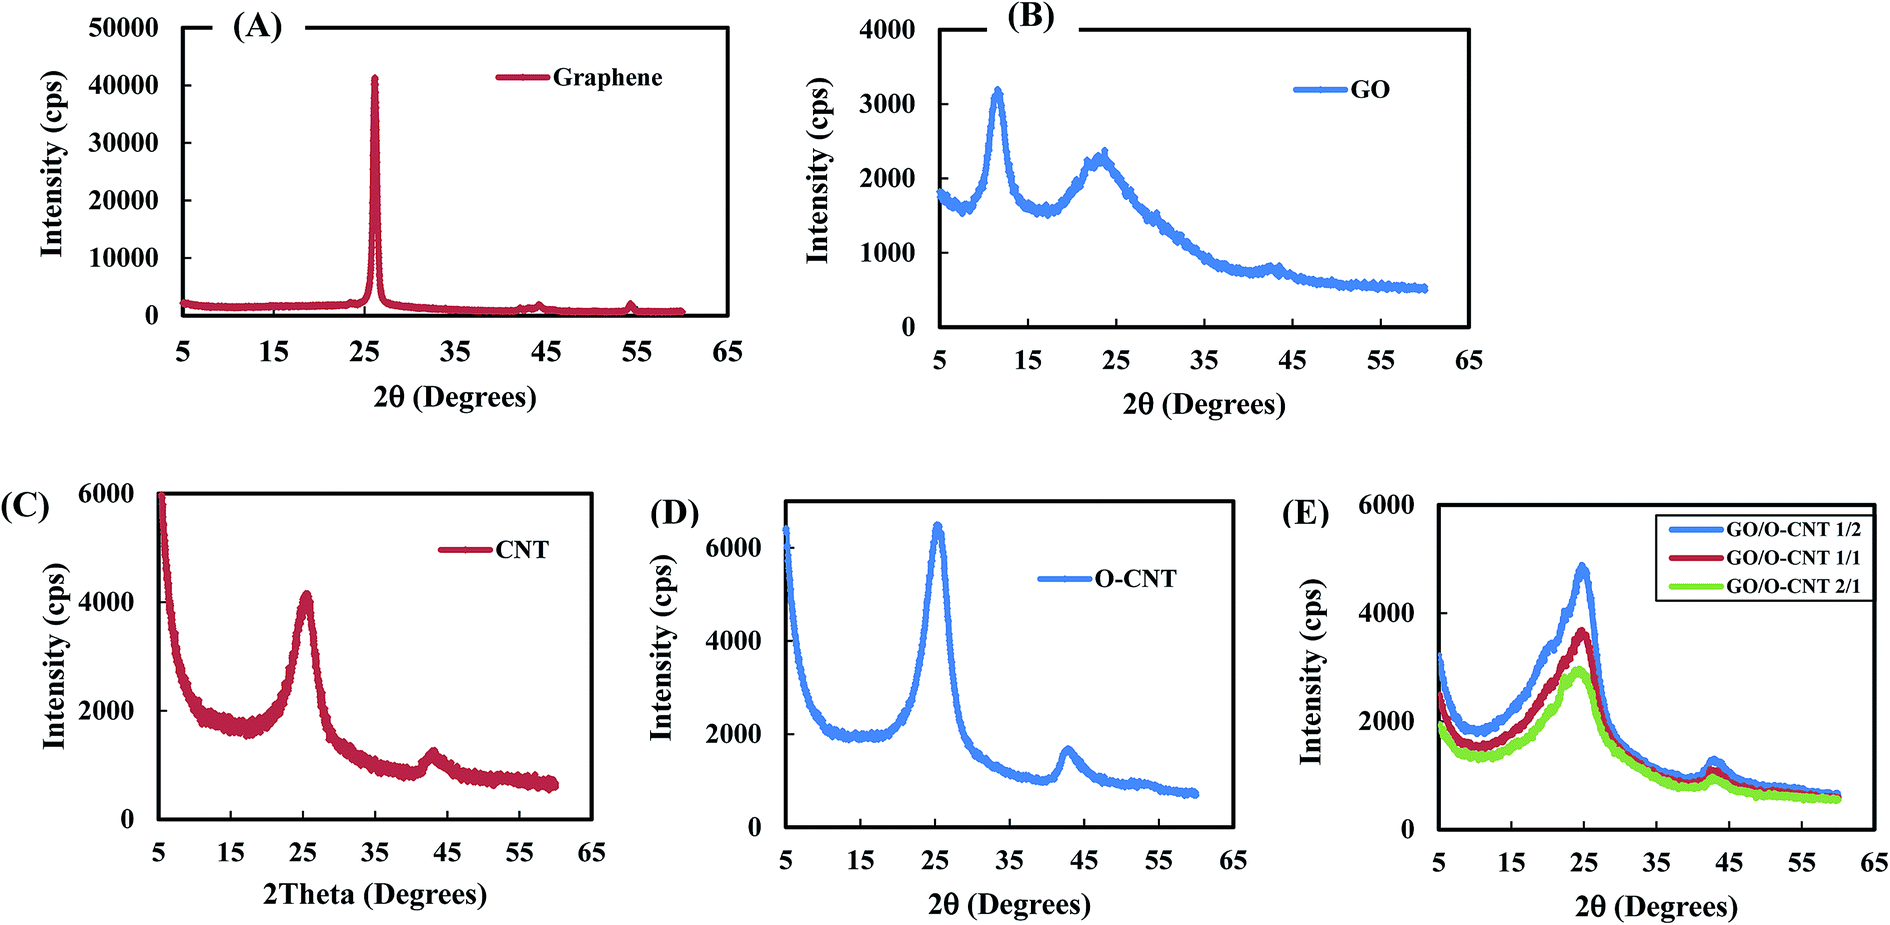
Crystal structure. X-ray diffraction (XRD) patterns were used to identify the crystal structure. Bragg's equation was used to calculate the interlayer spacing in crystalline peaks of graphene, graphene oxide, carbon nanotubes (CNTs), oxidized carbon nanotubes (OCNTs) and nanohybrid GO-OCNTs as depicted in Table 1. A characteristic sharp (002) diffraction peak of graphene at 26.14° corresponds to hexagonal crystalline graphite50 and an interlayer spacing of 3.4 Å between graphene nanosheets, as depicted in Fig. 4A. However, GO exhibited two peaks at 11.55° and 23.00°, which correspond to hexagonal crystalline graphite and an interlayer spacing of 7.7 Å and 3.9 Å between GO nanosheets (Fig. 4B). The interlayer spacing between crystalline layers change with the level of oxidation, and a higher level of oxidation yields different functional groups on the surface of GO and subsequently large interlayer spacings between nanosheets.51,52 The presence of broad peaks with wide interlayer spacing values confirms the presence of irregular disordered structures of oxygen functional groups like hydroxyl, epoxy and carboxyl on the surface of GO. In addition, CNTs have two peaks at 2θ angles 25.66° and 43.38° representing the (002) hexagonal graphite and (100) diffraction of graphite peaks.53 Similarly, O-CNTs have the same two peaks appearing in CNTs with higher intensity values (Fig. 4C and D). The increment in the intensity of peaks for O-CNTs was attributed to successful oxidation process, and similar peak angles for CNTs and O-CNTs demonstrate that the crystal structure was not affected by the oxidation process.43 Our nanohybrid GO-OCNTs show two diffraction peaks 24.7° and 42.9° regardless of the ratio of GO to OCNTs (Fig. 4E). These peaks correspond to the (002) and (100) crystal planes.54 The broadening of diffraction peaks of nanohybrid GO-OCNTs was attributed to the loss of crystallinity and disordered structure during the oxidation process and to the large exfoliation during the formation of nanohybrids.52,55
Table 1 Crystal structure parameters of graphene, GO, CNTs, OCNTs, and nanohybrid GO-OCNTs (1:2 ratio)
| Nanomaterials |
Intensity (cps) |
2θ (degrees) |
Interlayer spacing (d) (Å) |
| Graphene |
41300 |
26.14 |
3.4 |
| GO |
3197 |
11.55 |
7.7 |
| 2307 |
23.00 |
3.9 |
| CNTs |
4158 |
25.24 |
3.5 |
| 1265 |
42.76 |
2.1 |
| OCNTs |
6494 |
25.24 |
3.5 |
| 1666 |
42.76 |
2.1 |
| Nanohybrid GO-OCNTs |
4893 |
24.7 |
3.6 |
| 1311 |
42.9 |
2.1 |
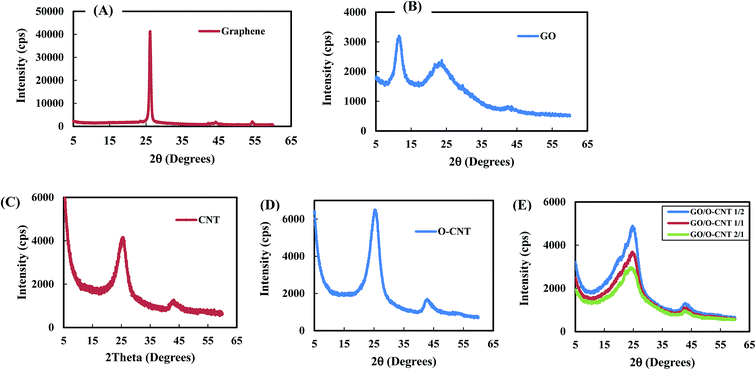 |
| | Fig. 4 XRD patterns of (A) graphene, (B) graphene oxide (GO), (C) carbon nanotubes (CNTs), (D) oxidized carbon nanotubes (OCNTs) and (E) nanohybrid GO-OCNTs (1:1, 1:2 and 2:1 ratios). | |
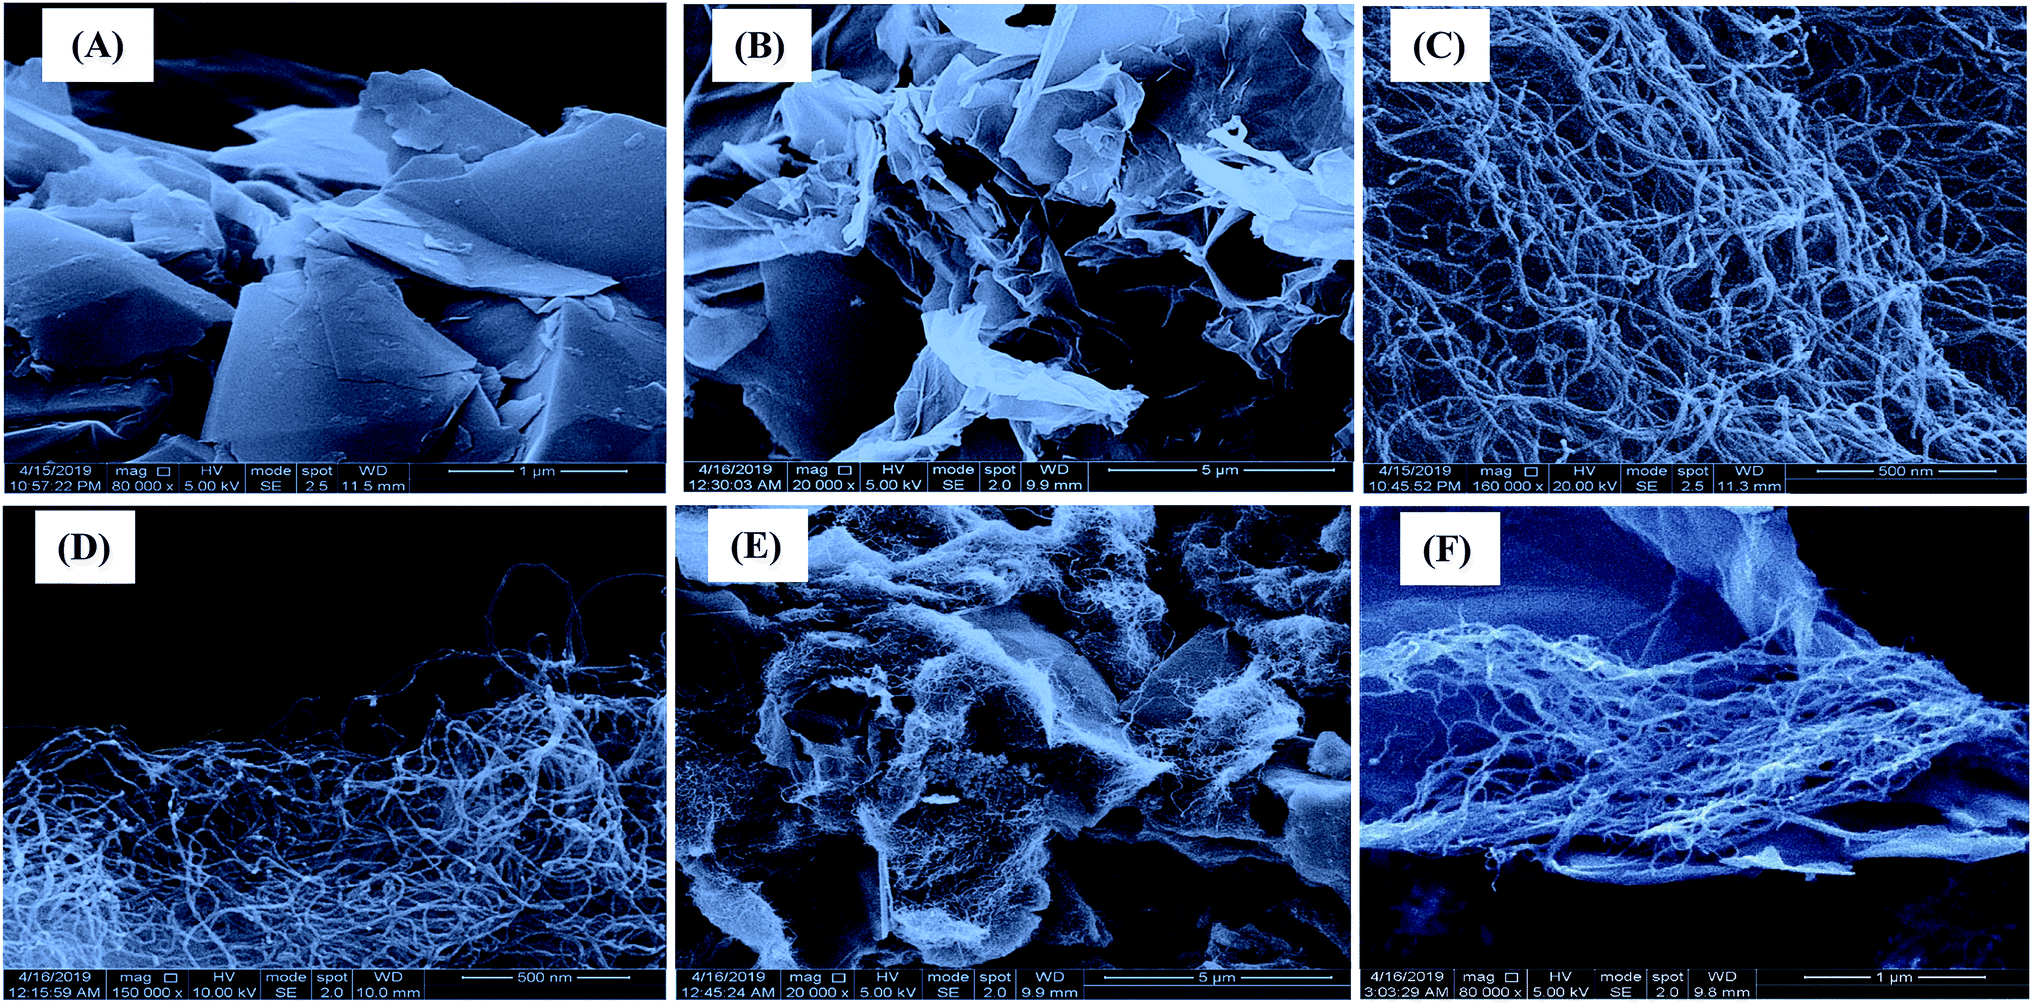
Morphologic structure. Scanning electron microscope (SEM) technique was used to evaluate the morphological changes of compounds on the micro- or nano-level scale. Powder graphene (Fig. 5A) shows micro-scale sheets and layers with 1–2 mm flake size and different flake thicknesses that were accumulated one above the other, whereas graphene oxide (Fig. 5B) shows exfoliated flakes formed during the oxidation process. The thin GO flakes hold hydroxyl, carboxyl, and epoxy functional groups in the inner and outer surfaces of the flakes. However, oxidized multi-walled carbon nanotubes (OCNTs) show cylindrical-shaped nanotubes that hold hydroxyl, carboxyl, and epoxy functional groups on their surfaces (Fig. 5D). When cylindrical oxidized carbon nanotubes crosslinked with sheets of graphene oxide (GO) through Ca2+ ions, the carboxyl groups of GO and OCNTs bound through calcium ions and therefore the threads of OCNTs were settled down on the surface of the GO sheets leading to the formation of nanohybrid GO-OCNTs as observed (Fig. 5E). Similarly, in the 1:4 ratio of nanohybrid GO-OCNTs, the threads of OCNTs could make self-crosslinks and crosslinks with the surface of the GO sheet via a calcium ion crosslinking agent (Fig. 5F).
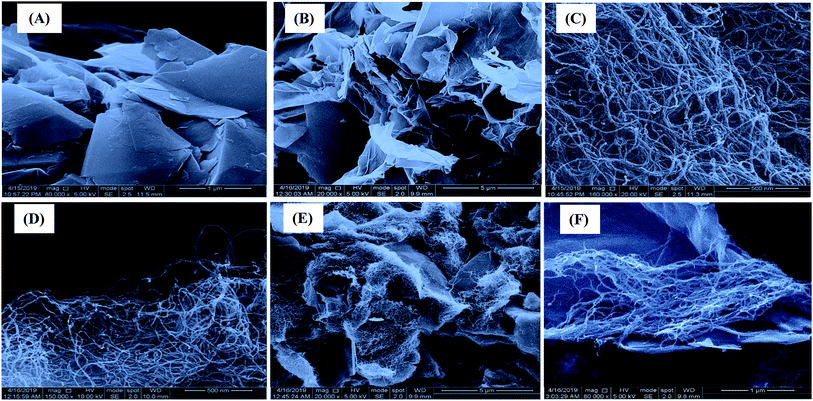 |
| | Fig. 5 Scanning electron microscopic images of (A) graphene, (B) graphene oxide (GO), (C) carbon nanotubes (CNTs), (D) oxidized carbon nanotubes (OCNTs), (E) nanohybrid GO-OCNTs (1:1) and (F) nanohybrid GO-OCNTs (1:4). | |
Optimization conditions
The experiments on optimization conditions were designed to determine the optimum conditions and parameters for ultimate elimination of ranitidine in aqueous solutions using the synthesized nanohybrid GO-OCNTs. These conditions included: contact time, nanohybrid mass, solution temperature, solution pH, % crosslinking agent (CaCl2), and the ratio of GO to OCNT in the nanohybrid structure.
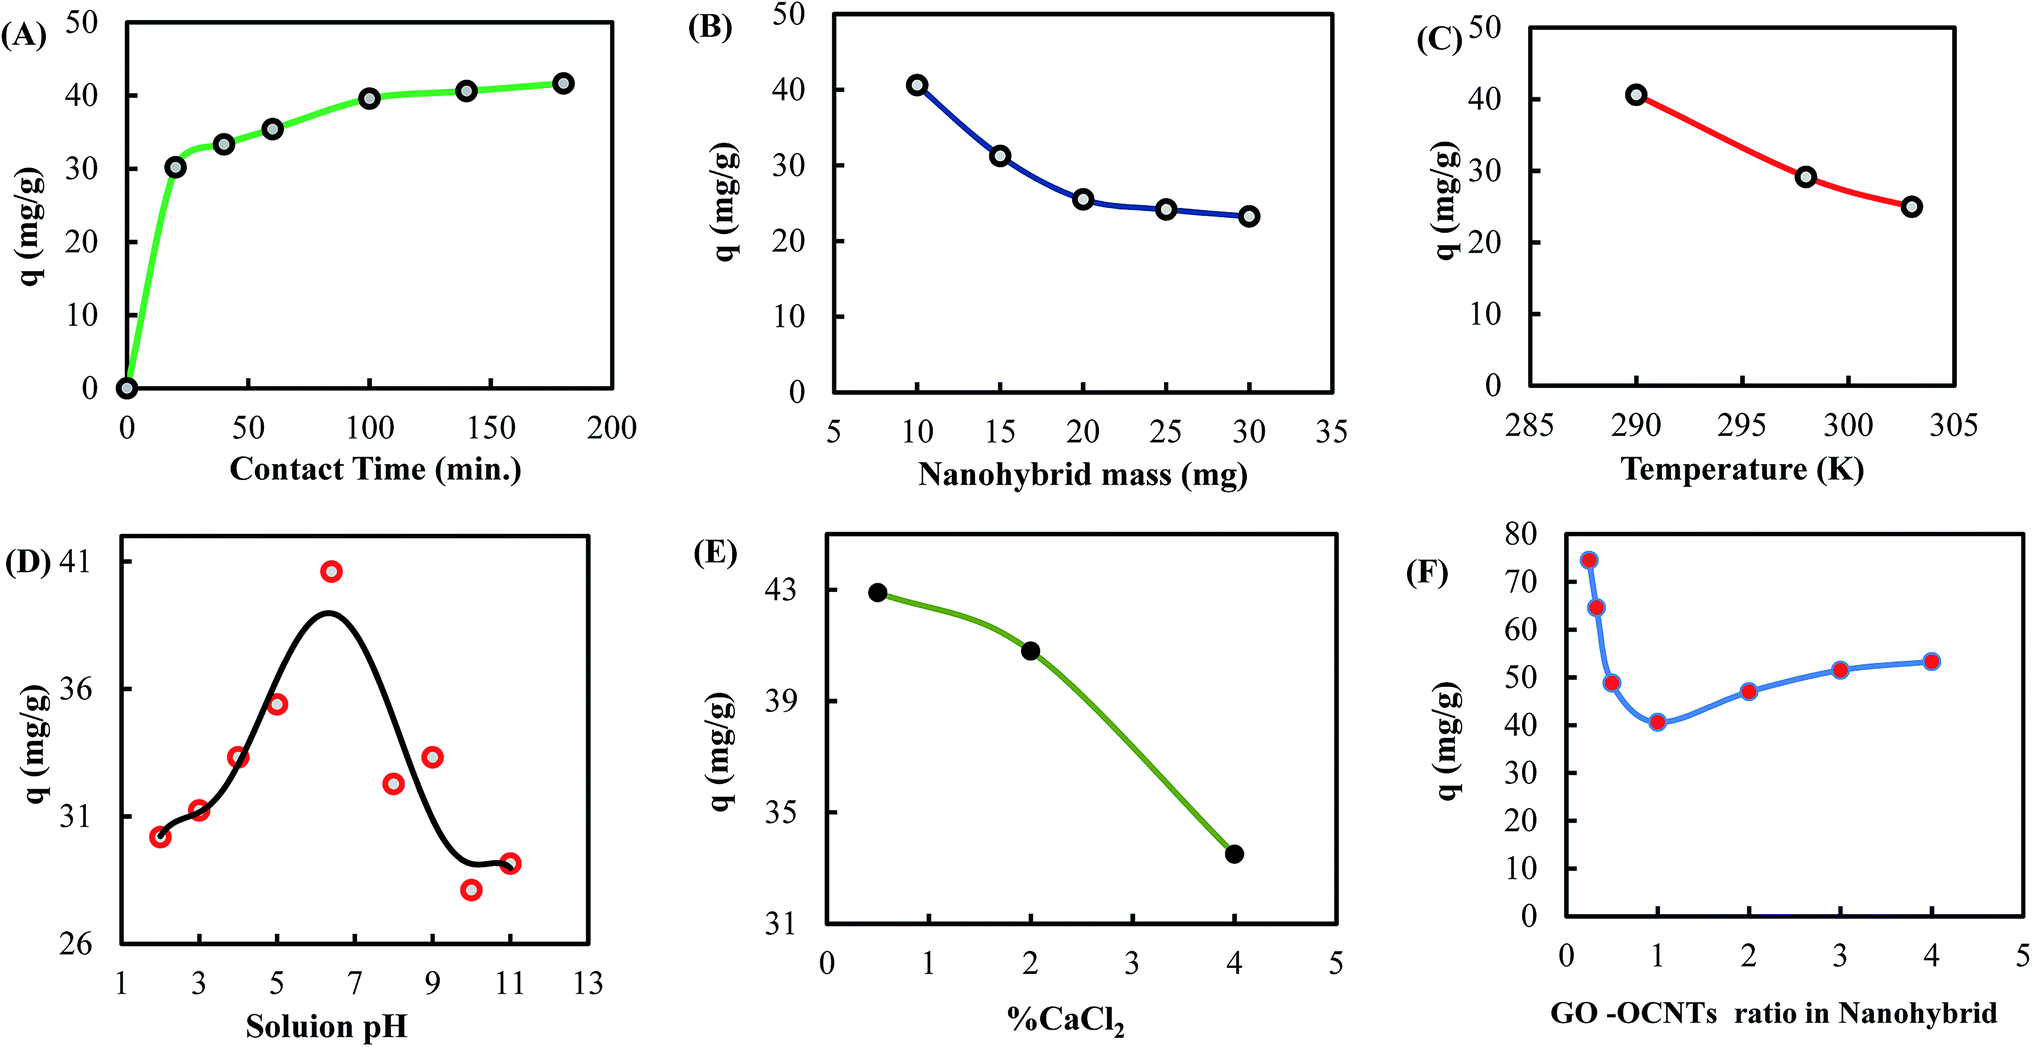
Contact time, nanohybrid mass, and solution temperature. The effects of contact time, nanohybrid mass and solution temperature were studied for the removal of ranitidine in aqueous solutions, and the results are shown in Fig. 6A–C, respectively. Fig. 6A shows that the ranitidine uptake increased exponentially in the first 100 minutes until equilibrium was established. At the beginning, rapid ranitidine drug uptake occurred due to the presence of many vacant sites for adsorption with the absence of internal resistance for diffusion.56 After 100 minutes, slow ranitidine uptake was observed due to saturation of vacant sites and slow diffusion to less accessible adsorbent sites.57,58 It was found that the time of 140 minutes was the optimum contact time, where the maximum uptake was obtained.
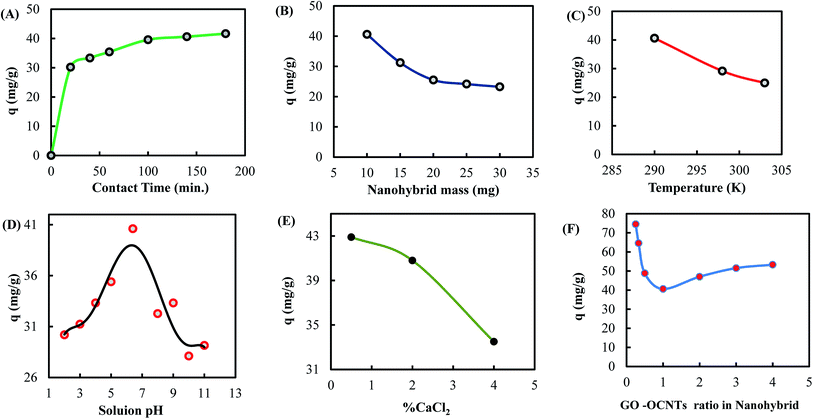 |
| | Fig. 6 Effects of (A) contact time (pH = 6.4, solution volume = 50 mL, nanohybrid mass = 10 mg, temperature = 17 °C, GO-OCNTs ratio = 1/1, % CaCl2 = 2.0%), (B) nanohybrid mass (pH = 6.4, solution volume = 50 mL, contact time = 140 min, temperature = 17 °C, GO/O-CNT ratio = 1/1, % CaCl2 = 2.0%), (C) temperature (pH = 6.4, solution volume = 50 mL, contact time = 140 min, temperature = 17 °C, GO/O-CNT ratio = 1/1, % CaCl2 = 2.0%), (D) solution pH (contact time = 140 min, solution volume = 50 mL, contact time = 140 min, temperature = 17 °C, GO/O-CNT ratio = 1/1, % CaCl2 = 2.0%), (E) % crosslinker (pH = 6.4, solution volume = 50 mL, contact time = 140 min, nanohybrid mass = 10 mg, temperature: 17 °C, GO/CNT ratio: 1/1), and (F) GO/O-CNT ratio in the hybrid (pH = 6.4, solution volume = 50 mL, contact time: 140 min, nanohybrid mass = 10 mg, temperature = 17 °C, % CaCl2 = 2.0%). | |
Fig. 6B shows that the uptake of ranitidine with 10 mg of the synthesized nanohybrid adsorbent was double of that with 20 mg. Apparently, this indicates that with higher amounts of nanohybrid mass, chains of GO and OCNTs form intermolecular interactions, accumulate one above the other and many of the active sites were veiled and hidden, which limited drug uptake.
Fig. 6C shows the effect of temperature on ranitidine removal. This figure indicates that as the temperature increased, the ranitidine uptake decreased. This could be attributed to the increased kinetic energy of the surface of nanohybrid GO-OCNTs and the ranitidine molecules in the solution, which weakened the adsorption and reduced the adsorbent–adsorbate interactions.59
Effect of solution pH, % crosslinking agent, and GO-to-OCNT ratio. The effect of solution pH on ranitidine removal was conducted in the pH range 2–11, and the results are depicted in Fig. 6D. Although the influent pH range for WWTPs in Jordan is 7–8,60 the pH effect was studied for scientific investigation. Fig. 6D shows that the maximum ranitidine uptake was obtained at pH 6.4. The adsorption of ranitidine on the surface of nanohybrid GO-OCNTs depends on dissociation constant (pKa) of ranitidine and on the surface charge of the adsorbent. Ranitidine has two pKa values 2.7 and 8.2,61 and the point of zero charge (pHPZC) for GO prepared using Hummers method was 3.8 (ref. 62) and that for O-CNT was 4.69.63 At pH < 2.7, ranitidine will be protonated and will have a cationic charge, and the surface of the nanohybrid adsorbent will be positively charged due to pH < pHPZC. Thus, adsorption becomes un-favored due to repulsion. Similarly, at pH > 8.2 ranitidine surface holds anionic charges, and the nanohybrid surface holds negative charges due to pH > pHPZC, and hence unsuccessful adsorption occurs due to repulsion. However, at pH 4–7, the ranitidine surface holds a neutral charge and the surface of the nanohybrid adsorbent has zero charge and thus maximum drug adsorption took place due to H-bonding and dipole–dipole interactions.Since calcium ions have a high capability to form bonds with oxygen, the functional groups of calcium chloride were used as crosslinkers.64 The effect of crosslinker concentration of CaCl2 in the nanohybrid on ranitidine removal was investigated, and the results are shown in Fig. 6E. Fig. 6E shows that increasing the concentration of CaCl2 (in %) in the nanohybrid backbone structure revealed a large decline in the ranitidine uptake due to the formation of small-sized nanochannels of GO networks that eliminate water sorption65 and necessarily prevent larger molecules like ranitidine from being adsorbed on the inner layers of the nanohybrid adsorbent. Furthermore, the ratio of GO to OCNTs in the nanohybrid has provided different microstructures that revealed different ranitidine uptakes, as described in Fig. 6F. Fig. 6F shows that maximum ranitidine uptake took place using 1:4 GO-to-OCNT ratio in the nanohybrid. Apparently, the 1:1 ratio of GO to OCNTs in the nanohybrid showed minimum drug uptake due to cooperatively strengthened OH⋯OC hydrogen bonds that assemble OCNT cylinders on GO sheets,66 as observed in SEM images (Fig. 5D and E). The alignment of the OCNT cylinders on the surface of GO sheets might decrease the surface area for adsorption compared to free OCNTs and GO sheets and subsequently decrease drug uptake. However, maximum ranitidine uptake of 97.8 mg g−1 was obtained using 1:4 ratio and 200 mL volume, which was attributed to more free OCNT cylinders with a larger surface area for adsorption and less crosslinked OCNT cylinders on the surface of GO sheets.
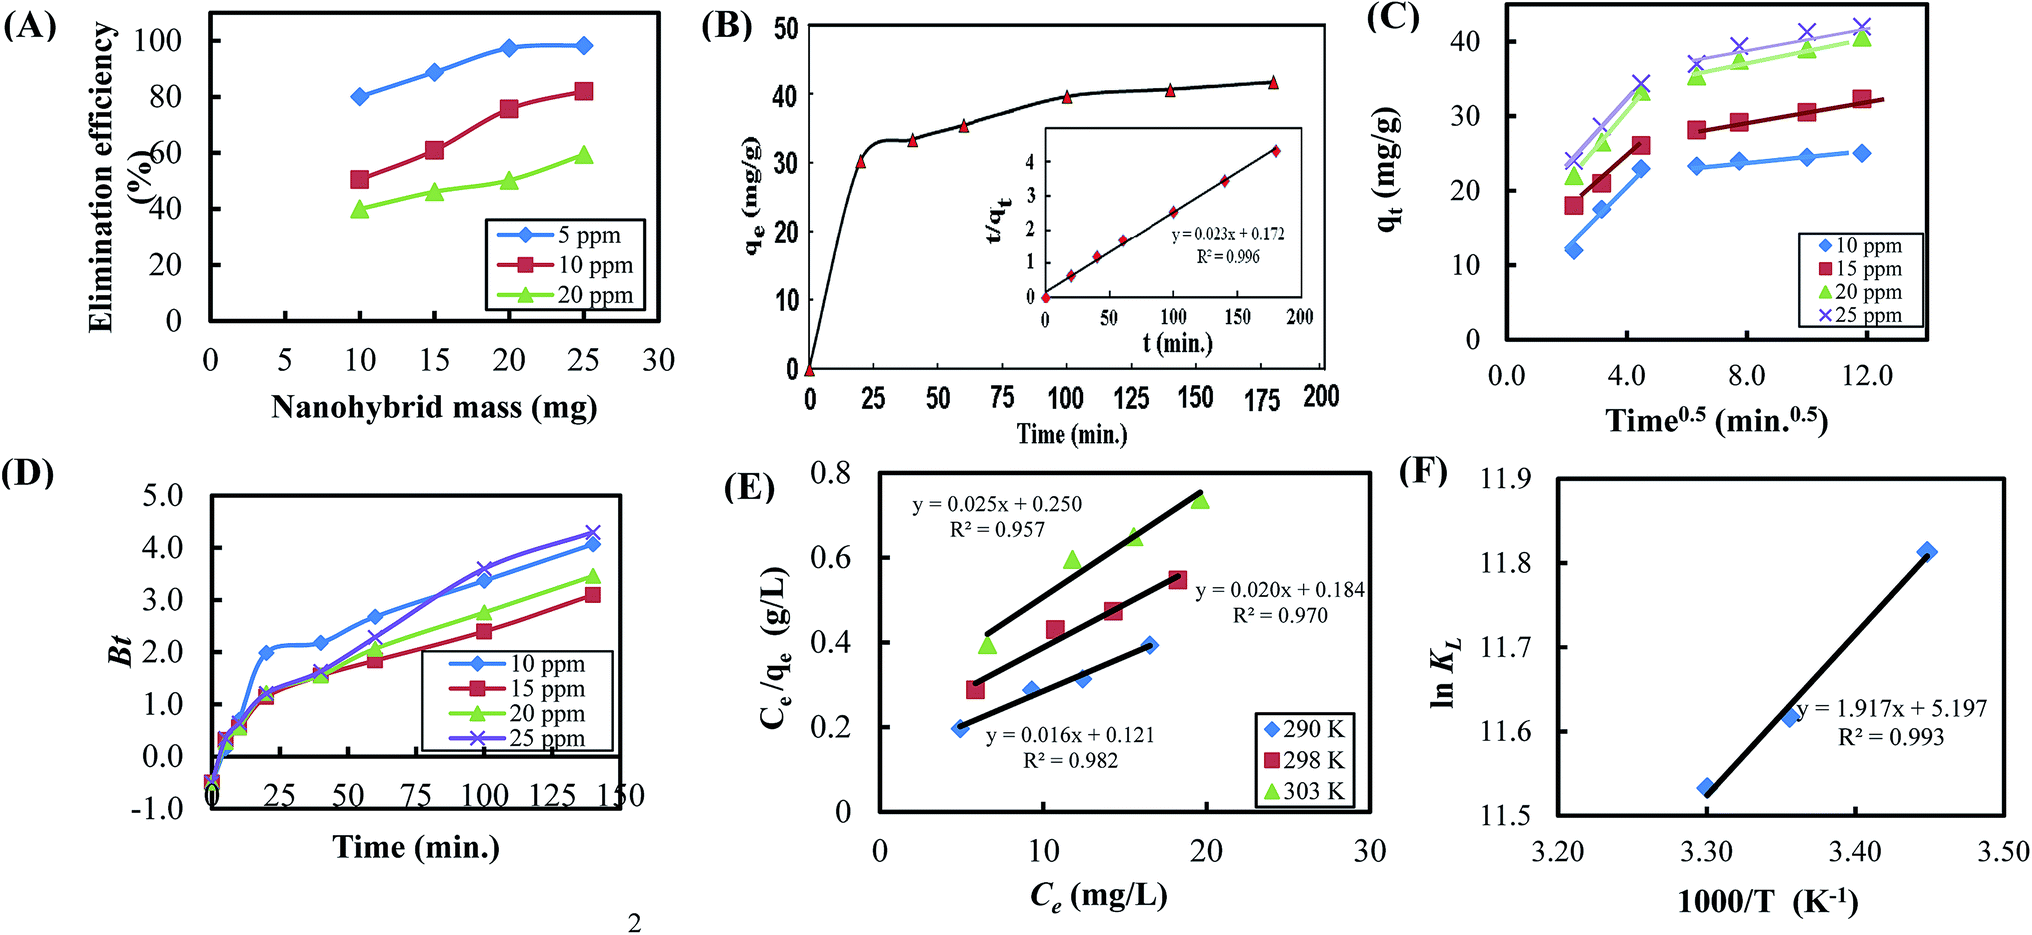
Entire elimination of ranitidine. The entire elimination of the drug is an extremely substantial aspect in this study. The continuous presence of drugs, even at very low concentrations, in domestic water can lead to deactivation of the immunological system in human body and enormous and catastrophic number of deaths.67 To investigate the entire elimination of ranitidine, different initial concentrations of ranitidine (5–20 ppm) and different nanohybrid masses (10–25 mg) were used, and the results are shown in Fig. 7A. The maximum efficiency for the entire removal was 98.3% using the following optimum conditions: [ranitidine] = 5.0 ppm, nanohybrid mass = 25 mg, solution pH = 6.4, solution volume = 50 mL, contact time = 140 minutes, solution temperature = 17 °C, GO-to-OCNT ratio = 1:1, and [CaCl2] = 2%. To the best of our knowledge, we demonstrate the highest drug uptake of ranitidine from aqueous solutions, as shown in Table 2.
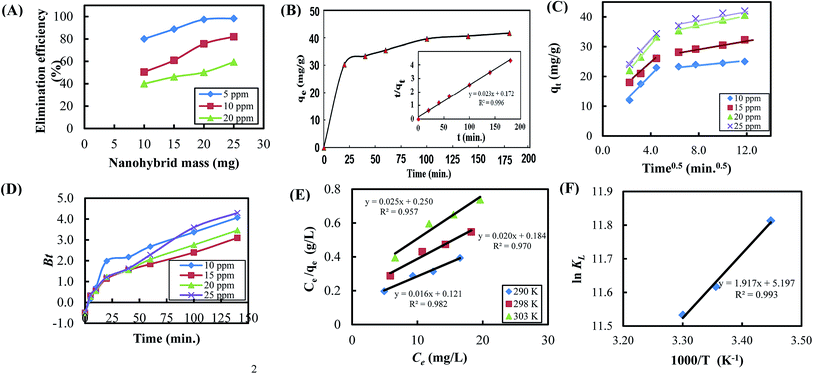 |
| | Fig. 7 (A) Effect of adsorbent mass on the removal efficiency (%) of ranitidine on GO-OCNT over different initial concentrations (pH = 6.4, volume: 50 mL, time = 140 minutes, temperature = 17 °C, GO-to-OCNT ratio = 1/1, % CaCl2 = 2.0%). (B) Dynamic change of drug uptake (qe) versus time (t) and pseudo-second-order (inner curve) plots. (C) Intraparticle diffusion dynamic plots. (D) Boyd plot for various concentrations. (E) Langmuir adsorption isotherms at elevated temperatures. (F) Plot of ln KL versus reciprocal temperature (1/T). | |
Table 2 Maximum ranitidine uptake using different adsorbents
| Adsorbent |
Maximum uptake (mg g−1) |
Reference |
| Activated carbon |
13.3 |
68 |
| Graphene oxide |
3.96 |
69 |
| Graphene oxide |
25.0 |
70 |
| Natural cellulose |
32.9 |
71 |
| Na–magadiite |
81.8 |
72 |
| Nanohybrid GO-OCNTs |
97.8 |
This study |
Regeneration of nanohybrid nanocarriers
Batch adsorption experiments on regenerated adsorbent have demonstrated the possibility of reusing the synthesized nanohybrid GO-OCNTs for multiple adsorption–desorption processes. The average removal efficiency of the three tested samples of the regenerated adsorbent was only reduced by 5.0% compared to the original fresh adsorbent (40.6 to 39, 40.3 to 38.5, and 41 to 39) mg g−1 respectively. This also reflects the high structural stability of the nanohybrid adsorbent against continuous washing with basic aqueous solutions.
Dynamics of removal of ranitidine
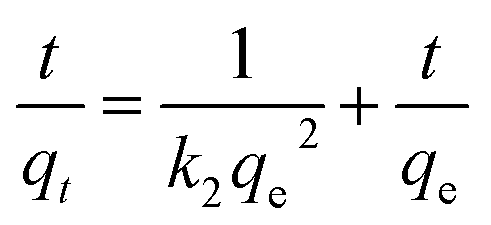
Different models can be used to analyze the dynamics of the adsorption process. These dynamics models include kinetics and mass transfer models. The pseudo-second-order equation, which is given by eqn (2), is the most common kinetics model that can be used to analyze the adsorption process:| |
 | (2) |
where qe is the equilibrium drug uptake (in mg g−1), qt is the drug uptake at time t (in mg g−1), k2 is the rate constant of removal (in g mg−1 min−1), and t is the time (in min).73 By plotting t/qt against time t, the equilibrium drug uptake (qe) and the rate constant of removal (k2) can be determined. Fig. 7B shows the application of eqn (3) to the adsorption of ranitidine on the synthesized adsorbents. From the slope and intercept of the straight line in Fig. 7B, the calculated equilibrium drug uptake (qe) was 43.5 mg g−1 and the rate constant of removal (k2) was 3.08 × 10⁻³ g mg−1 min−1 with a correlation coefficient (R2) of 0.996. These results indicated that the pseudo-second-order model can be used to describe the kinetics of the adsorption of ranitidine on the synthesized nanohybrid GO-OCNTs. Furthermore, the mechanism of drug adsorption on the surface of the nanohybrid GO-OCNTs was tested and validated using the intraparticle diffusion model, given in eqn (3).74where kp is the intraparticle diffusion constant (in mg g−1 min−0.5) and C is the adsorption constant (in mg g−1). Plots of qt versus t1/2 (Fig. 7C) for the adsorption of ranitidine on the synthesized GO-OCNTs showed two different slope straight lines, which suggest intraparticle diffusion mechanism and advocate that many steps manage the overall drug removal process.75 The expected steps include rapid external pore diffusion (film diffusion) and slow sorption on the internal pore surface of the nanohybrid adsorbent (pore diffusion).76
The Boyd model77 was used to determine the rate controlling step of adsorption process78 as follows:
| |
 | (4) |
| | |
Bt = −0.4977 − ln(1 − F)
| (5) |
where
F is the equilibrium fractional attainment calculated from
qe and
qt values,
B is the time constant (in 1/min), and
Bt is calculated from
eqn (6). According to the Boyd model, the plot of
Bt versus t that makes a straight line and passes through the origin point is a straight evidence that the adsorption process is controlled by the intraparticle diffusion mechanism. Otherwise, the film diffusion step is the rate-determining step. According to our results, straight lines of all drug uptakes did not pass through the origin point, which suggest that the elimination process was controlled by the rapid external pore diffusion (film diffusion step).
75,79
Adsorption isotherms
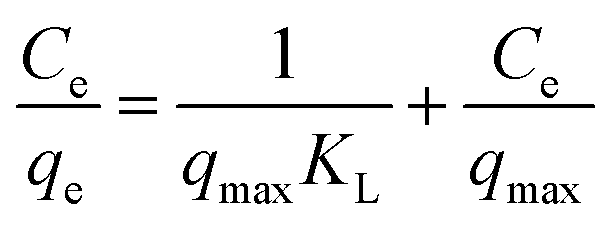
Adsorption isotherms describe the variation in the amount of drug adsorbed on the surface of nanohybrid nanocarriers at constant temperature. The surface area and pore structure of the adsorbent play a significant role in the determination of the amount of drug adsorbed. Herein, three adsorption isotherm models were applied to our data: Langmuir, Freundlich, and Temkin. The linearized form of the Langmuir isotherm is given by the equation:| |
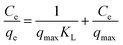 | (6) |
where qmax is the maximum amount of drug adsorbed by a complete monolayer, qe is the equilibrium drug uptake (mg g−1), Ce is the equilibrium concentration of drug (mg L−1), and KL is the equilibrium constant of adsorption (L kg−1). The plot of Ce/qe versus Ce forms a linear curve, for which the constants qmax and KL were calculated, respectively.74 Table 3 shows the Langmuir parameters along with the correlation coefficients (R2). Langmuir adsorption isotherm for the ranitidine elimination at various temperatures is shown in Fig. 7E. Maximum drug uptake was found to decrease from 62.5 to 40 mg g−1 as the temperature rose from 290 to 303 K. Similarly, equilibrium constant values decreased as the temperature increased (Table 3). Clearly, as the temperature increased, kinetic energy of drug molecules increased and the kinetic energy of the surface of the nanohybrid adsorbent increased, which weakened the adsorption process and led to less drug molecules adsorbed on the hot nanohybrid surface.
Table 3 Various elimination adsorption isotherm parameters of ranitidine
| Isotherm |
Adsorption parameters |
Temperature (°C) |
| 30.0 |
17.0 |
25.0 |
| Langmuir |
qmax (mg g−1) |
62.50 |
50.00 |
40.00 |
| KL (L mg−1) |
0.132 |
0.109 |
0.100 |
| R2 |
0.982 |
0.970 |
0.957 |
| Freundlich |
1/n |
0.446 |
0.441 |
0.430 |
| KF (mg(1−1/n) L(1/n)) g−1) |
12.26 |
9.150 |
7.240 |
| R2 |
0.979 |
0.981 |
0.965 |
| Temkin |
KT (L mg−1) |
1.100 |
0.940 |
0.890 |
| bT |
165.5 |
215.4 |
278.2 |
| BT (J mol−1) |
14.57 |
11.50 |
9.050 |
| R2 |
0.972 |
0.963 |
0.944 |
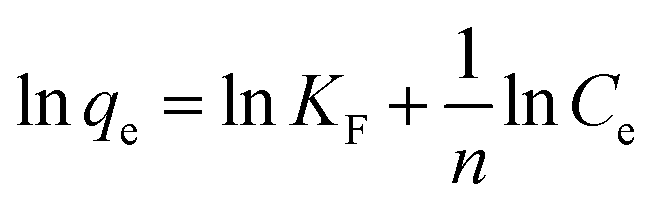
The linearized form of the Freundlich isotherm is given by the following equation:
| |
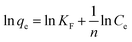 | (7) |
where
qe is the equilibrium uptake (mg g
−1),
KF is the Freundlich constant related to adsorption capacity ((mg
(1−1/n) L
(1/n)) g
−1),
Ce is the equilibrium concentration of drug (mg L
−1), and
n is the heterogeneity factor.
80 In order for the Freundlich equation to be valid, the plot of ln
qe versus ln
Ce should give a linear curve.
74
For the Temkin model, the linear form is given by the following equation:
where
qe is the equilibrium uptake (mg g
−1),
BT =
RT/
bT where
bT is the Temkin constant related to the heat of adsorption (J mol
−1),
R is the universal gas constant (8.314 J mol
−1.K),
T is the temperature (K),
Ce is the equilibrium concentration of drug (in mg L
−1), and
KT is the maximum binding energy constant (L mg
−1). In order for the Temkin equation to be valid, the plot of
qe versus ln
Ce should give a linear curve.
74
Thermodynamics of the adsorption process
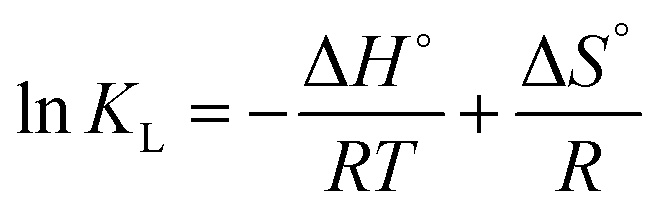
Thermodynamic parameters such as ΔG°, ΔH°, and ΔS° give deeper insights into the type of adsorption and elimination, exothermic or endothermic behavior, and entropic change processes that can take place during the adsorption of the drug on the nanohybrid surface. Gibbs free energy (ΔG°) can be calculated from ΔG° = ΔH° − TΔS° and ΔG° = −RTlnKL. Rearrangement of these equations yields a linearized form of the equation:| |
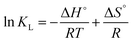 | (9) |
where KL is the equilibrium constant determined from Langmuir adsorption isotherms, R is the universal gas constant (8.314 J mol−1 K−1), and T is the temperature of adsorption (in K). Plot of lnKL versus reciprocal temperature (1/T) gives the enthalpy change (ΔH°) and entropy change (ΔS°) from slope and intercept, respectively, as described in Fig. 7F.81 Obviously, exothermic ΔH° value indicates the bond formation at the interface, which resulted from the successful adsorption of ranitidine on the surface of the nanohybrid adsorbent. Moreover, positive ΔS° value indicates the entropy increase as a result of the adsorption process.82 The adsorption process is said to be physisorption when the ΔG° value is between 0 and –20 kJ mol−1 and chemisorption when the value is between −80 and −400 kJ mol−1.83 Our results described in Table 4 suggest that the adsorption of ranitidine on the surface of nanohybrid composites was physisorption type.
Table 4 Elimination thermodynamic parameters of ranitidine
| Temperature (°C) |
qmaxa (mg g−1) |
KLa |
ΔG° (kJ mol−1) |
ΔH° (kJ mol−1) |
ΔS° (J mol−1 K−1) |
| Equilibrium constant values determined from Langmuir adsorption isotherms. |
| 17.0 |
62.5 |
1.35 × 10⁵ |
−28.5 |
−15.94 |
+43.2 |
| 25.0 |
50.0 |
1.11 × 10⁵ |
−28.8 |
|
|
| 30.0 |
40.0 |
1.02 × 10⁵ |
−29.1 |
|
|
Conclusions
Various nanohybrid GO-OCNTs adsorbents were synthesized using graphene oxide (GO) and oxidized carbon nanotubes (OCNTs) crosslinked via calcium ions in a water-dispersed Tween-80 solution. The nanohybrid adsorbents were subjected to different characterization techniques: FTIR for chemical structure, TG and DTG for thermal stability, XRD for crystal structure, and SEM for morphological structure. The technical feasibility of the synthesized nanohybrid adsorbents was verified for the removal of ranitidine from aqueous solutions. Batch adsorption experiments proved successful technical feasibility with a maximum ranitidine uptake of 97.8 mg g−1. The experimental results fit the Langmuir, Freundlich, and Temkin isotherm models. Our results indicated that nanohybrid GO-OCNTs are superior nanohybrid adsorbents with a high elimination efficiency up to 98.3% and an ultimate ranitidine uptake of 97.8 mg g−1. It also displayed the pseudo-second-order model with intraparticle diffusion mechanism. The thermodynamic analysis of ranitidine adsorption on the surface of nanohybrid GO-OCNTs demonstrated the physisorption process and reflected the easy desorption process.
Conflicts of interest
There are no conflicts to declare.
Acknowledgements
The authors wish to acknowledge Deanship of Research, project number (49/2019), Jordan University of Science & Technology for financial support and facilities.
References
- K. Fent, A. A. Weston and D. Caminada, Ecotoxicology of human pharmaceuticals, Aquat. Toxicol., 2006, 76(2), 122–159 CrossRef CAS.
- N. A. Morin, N. Mazzella, H. P. H. Arp, J. Randon, J. Camilleri, L. Wiest, M. Coquery and C. Miège, Kinetic accumulation processes and models for 43 micropollutants in “pharmaceutical” POCIS, Sci. Total Environ., 2018, 615, 197–207 CrossRef CAS.
- M. B. Asif, F. I. Hai, B. R. Dhar, H. H. Ngo, W. Guo, V. Jegatheesan, W. E. Price, L. D. Nghiem and K. Yamamoto, Impact of simultaneous retention of micropollutants and laccase on micropollutant degradation in enzymatic membrane bioreactor, Bioresour. Technol., 2018, 267, 473–480 CrossRef CAS.
- M. Stuart, D. Lapworth, E. Crane and A. Hart, Review of risk from potential emerging contaminants in UK groundwater, Sci. Total Environ., 2012, 416, 1–21 CrossRef CAS.
- O. Maliszewska, A. Plenis, I. Olędzka, P. Kowalski, N. Miękus, E. Bień, M. A. Krawczyk, E. Adamkiewicz-Drożynska and T. Bączek, Optimization of LC method for the quantification of doxorubicin in plasma and urine samples in view of pharmacokinetic, biomedical and drug monitoring therapy studies, J. Pharmaceut. Biomed. Anal., 2018, 158, 376–385 CrossRef CAS.
- C. Behr, M. Slopianka, V. Haake, V. Strauss, S. Sperber, H. Kamp, T. Walk, K. Beekmann, I. M. C. M. Rietjens and B. van Ravenzwaay, Analysis of metabolome changes in the bile acid pool in feces and plasma of antibiotic-treated rats, Toxicol. Appl. Pharmacol., 2019, 363, 79–87 CrossRef CAS.
- M. Rand-Weaver, L. Margiotta-Casaluci, A. Patel, G. H. Panter, S. F. Owen and J. P. Sumpter, The read-across hypothesis and environmental risk assessment of pharmaceuticals, Environ. Sci. Technol., 2013, 47(20), 11384–11395 CrossRef CAS.
- B. S. Dave, A. F. Amin and M. M. Patel, Gastroretentive drug delivery system of ranitidine hydrochloride: formulation and in vitro evaluation, AAPS PharmSciTech, 2004, 5(2), 77–82 CrossRef.
- The American Society of Health-System Pharmacists (ASHP), Ranitidine, 2017 Search PubMed.
- S. Biswas, S. H. Benedict, S. G. Lynch and S. M. LeVine, Potential immunological consequences of pharmacological suppression of gastric acid production in patients with multiple sclerosis, BMC Med., 2012, 10(1), 1–10 CrossRef.
- G. G. Bruer, P. Hagedorn, M. Kietzmann, A. F. Tohamy, V. Filor, E. Schultz and J. Meissner, Histamine H 1 receptor antagonists enhance the efficacy of antibacterials against Escherichia coli, BMC Vet. Res., 2019, 15(1), 55 CrossRef CAS.
- ClinCalcDrugStats Database, 2019, The Top 300 of 2019, https://clincalc.com/DrugStats/Top300Drugs.aspx, accessed 18 February 2019 Search PubMed.
- R. D. Bezerra, M. M. Silva, A. I. Morais, M. R. Santos, C. Airoldi and E. C. Silva Filho, Natural cellulose for Ranitidine drug removal from aqueous solutions, Int. J. Chem. Environ. Eng., 2014, 2(1), 605–611 CrossRef CAS.
- R. López-Serna, M. Petrović and D. Barceló, Occurrence and distribution of multi-class pharmaceuticals and their active metabolites and transformation products in the Ebro River basin (NE Spain), Sci. Total Environ., 2012, 440, 280–289 CrossRef.
- E. Zuccato, S. Castiglioni, R. Fanelli, G. Reitano, R. Bagnati, C. Chiabrando, F. Pomati, C. Rossetti and D. Calamari, Pharmaceuticals in the environment in Italy: causes, occurrence, effects and control, Environ. Sci. Pollut. Res., 2006, 13(1), 15–21 CrossRef CAS.
- M. S. Kostich, A. L. Batt and J. M. Lazorchak, Concentrations of prioritized pharmaceuticals in effluents from 50 large wastewater treatment plants in the US and implications for risk estimation, Environ. Pollut., 2014, 184, 354–359 CrossRef CAS.
- L. H. Santos, M. Gros, S. Rodriguez-Mozaz, C. Delerue-Matos, A. Pena, D. Barceló and M. C. B. Montenegro, Contribution of hospital effluents to the load of pharmaceuticals in urban wastewaters: identification of ecologically relevant pharmaceuticals, Sci. Total Environ., 2013, 461, 302–316 CrossRef.
- M. Isidori, A. Parrella, P. Pistillo and F. Temussi, Effects of ranitidine and its photoderivatives in the aquatic environment, Environ. Int., 2009, 35(5), 821–825 CrossRef CAS.
- R. Zou, X. Liao, L. Zhao and B. Yuan, Reduction of N-nitrosodimethylamine formation from ranitidine by ozonation preceding chloramination: influencing factors and mechanisms, Environ. Sci. Pollut. Res., 2018, 25(14), 13489–13498 CrossRef CAS.
- U.S. Food and Drug Administration, 2020, FDA Requests Removal of All Ranitidine Products (Zantac) from the Market, https://www.fda.gov/news-events/press-announcements/fda-requests-removal-all-ranitidine-products-zantac-market, accessed 8 August 2020 Search PubMed.
- M. Salgot, E. Huertas, S. Weber, W. Dott and J. Hollender, Wastewater reuse and risk: definition of key objectives, Desalination, 2006, 187(1–3), 29–40 CrossRef CAS.
- M. Bergheim, R. Gieré and K. Kümmerer, Biodegradability and ecotoxicitiy of tramadol, Ranitidine, and their photoderivatives in the aquatic environment, Environ. Sci. Pollut. Res., 2012, 19(1), 72–85 CrossRef CAS.
- F. Desbiolles, L. Malleret, C. Tiliacos, P. Wong-Wah-Chung and I. Laffont-Schwob, Occurrence and ecotoxicological assessment of pharmaceuticals: Is there a risk for the Mediterranean aquatic environment?, Sci. Total Environ., 2018, 639, 1334–1348 CrossRef CAS.
- A. Y. C. Lin, T. H. Yu and S. K. Lateef, Removal of pharmaceuticals in secondary wastewater treatment processes in Taiwan, J. Hazard Mater., 2009, 167(1–3), 1163–1169 CrossRef CAS.
- M. B. Ahmed, J. L. Zhou, H. H. Ngo, W. Guo, N. S. Thomaidis and J. Xu, Progress in the biological and chemical treatment technologies for emerging contaminant removal from wastewater: a critical review, J. Hazard Mater., 2017, 323, 274–298 CrossRef CAS.
- L. N. Nguyen, F. I. Hai, S. Yang, J. Kang, F. D. Leusch, F. Roddick and L. D. Nghiem, Removal of pharmaceuticals, steroid hormones, phytoestrogens, UV-filters, industrial chemicals and pesticides by Trametes versicolor: role of biosorption and biodegradation, Int. Biodeterior. Biodegrad., 2014, 88, 169–175 CrossRef CAS.
- C. Noutsopoulos, D. Mamais, T. Mpouras, D. Kokkinidou, V. Samaras, K. Antoniou and M. &Gioldasi, The role of activated carbon and disinfection on the removal of endocrine disrupting chemicals and non-steroidal anti-inflammatory drugs from wastewater, Environ. Technol., 2013, 35(6), 698–708 CrossRef.
- I. Michael, L. Rizzo, C. S. McArdell, C. M. Manaia, C. Merlin, T. Schwartz and D. Fatta-Kassinos, Urban wastewater treatment plants as hotspots for the release of antibiotics in the environment: a review, Water Res., 2013, 47(3), 957–995 CrossRef CAS.
- I. Ali, M. Asim and T. A. Khan, Low cost adsorbents for the removal of organic pollutants from wastewater, J. Environ. Manag., 2012, 113, 170–183 CrossRef CAS.
- R. Das, S. B. A. Hamid, M. E. Ali, A. F. Ismail, M. S. M. Annuar and S. Ramakrishna, Multifunctional carbon nanotubes in water treatment: the present, past and future, Desalination, 2014, 354, 160–179 CrossRef CAS.
- X. Qu, P. J. Alvarez and Q. Li, Applications of nanotechnology in water and wastewater treatment, Water Res., 2013, 47(12), 3931–3946 CrossRef CAS.
- Y. H. Li, Y. M. Zhao, W. B. Hu, I. Ahmad, Y. Q. Zhu, X. J. Peng and Z. K. Luan, Carbon nanotubes-the promising adsorbent in wastewater treatment, J. Phys. Conf., 2007, 61(1), 698 CrossRef CAS.
- S. Iijima, Carbon nanotubes: past, present, and future, Phys. B Condens. Matter, 2002, 323(1–4), 1–5 CrossRef CAS.
- A. B. Dalton, S. Collins, J. Razal, E. Munoz, V. H. Ebron, B. G. Kim, J. N. Coleman, J. P. Ferraris and R. H. Baughman, Continuous carbon nanotube composite fibers: properties, potential applications, and problems, J. Mater. Chem., 2004, 14(1), 1–3 RSC.
- S. Mura, Y. Jiang, I. Vassalini, A. Gianoncelli, I. Alessandri, G. Granozzi, L. Calvillo, N. Senes, S. Enzo, P. Innocenzi and L. Malfatti, Graphene Oxide/Iron Oxide Nanocomposites for Water Remediation, ACS Appl. Nano Mater., 2018, 1(12), 6724–6732 CrossRef CAS.
- K. Thakur and B. Kandasubramanian, Graphene and Graphene Oxide-Based Composites for Removal of Organic Pollutants, J. Chem. Eng., 2019, 64(3), 833–867 CAS.
- N. Yao, X. Zhang, Z. Yang, W. Yang, Z. Tian and L. Zhang, Norfloxacin and Bisphenol-A Removal Using Temperature-Switchable Graphene Oxide, ACS Appl. Mater. Interfaces, 2018, 10(34), 29083–29091 CrossRef CAS.
- K. Delhiraja, K. Vellingiri, D. W. Boukhvalov and L. Philip, Development of highly water stable graphene oxide based composites for the removal of pharmaceuticals and personal care products, Ind. Eng. Chem. Res., 2019, 58(8), 2899–2913 CrossRef CAS.
- S. Zhu, Y. G. Liu, S. B. Liu, G. M. Zeng, L. H. Jiang, X. F. Tan, L. Zhou, W. Zeng, T. T. Li and C. P. Yang, Adsorption of emerging contaminant metformin using graphene oxide, Chemosphere, 2017, 179, 20–28 CrossRef CAS.
- W. S. Hummers and R. E. Offeman, Preparation of graphite oxide, J. Am. Chem. Soc., 1958, 80, 1339 CrossRef CAS.
- N. I. Zaaba, K. L. Foo, U. Hashim, S. J. Tan, W. W. Liu and C. H. &Voon, Synthesis of graphene oxide using modified hummers method: solvent influence, Procedia Eng., 2017, 184, 469–477 CrossRef CAS.
- M. M. Fares, F. A. A. Al-Rub and K. A. H. Massadeh, Lightweight MWCNTs-g-PAN Carbon Fiber Precursors. Sensitive High Absorptivity and Novel Wide-Bandgap Conjugated Polymers, Ind. Eng. Chem. Res., 2015, 54(37), 9064–9071 CrossRef CAS.
- M. M. Fares, π-Plasmon absorbance films of carboxylic functionalized CNT s coupled with renewable PGP platforms, Polym. Adv. Technol., 2018, 29(6), 1861–1869 CrossRef CAS.
- C. Y. Kuo, Desorption and re-adsorption of carbon nanotubes: Comparisons of sodium hydroxide and microwave irradiation processes, J. Hazard Mater., 2008, 152(3), 949–954 CrossRef CAS.
- A. Lerf, H. He, M. Forster and J. Klinowski, Structure of graphite oxide revisited, J. Phys. Chem. B, 1998, 102(23), 4477–4482 CrossRef CAS.
- G. Wang, Z. Yang, X. Li and C. Li, Synthesis of poly (aniline-co-o-anisidine)-intercalated graphite oxide composite by delamination/reassembling method, Carbon, 2005, 43(12), 2564–2570 CrossRef CAS.
- S. Stankovich, D. A. Dikin, R. D. Piner, K. A. Kohlhaas, A. Kleinhammes, Y. Jia, Y. Wu, S. T. Nguyen and R. S. Ruoff, Synthesis of graphene-based nanosheets via chemical reduction of exfoliated graphite oxide, Carbon, 2007, 45(7), 1558–1565 CrossRef CAS.
- H. Yang, C. Shan, F. Li, D. Han, Q. Zhang and L. Niu, Covalent functionalization of polydispersechemically-converted graphene sheets with amine-terminated ionic liquid, Chem. Commun., 2009,(26), 3880–3882 RSC.
- V. Datsyuk, M. Kalyva, K. Papagelis, J. Parthenios, D. Tasis, A. Siokou, I. Kallitsis and C. Galiotis, Chemical oxidation of multiwalled carbonnanotubes, Carbon, 2008, 46(6), 833–840 CrossRef CAS.
- M. González, J. Baselga and J. Pozuelo, Modulating the electromagnetic shielding mechanisms by thermal treatment of high porosity graphene aerogels, Carbon, 2019, 147, 27–34 CrossRef.
- C. Luo, T. Jiao, J. Gu, Y. Tang and J. Kong, Graphene shield by SiBCN ceramic: a promising high-temperature electromagnetic wave-absorbing material with oxidation resistance, ACS Appl. Mater. Interfaces, 2018, 10(45), 39307–39318 CrossRef CAS.
- S. N. C. Ortiz, R. Cabanzo and E. Mejia-Ospino, Crude oil/water emulsion separation using graphene oxide and amine-modified graphene oxide particles, Fuel, 2019, 240, 162–168 CrossRef.
- T. A. Saleh, The influence of treatment temperature on the acidity of MWCNT oxidized by HNO3 or a mixture of HNO3/H2SO4, Appl. Surf. Sci., 2011, 257(17), 7746–7751 CrossRef CAS.
- L. Kong, X. Yin, H. Xu, X. Yuan, T. Wang, Z. Xu, J. Huang, R. Yang and H. Fan, Powerful absorbing and lightweight electromagnetic shielding CNTs/RGO composite, Carbon, 2019, 145, 61–66 CrossRef CAS.
- Y. Geng, S. J. Wang and J. K. Kim, Preparation of graphite nanoplatelets and graphene sheets, J. Colloid Interface Sci., 2009, 336(2), 592–598 CrossRef CAS.
- L. Jiang, Y. Liu, S. Liu, X. Hu, G. Zeng, X. Hu, S. Liu, S. Liu, B. Huang and M. Li, Fabrication of β-cyclodextrin/poly (l-glutamic acid) supported magnetic graphene oxide and its adsorption behavior for 17β-estradiol, Chem. Eng. J., 2017, 308, 597–605 CrossRef CAS.
- G. K. Ramesha, A. V. Kumara, H. B. Muralidhara and S. Sampath, Graphene and graphene oxide as effective adsorbents toward anionic and cationic dyes, J. Colloid Interface Sci., 2011, 361(1), 270–277 CrossRef CAS.
- V. G. Alexandratos, E. J. Elzinga and R. J. Reeder, Arsenate uptake by calcite: macroscopic and spectroscopic characterization of adsorption and incorporation mechanisms, Geochim. Cosmochim. Acta, 2007, 71(17), 4172–4187 CrossRef CAS.
- H. N. Bhatti, A. W. Nasir and M. A. Hanif, Efficacy of Daucuscarota L. waste biomass for the removal of chromium from aqueous solutions, Desalination, 2010, 253(1–3), 78–87 CrossRef CAS.
- Ministry of Water & Irrigation, Water Authority of Jordan, Wastewater Production, Treatment, and Use in Jordan, 2012 Search PubMed.
- H. Kortejärvi, M. Yliperttula, J. B. Dressman, H. E. Junginger, K. K. Midha, V. P. Shah and D. M. Barends, Biowaiver monographs for immediate release solid oral dosage forms: Ranitidine hydrochloride, J. Pharm. Sci., 2005, 94(8), 1617–1625 CrossRef.
- T. Longlong, Z. Xin, Q. Wei, L. Dan, J. Qiang, L. Jin, Y. Yuanlv, L. Zhan and W. Wangsuo, The adsorption of water-soluble ionic liquids on graphene oxide of different oxygen content, RSC Adv., 2014, 4(102), 58536–58545 RSC.
- A. Stafiej and K. Pyrzynska, Adsorption of heavy metal ions with carbon nanotubes, Separ. Purif. Technol., 2007, 58(1), 49–52 CrossRef CAS.
- S. Park, K. S. Lee, G. Bozoklu, W. Cai, S. T. Nguyen and R. S. Ruoff, Graphene oxide papers modified by divalent ions—enhancing mechanical properties via chemical cross-linking, ACS Nano, 2008, 2(3), 572–578 CrossRef CAS.
- Á. Serrano-Aroca, J. F. Ruiz-Pividal and M. Llorens-Gámez, Enhancement of water diffusion and compression performance of crosslinked
alginate films with a minuscule amount of graphene oxide, Sci. Rep., 2017, 7(1), 11684 CrossRef.
- D. J. Núñez, A. M. Benito, S. Rouzière, P. Launois, R. Arenal, P. M. Ajayan and W. K. Maser, Graphene oxide–carbon nanotube hybrid assemblies: Cooperatively strengthened OH···O= C hydrogen bonds and removal of chemisorbed water, Chem. Sci., 2017, 8, 4987–4995 RSC.
- D. Jasovský, J. Littmann, A. Zorzet and O. Cars, Antimicrobial resistance—a threat to the world's sustainable development, Ups. J. Med. Sci., 2016, 121(3), 159–164 CrossRef.
- S. Mondal, K. Sinha, K. Aikat and G. Halder, Adsorption thermodynamics and kinetics of ranitidine hydrochloride onto superheated steam activated carbon derived from mung bean husk, Int. J. Chem. Environ. Eng., 2015, 3(1), 187–195 CrossRef CAS.
- P. Das and P. Das, Graphene oxide for the treatment of ranitidine containing solution: Optimum sorption kinetics by linear and non linear methods and simulation using artificial neural network, Process Saf. Environ. Prot., 2016, 102, 589–595 CrossRef CAS.
- S. Bhattacharyya. Removal of Ranitidine from Pharmaceutical Waste Water Using Graphene Oxide (GO), in Waste Management and Resource Efficiency, Springer, Singapore, 2019, pp. 1253–1262 Search PubMed.
- R. D. S. Bezerra, M. M. F. Silva, A. I. S. Morais, M. R. M. C. Santos, C. Airoldi and E. C. Silva Filho, Natural cellulose for ranitidine drug removal from aqueous solutions, Int. J. Chem. Environ. Eng., 2014, 2(1), 605–611 CrossRef CAS.
- D. B. França, S. M. Torres, E. C. S. Filho, M. G. Fonseca and M. Jaber, Understanding the interactions between ranitidine and magadiite: Influence of the interlayer cation, Chemosphere, 2019, 222, 980–990 CrossRef.
- J. Xu, L. Wang and Y. Zhu, Decontamination of bisphenol A from aqueous solution by graphene adsorption, Langmuir, 2012, 28(22), 8418–8425 CrossRef.
- X. J. Hu, J. S. Wang, Y. G. Liu, X. Li, G. M. Zeng, Z. L. Bao, X. X. Zeng, A. W. Chen and F. Long, Adsorption of chromium (VI) by ethylenediamine-modified cross-linked magnetic chitosan resin: isotherms, kinetics and thermodynamics, J. Hazard Mater., 2011, 185(1), 306–314 CrossRef CAS.
- M. Tanzifi, M. T. Yaraki, A. D. Kiadehi, S. H. Hosseini, M. Olazar, A. K. Bharti, S. Agarwal, V. K. Gupta and A. Kazemi, Adsorption of Amido Black 10B from aqueous solution using polyaniline/SiO2 nanocomposite: Experimental investigation and artificial neural network modeling, J. Colloid Interface Sci., 2018, 510, 246–261 CrossRef CAS.
- W. J. Weber and J. C. Morris, Kinetics of adsorption on carbon from solution, J. Sanit. Eng. Div., 1963, 89(2), 31–60 Search PubMed.
- G. E. Boyd, A. W. Adamson and L. S. Myers Jr, The exchange adsorption of ions from aqueous solutions by organic zeolites. II. Kinetics1, J. Am. Chem. Soc., 1947, 69(11), 2836–2848 CrossRef CAS.
- R. Djeribi and O. Hamdaoui, Sorption of copper (II) from aqueous solutions by cedar sawdust and crushed brick, Desalination, 2008, 225(1–3), 95–112 CrossRef CAS.
- Z. Wu, H. Zhong, X. Yuan, H. Wang, L. Wang, X. Chen, G. Zeng and Y. Wu, Adsorptive removal of methylene blue by rhamnolipid-functionalized graphene oxide from wastewater, Water Res., 2014, 67, 330–344 CrossRef CAS.
- F. A. Abu Al-Rub, Biosorption of zinc on palm tree leaves :equilibrium, kinetics, and thermodynamics studies, Sep. Sci. Technol., 2006, 41(15), 3499–3515 CrossRef CAS.
- M. E. Mahmoud, G. M. Nabil, N. M. El-Mallah, H. I. Bassiouny, S. Kumar and T. M. Abdel-Fattah, Kinetics, isotherm, and thermodynamic studies of the adsorption of reactive red 195 A dye from water by modified Switch grass Biochar adsorbent, J. Ind. Eng. Chem., 2016, 37, 156–167 CrossRef CAS.
- C. A. P. Almeida, N. A. Debacher, A. J. Downs, L. Cottet and C. A. D. Mello, Removal of methylene blue from colored effluents by adsorption on montmorillonite clay, J. Colloid Interface Sci., 2009, 332(1), 46–53 CrossRef CAS.
- Y. Wu, H. Luo, H. Wang, C. Wang, J. Zhang and Z. Zhang, Adsorption of hexavalent chromium from aqueous solutions by graphene modified with cetyltrimethyl ammonium bromide, J. Colloid Interface Sci., 2013, 394, 183–191 CrossRef CAS.
Footnote |
| † Electronic supplementary information (ESI) available. See DOI: 10.1039/d0ra05530a |
|
| This journal is © The Royal Society of Chemistry 2020 |
Click here to see how this site uses Cookies. View our privacy policy here. 
 Open Access Article
 This Open Access Article is licensed under a Creative Commons Attribution-Non Commercial 3.0 Unported Licence
 *b and
Ahmad R. Mohammada
*b and
Ahmad R. Mohammada