 Open Access Article
Enhanced visible light photocatalytic degradation of dyes in aqueous solution activated by HKUST-1: performance and mechanism†
Jianyu Zhang a,
Chunli Su*a,
Xianjun Xiea,
Peng Liua and
Md. Enamul Huq
 b
b
aSchool of Environmental Studies, China University of Geosciences, Wuhan, 430074, China. E-mail: chl.su@cug.edu.cn; Fax: +86-27-87481030; Tel: +86-27-67883170
bState Key Laboratory for Information Engineering in Surveying Mapping and Remote Sensing, Wuhan University, Wuhan 430079, China
First published on 7th October 2020
Abstract
HKUST-1 is a copper-based metal–organic framework (MOF) and potential photocatalyst, but minimal research has addressed the performance and mechanism of HKUST-1 in the visible light photocatalytic degradation of dyes. In the present work, HKUST-1 was applied as a photocatalyst to activate peroxomonosulfate (PMS) under visible light (Vis) for dye removal in aqueous solution. The results showed that the removal efficiency of two cationic dyes [rhodamine B (RhB) and methylene blue (MB)] was greater than 95% within 120 min. Free radicals such as SO4−˙, ·OH were present in the degradation process, with SO4−˙ playing a dominant role. Zeta potential, X-ray photoelectron spectroscopy, and photoluminescence spectroscopy data were used to investigate the degradation mechanism. In the degradation process, surface charge attraction between HKUST-1 and cationic dyes promotes removal efficiency, with the degradation efficiency of cationic dyes (MB and RhB) more than 50% higher than for anionic dyes [acid orange 7 (AO7) and methyl red (MR)]. On the other hand, HKUST-1 has been proved to activate PMS by conducting photoelectrons, which accelerated the degradation of dyes. Compared with the reaction conditions of PMS/Vis, when the HKUST-1 was present (HKUST-1/PMS/Vis), the degradation rates of MB and RhB increased by 62.7 and 63.2%, respectively.
1. Introduction
Traditional industries such as dyestuffs, textiles, and paper inevitably release a large amount of dyes into wastewater. The total amount of dyestuff and pigments produced worldwide is over 700![[thin space (1/6-em)]](https://www.rsc.org/images/entities/char_2009.gif) 000 metric tons per year,1 but nearly 10–15% of the dyes enter wastewater streams during manufacturing and processing.2 The high chroma, poor biodegradability, and high toxicity of dye wastewater pose serious threats to human and environmental health.3,4
000 metric tons per year,1 but nearly 10–15% of the dyes enter wastewater streams during manufacturing and processing.2 The high chroma, poor biodegradability, and high toxicity of dye wastewater pose serious threats to human and environmental health.3,4
Common methods for treating dye wastewater include adsorption, filtration, and membrane treatment.5 However, the removal efficiency achieved are still insufficient and these methods often have associated with safety risks.6,7 Photolysis is an effective advanced oxidation method for treating dye wastewater, employing photocatalysts to convert light energy into chemical energy that then degrades dyes into small molecules.8 Traditional photocatalysts including TiO2, CdS, and Ag, among others have challenges in terms of efficiency and economics that remain to be overcome. Recently, copper-based photocatalysts have received much attention in the field of photolysis due to their excellent performance and relatively low cost.9 Tian et al. synthesized Cu2O/Cu composites that were applied to the photolysis of methyl blue (MB) in water, with a degradation rate of 87.74% achieved within 80 min.10 Mosleh, Rahimi et al. synthesized CuO/Cu2O/Cu composites and photodegraded MB in aqueous solution with the assistance of ultrasound, with the degradation efficiency reaching 91.91% within 90 min.11
Metal–organic frameworks (MOFs) are a type of semiconductor formed by the complexation of metals or metal clusters with organic ligands.12 Recently, a copper-based MOF known as HKUST-1 has attracted extensive attention and is one of the few commercially available MOFs.13† HKUST-1 is formed by the coordination of Cu2+ and trimesic acid (H3BTC), and has large specific surface area and high porosity. The research to date on HKUST-1 mainly focuses on hydrogen storage and CO2 adsorption, and limited research has investigated HKUST-1 as a potential copper-based photocatalyst for the photodegradation of dyes.14–16 Therefore, this study examined the performance and mechanism of HKUST-1 in the visible light (Vis) degradation of dyes. Permonosulfate (PMS) was selected as the electron acceptor and used to establish an HKUST-1/PMS/Vis system to enhance the photolysis. Four dyes [rhodamine B (RhB), methylene blue (MB), methyl red (MR), and acid orange 7 (AO7)] were selected as the degradation targets. Differences in degradation performance for the four dyes by HKUST-1/PMS/Vis were determined and the removal mechanism was investigated. Influential factors such as dosage and initial pH were also considered.
2. Materials and methods
2.1 Preparation of HKUST-1
HKUST-1 was synthesized using the solvothermal method.17 First, 1.95 g of Cu(NO3)2·2.5H2O (>99%) and 1.0 g of trimesic acid (H3BTC) were dissolved in 51 mL of mixed solvent (water![[thin space (1/6-em)]](https://www.rsc.org/images/entities/char_2009.gif) :
:![[thin space (1/6-em)]](https://www.rsc.org/images/entities/char_2009.gif) ethanol
ethanol![[thin space (1/6-em)]](https://www.rsc.org/images/entities/char_2009.gif) :
:![[thin space (1/6-em)]](https://www.rsc.org/images/entities/char_2009.gif) N,N-dimethylformamide in a 1
N,N-dimethylformamide in a 1![[thin space (1/6-em)]](https://www.rsc.org/images/entities/char_2009.gif) :
:![[thin space (1/6-em)]](https://www.rsc.org/images/entities/char_2009.gif) 1
1![[thin space (1/6-em)]](https://www.rsc.org/images/entities/char_2009.gif) :
:![[thin space (1/6-em)]](https://www.rsc.org/images/entities/char_2009.gif) 1 volume ratio). After stirring for 10 min, the mixture was poured into a Teflon-lined autoclave vessel and heated in an oven at 120 °C for 20 h. The mixture then was cooled to room temperature and washed with ethanol and deionized water five times to obtain the blue solid, which was dried at 100 °C for 12 h before use.
1 volume ratio). After stirring for 10 min, the mixture was poured into a Teflon-lined autoclave vessel and heated in an oven at 120 °C for 20 h. The mixture then was cooled to room temperature and washed with ethanol and deionized water five times to obtain the blue solid, which was dried at 100 °C for 12 h before use.
2.2 Characterization method
HKUST-1 was examined using X-ray diffraction (XRD) (D8-FOCUS, Bruker AXS, Germany) and Fourier-transform infrared spectroscopy (Nicolet 6700, Thermo Fisher, USA). The morphology of as-synthesized HKUST-1 was characterized by scanning electron microscopy (SEM) (SU8010, Hitachi, Japan). Elemental valence analysis and electronic cloud state were determined with X-ray photoelectron spectroscopy (XPS) (EscaLab 250Xi, Thermo, USA). Diffuse reflectance spectra (DRS) data were obtained using a UV-Vis spectrometer (UV-2550PC, Shimadzu, Japan). Zeta potentials were determined by a potentiometric analyzer (Nano ZS90, Malvern, UK). BET data were recorded with a pore size and fully automatic analyzer (ASAP2460, Micromeritics, USA). Photoluminescence (PL) spectroscopy was conducted using a fluoro spectrophotometer (F-4600, Hitachi, Japan). The valence band potential of the material was determined by ultraviolet photoelectron spectroscopy (UPS) (EscaLab 250Xi, Thermo, USA).2.3 Photocatalytic degradation of dyes (RhB, MB, AO7, MR)
The performance of the HKUST-1/PMS/Vis system was evaluated in terms of the degradation of both cationic dyes (RhB and MB) and anionic dyes (AO7 and MR). For batch experiments, HKUST-1 and PMS were put into 100 mL of aqueous dye solution (10 mg L−1), then the light source turned on and stirring commenced to start the reaction. The visible light source (400–800 nm) was a tungsten halogen lamp (QVF135/500 W). The stirring speed and temperature were constant at 500 rpm and 24 °C, respectively. During the reaction, 6 mL of the mixture were taken out at regular intervals (15, 30, 60, 90, 120, 150, 180 min) and filtered (0.22 μm), with the dye concentrations measured with an ultraviolet spectrophotometer (DR2800, HACH). The initial pH of the mixture was adjusted using NaOH (0.1 mol L−1) or HNO3 (0.1 mol L−1), and measured by a pH electrode (9157BNMD, Thermo Scientific, USA).3. Results and discussion
3.1 Characterization of the HKUST-1
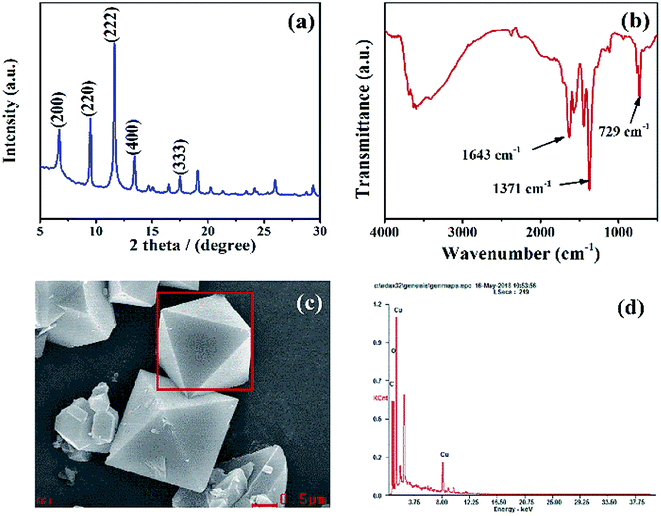
XRD data were used to characterize the crystal structure of HKUST-1. Fig. 1a shows the spectrum had good peak shapes, with several peaks (e.g., 200, 220, 222, 400, 333) consistent with previously recorded spectra.18 Fig. 1b is the FT-IR spectra of HKUST-1, which features a broad peak around 3000–3500 cm−1 corresponding to the stretching vibration mode of the hydroxyl group in the water molecule. The band at around 729 cm−1 represents the Cu–O bond and confirms the coordination of Cu2+ and –COOH.19 Organic ligands can act as electron-conducting media and form an electron transport chain from organic ligands to transition metals, so the coordination of Cu–O will favor the catalytic performance of HKUST-1.20 The band at 1371 cm−1 corresponds to the C![[double bond, length as m-dash]](https://www.rsc.org/images/entities/char_e001.gif) C stretching vibration of benzene.21 The peak at 1643 cm−1 is attributed to C
C stretching vibration of benzene.21 The peak at 1643 cm−1 is attributed to C![[double bond, length as m-dash]](https://www.rsc.org/images/entities/char_e001.gif) O stretching in the carboxyl group. Fig. 1c presents the SEM and the corresponding energy dispersive X-ray spectroscopic (EDS) images of HKUST-1. HKUST-1 displayed a regular octahedral shape, consistent with previous studies of its morphology.22 In addition, the EDS elemental analysis revealed that the main elements present were Cu, O, and C, also confirming the successful synthesis of HKUST-1 (Fig. 1d).
O stretching in the carboxyl group. Fig. 1c presents the SEM and the corresponding energy dispersive X-ray spectroscopic (EDS) images of HKUST-1. HKUST-1 displayed a regular octahedral shape, consistent with previous studies of its morphology.22 In addition, the EDS elemental analysis revealed that the main elements present were Cu, O, and C, also confirming the successful synthesis of HKUST-1 (Fig. 1d).
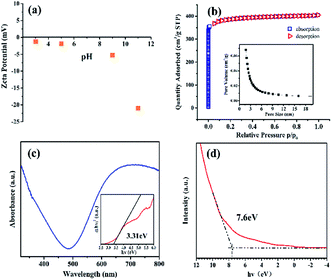
The zeta potential test was applied to characterize the surface charge properties of HKUST-1 as these will have an important effect on the photocatalytic degradation process by way of surface charge action. Fig. 2a shows the potential of HKUST-1 is negative from pH 2 to 11, indicating the surface of HKUST-1 is negatively charged and therefore more prone to attract cations on micro surfaces; this may be beneficial for the removal of cationic dyes. BET characterization was carried out to determine the specific surface area, pore size, and pore volume of HKUST-1 (Fig. 2b). The large specific surface area (1215.91 m2 g−1) will provide more active reactive sites and favor enhanced photodegradation efficiency. However, the average pore size and pore volume are small (2.05 nm, 0.07 cm3 g−1), and the N2 adsorption–desorption curve shows a I/II mixed type isotherm; this indicates HKUST-1 has a mesoporous structure that may weaken the adsorption of dyes. UV-Vis diffuse reflectance spectroscopy (DRS) was used to characterize the optical properties of HKUST-1. Fig. 2c shows HKUST-1 absorbed light in both the ultraviolet and visible regions. The band gap energies of HKUST-1 were calculated using the following equation:
| (αhν)2 = A(hν − Eg) | (1) |
Where α, h, ν, and Eg are absorption coefficient, Planck's constant, light frequency, and band gap energy, respectively. The value of the band gap energy is the intersection of the plots of (αhν)2 versus photon energy (hν) and the X axis. The band gap energies of the HKUST-1 was calculated as 3.31 eV. UV photoelectron spectroscopy (UPS) test was applied to characterize the valence band of HKUST-1 (Fig. 2d), and the valence band energy was determined to be 2.3 V versus NHE, so the conduction band of HKUST-1 is −1.01 V versus NHE.
3.2 Photocatalyst degradation of dyes (RhB, MB, AO7 and MR)
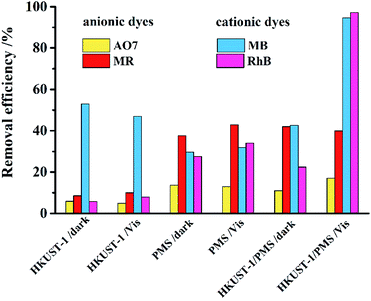
Cationic dyes RhB and MB and anionic dyes AO7 and MR were selected as the degradation targets to evaluate the performance of HKUST-1/PMS/Vis. Fig. 3 shows the removal of dyes under different conditions, including (1) HKUST-1/dark or Vis; (2) PMS/dark or Vis; and (3) HKUST-1/PMS/dark or Vis.When the reaction condition was HKUST-1/dark or Vis, removals of AO7, MR, and RhB were all less than 10%. Because the forbidden band of HKUST-1 (3.31 eV) exceed the theoretical minimum energy that can be excited by visible light (3.1 eV), the removal rate of these dyes was low. The removal of MB reached 50%, which was attributed to adsorption by HKUST-1. When the reaction condition was PMS/dark or Vis, none of the removal rates exceeded 50%, indicating PMS has a low efficiency in terms of dye degradation. Finally, when the reaction condition was HKUST-1/PMS/Vis, the degradation of MB and RhB reached 95% due to the synergistic effect of HKUST-1, PMS, and visible light. However, the removal efficiency of AO7 and MR was lower than 40%, which may be due to the surface charge repulsion of anionic dyes by HKUST-1. The degradation of MB and RhB for HKUST-1/PMS/Vis conditions was 51.9% and 74.8% higher than for HKUST-1/PMS/dark conditions, confirming the importance of visible light in the system. The adsorption of HKUST-1 on MB reached 53%, while the adsorption on RhB was only 5.8%; this may be attributed to the small pore size (2.05 nm) and pore volume (0.07 cm3 g−1) of HKUST-1. However, this did not affect the degradation efficiency of the two cationic dyes by the HKUST-1/PMS/Vis system.
3.3 Degradation of dyes in different catalytic conditions
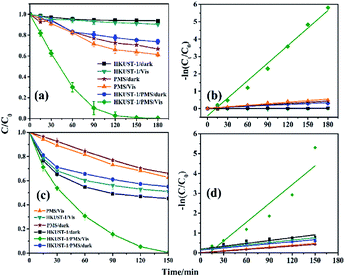
Kinetic curves can provide more detailed information about the photodegradation process of the dyes. Considering that the treatment effect of RhB and MB was better, they were chosen for the degradation kinetics experiments. The adsorption equilibrium curves of RhB and MB are shown in Fig. S1 and S2.† HKUST-1 has little adsorption on RhB, while the adsorption rate for MB is higher (55%), although the rate is relative slow. The effects of dosage of agent and initial pH on the degradation of RhB were also explored. Fig. 4a illustrates the kinetic curve of RhB under different degradation conditions. The degradation of RhB can reach 70% and 90% within 60 and 90 min, respectively (HKUST-1/PMS/Vis), but the degradation efficiency decreased with decreasing RhB concentration. The degradation kinetic curve of RhB satisfies a pseudo first-order kinetic model (Fig. 4b). The kinetic curve was established according to eqn (2) and (3):| dc/dt = −kc | (2) |
| ln(ct/c0) = −kt | (3) |
![[thin space (1/6-em)]](https://www.rsc.org/images/entities/char_2009.gif) :
:![[thin space (1/6-em)]](https://www.rsc.org/images/entities/char_2009.gif) 1 to 2
1 to 2![[thin space (1/6-em)]](https://www.rsc.org/images/entities/char_2009.gif) :
:![[thin space (1/6-em)]](https://www.rsc.org/images/entities/char_2009.gif) 1; further improvement of RhB degradation was not obvious when the ratio was increased to 4
1; further improvement of RhB degradation was not obvious when the ratio was increased to 4![[thin space (1/6-em)]](https://www.rsc.org/images/entities/char_2009.gif) :
:![[thin space (1/6-em)]](https://www.rsc.org/images/entities/char_2009.gif) 1; and the degradation of RhB was lower at a 5
1; and the degradation of RhB was lower at a 5![[thin space (1/6-em)]](https://www.rsc.org/images/entities/char_2009.gif) :
:![[thin space (1/6-em)]](https://www.rsc.org/images/entities/char_2009.gif) 1 ratio than a 4
1 ratio than a 4![[thin space (1/6-em)]](https://www.rsc.org/images/entities/char_2009.gif) :
:![[thin space (1/6-em)]](https://www.rsc.org/images/entities/char_2009.gif) 1 ratio. This phenomenon can be attributed to the effect of excess HKUST-1 creating turbid conditions and hindering both the penetration of light and production of free radicals. Moreover, the reduction in the utilization of light energy led to a decline in the capacity of HKUST-1/PMS/Vis to degrade RhB. Therefore, in consideration of economic aspects when comparing treatment effects, a 2
1 ratio. This phenomenon can be attributed to the effect of excess HKUST-1 creating turbid conditions and hindering both the penetration of light and production of free radicals. Moreover, the reduction in the utilization of light energy led to a decline in the capacity of HKUST-1/PMS/Vis to degrade RhB. Therefore, in consideration of economic aspects when comparing treatment effects, a 2![[thin space (1/6-em)]](https://www.rsc.org/images/entities/char_2009.gif) :
:![[thin space (1/6-em)]](https://www.rsc.org/images/entities/char_2009.gif) 1 ratio of HKUST-1
1 ratio of HKUST-1![[thin space (1/6-em)]](https://www.rsc.org/images/entities/char_2009.gif) :
:![[thin space (1/6-em)]](https://www.rsc.org/images/entities/char_2009.gif) PMS is the best choice for RhB degradation.
PMS is the best choice for RhB degradation.
The effect of initial pH on the degradation of RhB is shown in Fig. S4.† The degradation rate of RhB was approximately 95% over a wide pH range (3–11) within 120 min, indicating the change of initial pH had little effect on the degradation of RhB. The degradation of RhB was markedly less at an initial pH of 1, as the structure of HKUST-1 collapsed. The catalytic process stopped when the HKUST-1 decomposed, indicating its role in the heterogeneously catalyzed process. It also positively reflects the importance of HKUST-1 for RhB degradation.
3.4 Degradation mechanism
During the photocatalytic degradation process, free radicals played a major role. Free radicals in the system were identified through scavenging action by quenchers (Fig. 5). Benzoquinone (BQ) is a common scavenger for quenching ·O2−.23 Fig. 5 shows the photodegradation of RhB was almost unaffected when BQ was present, indicating that the ·O2− had little effect in the system. Tertiary butanol (TBA) and ethanol (EtOH) are typical radical scavengers. EtOH is recognized as a capturer for SO4−˙ and ·OH, while TBA mainly quenches ·OH in solution and weakly scavenges SO4−˙.24 Fig. 5 shows the degradation of RhB was significantly inhibited when EtOH was present, while TBA did not have a major inhibitory effect. This confirms SO4−˙ is the main oxidizing free radical and ·OH plays a minor role. In the HKUST-1/PMS/Vis system, SO4−˙ was only generated by the activation of PMS. The generation process of SO4−˙ from PMS is as follows:| HSO5− + e− → (SO4−˙ + OH−) or (SO42− + ·OH) | (4) |
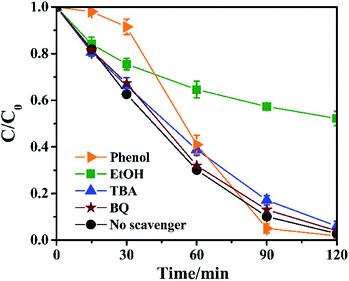 | ||
| Fig. 5 The degradation of RhB in the presence of radical scavengers (experiment conditions: RhB = 10 ppm; HKUST-1 = 0.40 g L−1; PMS = 0.20 g L−1). | ||
Phenol is a common scavenger of SO4−˙ and ·OH, and the hydrophobicity of phenol makes it more inclined to associated with the surface of the catalyst.25 When phenol was present, the degradation rate of RhB was significantly reduced in the first 30 min due to the scavenging effect, and then gradually recovered over the next 30 min. This phenomenon may due to the volatilization of phenol and a reduction in the scavenging effect of SO4−˙ and ·OH on the surface of HKUST-1, resulting in the gradual recovery of the degradation efficiency of RhB. It also indirectly demonstrated the photodegradation of RhB by HKUST-1/PMS/Vis is a heterogeneous catalytic process.
Fig. 6 presents the XPS spectra of HKUST-1 (before and after reaction). The O 1s spectra has a peak at 532.18 eV, which is assigned to the carboxylate groups (O–C![[double bond, length as m-dash]](https://www.rsc.org/images/entities/char_e001.gif) O) in HKUST-1.26 After photocatalytic degradation, the binding energy of the O–C
O) in HKUST-1.26 After photocatalytic degradation, the binding energy of the O–C![[double bond, length as m-dash]](https://www.rsc.org/images/entities/char_e001.gif) O shifts to 531.98 eV, which is 0.2 eV less than for HKUST-1 (before reaction). The Cu 2p spectrum features peaks at 954.88 and 935.08 eV, associated with Cu 2p1/2 and Cu 2p3/2.27 After the reaction, the binding energy of these peaks shift to 954.68 and 934.88 eV, respectively, both of which are 0.2 eV less than for the HKUST-1 before the reaction. The C 1s signal from HKUST-1 is derived from the H3BTC; the two peaks at 289.08 and 285.18 eV are attributed to C–C in the benzene ring and O–C
O shifts to 531.98 eV, which is 0.2 eV less than for HKUST-1 (before reaction). The Cu 2p spectrum features peaks at 954.88 and 935.08 eV, associated with Cu 2p1/2 and Cu 2p3/2.27 After the reaction, the binding energy of these peaks shift to 954.68 and 934.88 eV, respectively, both of which are 0.2 eV less than for the HKUST-1 before the reaction. The C 1s signal from HKUST-1 is derived from the H3BTC; the two peaks at 289.08 and 285.18 eV are attributed to C–C in the benzene ring and O–C![[double bond, length as m-dash]](https://www.rsc.org/images/entities/char_e001.gif) O in –COOH, respectively.28 Probably because the “O” on –COOH has a strong electronegativity, so it has a strong ability to attract electrons. After the reaction, the binding energy of these two C 1s peaks shifted to 288.78 and 285.08 eV, respectively, which are respectively 0.3 and 0.1 eV less than for HKUST-1 before the reaction. In general, the binding energies of O 1s, C 1s, and Cu 2p all shifted to lower values after the reaction; these reductions may be due to the increasing electron cloud density of organic ligands and metal centers.27 Although the binding energies all decreased, the extent of the decline differed. The maximum binding energy shift was for O–C
O in –COOH, respectively.28 Probably because the “O” on –COOH has a strong electronegativity, so it has a strong ability to attract electrons. After the reaction, the binding energy of these two C 1s peaks shifted to 288.78 and 285.08 eV, respectively, which are respectively 0.3 and 0.1 eV less than for HKUST-1 before the reaction. In general, the binding energies of O 1s, C 1s, and Cu 2p all shifted to lower values after the reaction; these reductions may be due to the increasing electron cloud density of organic ligands and metal centers.27 Although the binding energies all decreased, the extent of the decline differed. The maximum binding energy shift was for O–C![[double bond, length as m-dash]](https://www.rsc.org/images/entities/char_e001.gif) O (0.3 eV), followed by Cu–O (0.2 eV), indicating the coordination units of –COOH and Cu2+ captured more photoelectrons, while the benzene ring contributes less due to the smaller change in electron cloud density (0.1 eV). Analysis of the XPS results indicates HKUST-1 acts as an electron capture and transfer medium in the photocatalytic degradation process.
O (0.3 eV), followed by Cu–O (0.2 eV), indicating the coordination units of –COOH and Cu2+ captured more photoelectrons, while the benzene ring contributes less due to the smaller change in electron cloud density (0.1 eV). Analysis of the XPS results indicates HKUST-1 acts as an electron capture and transfer medium in the photocatalytic degradation process.
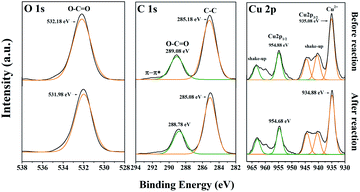 | ||
| Fig. 6 The XPS of HKUST-1 in the range of O 1s, C 1s and Cu 2p for that before (pristine) and after reaction (degradation on RhB). | ||
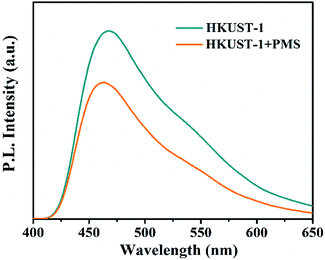
The CB of HKUST-1 is −0.21 V versus NHE, which is more negative than the redox potential of PMS, and the electrons on the CB of HKUST-1 can activate PMS in theory.29 Therefore, PL spectroscopy was applied to verify whether free electrons on the CB of HKUST-1 can activate PMS. Fig. 7 shows that the fluorescence intensity decreases when PMS is present, indicating PMS weakens the recombination of photo-generated electrons and has the ability to acquire electrons from the CB of HKUST-1.
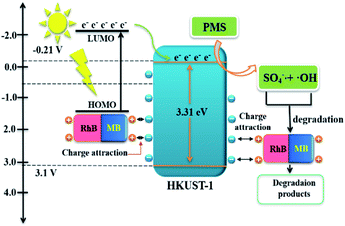
Taken together, the results of the free radical identification, XPS analysis, and PL spectroscopy investigation indicate the degradation mechanism should be as follows. With the stimulation of visible light, the dyes generate photoelectrons due to their own photosensitivity, and through charge attraction contact the HKUST-1 surface and transfer photoelectrons to the CB of HKUST-1. PMS obtains photoelectrons from HKUST-1 and accelerates self-decomposition to generate SO4−˙ and ·OH, which then degrade MB and RhB. Due to repulsion between the anionic dyes (AO7, MR) and surface charges of HKUST-1, photoelectron transfer to HKUST-1 is difficult and, in turn, PMS is not activated to trigger the degradation process (Fig. 8).
Recyclability is an important consideration when evaluating the practical application of materials. Fig. 9a shows that over 75% degradation of RhB is still achieved after four cycles. The 20% decline in degradation after five cycles can be attributed to the loss of material. Fig. 9b shows XRD patterns of HKUST-1 before and after the reaction. After the reaction, the characteristic peak intensity of HKUST-1 slightly decreased, but the characteristic peak remained unchanged and no hetero peak appeared, indicating HKUST-1 has stable chemical properties and the HKUST-1/PMS/Vis system has the capacity to work cyclically.
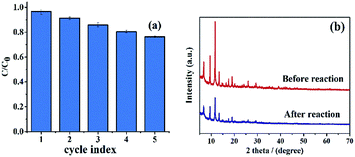 | ||
| Fig. 9 Reusability of the HKUST-1 for the degradation of RhB (a); XRD patterns of HKUST-1 before and after the reaction (b). | ||
4. Conclusions
The experimental results showed that the HKUST-1/PMS/Vis system can effectively degrade the dyes, and HKSUT-1/PMS/Vis had good selectivity for the degradation of cationic dyes (RhB and MB) and poor degradation of anionic dyes (AO7 and MR). The HKUST-1/PMS/Vis system effectively degraded RhB and MB but accomplished poor removal of AO7 and MR, which is attributed to the repulsion between surface charges. DRS, XPS, and PL analyses suggested injecting photoelectrons from dyes into HKUST-1 and activating PMS is the main route of HKUST-1/PMS/Vis degradation of dyes. In addition, data of DRS, XPS and PL confirmed that dyes injected photoelectrons into HKSUT-1 and activated PMS was the main route of HKUST-1/PMS/Vis degradation dyes.Conflicts of interest
There are no conflicts to declare.Acknowledgements
This research was supported by the Major Science and Technology Program for Water Pollution Control and Treatment “Research and demonstration of key technologies for water ecological environment remediation and water safety guarantee in Baiyangdian Lake and Daqing River Basin (Xiong'an New Area)” (2018ZX07110) and “Research and Engineering Demonstration of Groundwater Pollution Control and Remediation Technology for Typical Sewage Reclamation Ponds in Tanghe Sewage Reservoir and Xiong'an New Area” (2018ZX07110005).Notes and references
- S. Natarajan, H. C. Bajaj and R. J. Tayade, J. Environ. Sci., 2018, 65, 201–222 CrossRef.
- P. V. Nidheesh, M. Zhou and M. A. Oturan, Chemosphere, 2018, 197, 210–227 CrossRef CAS.
- F. Ahmedchekkat, M. S. Medjram and M. Chiha, Chem. Eng. J., 2011, 178, 244–251 CrossRef CAS.
- M. Jamshidi, M. Ghaedi, K. Dashtian, A. M. Ghaedi, S. Hajati, A. Goudarzi and E. Alipanahpour, Spectrochim. Acta, Part A, 2016, 153, 257–267 CrossRef CAS.
- S. Mosleh, M. R. Rahimi, M. Ghaedi and K. Dashtian, Ultrason. Sonochem., 2016, 32, 387–397 CrossRef CAS.
- N. Ghows and M. H. Entezari, Ultrason. Sonochem., 2013, 20(1), 386–394 CrossRef CAS.
- M. Shirzad-Siboni, M. Farrokhi, R. D. C. Soltani, A. Khataee and S. Tajassosi, Ind. Eng. Chem. Res., 2014, 53(3), 1079–1087 CrossRef CAS.
- S. Mosleh, M. R. Rahimi, M. Ghaedi, K. Dashtian and S. Hajati, RSC Adv., 2016b, 6, 63667–63680 Search PubMed.
- J. Du, Y. Yuan, J. Sun, F. Peng, X. Jiang, L. Qiu, A. Xie, Y. Shen and J. Zhu, J. Hazard. Mater., 2011, 190, 945–951 CrossRef CAS.
- X. Y. Tian, J. Wen, Z. J. Chen, X. Liu, H. X. Peng, C. Y. Ji, J. Li, Y. X. Peng and H. P. He, Solid State Sci., 2019, 93, 70–78 CrossRef CAS.
- S. Mosleh, M. R. Rahimi, M. Ghaedi, K. Dashtian and S. Hajati, Ultrason. Sonochem., 2018, 40, 601–610 CrossRef CAS.
- Q. Zhu and Q. Xu, Chem. Soc. Rev., 2014, 43, 5468–5512 RSC.
- J. A. Anderson, M. P. Singh, N. R. Dhumal, H. J. Kim and J. Kiefer, J. Phys. Chem. C, 2016, 120(31), 17153–17862 CrossRef.
- N. Torres, J. Galicia, Y. Plasencia, A. Cano, F. Echevarria, L. F. Desdin-Garcia and E. Reguera, Colloids Surf., A, 2018, 549, 138–146 CrossRef CAS.
- C. L. Wang, Y. C. Su, X. L. Zhao, S. S. Tong and X. J. Han, Chem.–Eur. J., 2018, 24(5), 1080–1087 CrossRef CAS.
- H. M. Wen, B. Li, L. B. Li, R. B. Lin, W. Zhou, G. D. Qian and B. L. Chen, Adv. Mater., 2018, 30(16), 1704792 CrossRef.
- Z. Hasan, J. Cho, J. Rinklebe, Y. S. Ok, D. W. Cho and H. Song, J. Ind. Eng. Chem., 2017, 52, 331–337 CrossRef CAS.
- K. Lin, A. K. Adhikari, C. N. Ku, C. L. Chiang and H. Kuo, Int. J. Hydrogen Energy, 2012, 37, 13865–13871 CrossRef CAS.
- S. Lin, Z. Song, G. Che, A. Ren, P. Li, C. Liu and J. Zhang, Microporous Mesoporous Mater., 2014, 193, 27–34 CrossRef CAS.
- T. Zhang and W. Lin, Chem. Soc. Rev., 2014, 43, 5982–5993 RSC.
- X. Yan, S. Komarneni, Z. Zhan and Z. Yan, Microporous Mesoporous Mater., 2014, 183, 69–73 CrossRef CAS.
- S. Mosleh, M. R. Rahimi, M. Ghaedi, K. Dashtian, S. Hajati and S. Wang, Chem. Eng. Process., 2017, 114, 24–38 CrossRef CAS.
- M. Mousavi, A. Habibi-Yangjeh, D. Seifzadeh, K. Nakata and S. Vadivel, Adv. Powder Technol., 2019, 30, 524–537 CrossRef CAS.
- T. Zeng, X. Zhang, S. Wang, H. Niu and Y. Cai, Environ. Sci. Technol., 2015, 49, 2350–2357 CrossRef CAS.
- J. Zhang, X. Shao, C. Shi and S. Yang, Chem. Eng. J., 2013, 232, 259–265 CrossRef CAS.
- K. Ahlenhoff, S. Koch, D. Emmrich, R. Dalpke, A. Golzhauser and P. Swiderek, Phys. Chem., 2019, 21, 2351–2364 CAS.
- C. Chen, B. Li, L. Zhou, Z. Xia, N. Feng, J. Ding, L. Wang, H. Wan and G. Guan, ACS Appl. Mater. Interfaces, 2017, 9, 23060–23071 CrossRef CAS.
- S. Y. Kim, A. R. Kim, J. W. Yoon, H. J. Kim and Y. S. Bae, Chem. Eng. J., 2018, 335, 94–100 CrossRef CAS.
- G. Zhou, H. Sun, S. Wang, H. M. Ang and M. O. Tade, Sep. Purif. Technol., 2011, 80, 626–634 CrossRef CAS.
Footnote |
| † Electronic supplementary information (ESI) available. See DOI: 10.1039/d0ra05275b |
| This journal is © The Royal Society of Chemistry 2020 |

