
 Open Access Article
 This Open Access Article is licensed under a Creative Commons Attribution-Non Commercial 3.0 Unported Licence
Quantitative study of unsaturated transport of glycerol through aquaglyceroporin that has high affinity for glycerol†
Roberto A.
Rodriguez
a,
Ruth
Chan
a,
Huiyun
Liang
ab and
Liao Y.
Chen
 *a
*a
aDepartment of Physics, The University of Texas at San Antonio, San Antonio, Texas 78249, USA. E-mail: Liao.Chen@utsa.edu
bDepartment of Pharmacology, The University of Texas Health Science Center at San Antonio, San Antonio, Texas 78229, USA
First published on 15th September 2020
Abstract
The structures of several aquaglyceroporins have been resolved to atomic resolution showing two or more glycerols bound inside a channel and confirming a glycerol-facilitator's affinity for its substrate glycerol. However, the kinetics data of glycerol transport experiments all point to unsaturated transport that is characteristic of low substrate affinity in terms of the Michaelis–Menten kinetics. In this article, we present in silico–in vitro research focused on AQP3, one of the human aquaglyceroporins that is natively expressed in the abundantly available erythrocytes. We conducted 2.1 μs in silico simulations of AQP3 embedded in a model erythrocyte membrane with intracellular–extracellular asymmetries in leaflet lipid compositions and compartment salt ions. From the equilibrium molecular dynamics (MD) simulations, we elucidated the mechanism of glycerol transport at high substrate concentrations. From the steered MD simulations, we computed the Gibbs free-energy profile throughout the AQP3 channel. From the free-energy profile, we quantified the kinetics of glycerol transport that is unsaturated due to glycerol–glycerol interactions mediated by AQP3 resulting in the concerted movement of two glycerol molecules for the transport of one glycerol molecule across the cell membrane. We conducted in vitro experiments on glycerol uptake into human erythrocytes for a wide range of substrate concentrations and various temperatures. The experimental data quantitatively validated our theoretical–computational conclusions on the unsaturated glycerol transport through AQP3 that has high affinity for glycerol.
Introduction
The transport of glycerol across the cell membrane is fundamental in human physiology, biology, and biotechnology, and has been investigated since long ago [e.g.ref. 1–7]. Aquaglyceroporins, a subfamily of membrane proteins belonging to the aquaporin (AQP) family (see, e.g., ref. 8–75 for the background literature and some recent research), facilitate glycerol diffusion across the cell membrane down the concentration gradient. In the human body, there are four aquaglyceroporins: AQP3,23–27 AQP7,62 AQP9,34,47,63,64 and AQP10 (ref. 46 and 65–69) which are responsible for lipid homeostasis and other physiological functions. In other organisms, there are, e.g., E. coli aquaglyceroporin GlpF7,20,44,73 and P. falciparum aquaporin PfAQP.22,45,70 Pathologically, for example, AQP3 found in various epithelial cells is implicated in cancers; AQP3 and AQP10 expressed in enterocytes and adipocytes are relevant in obesity research. Today, four aquaglyceroporin structures have been resolved to atomic resolution: GlpF in 2000,20 PfAQP in 2008,22 AQP10 in 2018,69 and AQP7 in 2020.60,76 All of these high-resolution X-ray structures showed glycerols bound inside the channels, demonstrating that aquaglyceroporins have affinity for their substrate, glycerol. Kinetics experiments on AQP9 and AQP10 showed saturated transport at low substrate concentrations.46,47 However, many other kinetics experiments of glycerol transport showed unsaturable characteristics for glycerol concentrations up to ∼1 M,5,6,71–73 which, based on the Michaelis–Menten formalism, would suggest that aquaglyceroporins are simple channels without affinity for their substrate. Putting all these together, we have a paradox: are aquaglyceroporins facilitators with high affinity for their substrate or simple channels providing a pore for glycerol passage through the cell membrane without much affinity for the substrate?In this paper, we present an in silico–in vitro investigation of AQP3 in the erythrocyte membrane aimed at resolving this outstanding paradox: how can an aquaglyceroporin have high affinity for glycerol but also transport the substrate in an unsaturable manner? Our study is based on the following experimentally validated characteristics: each human erythrocyte carries approximately 2000 copies77 of AQP3 that are responsible for glycerol transport across the cell membrane.25,28 The membrane lipid compositions of human erythrocytes78–82 are approximately 11% phosphatidylcholine (POPC), 38% phosphatidylethanolamine (POPE), 22% phosphatidylserine (POPS), 9% sphingomyelin (SSM), and 20% cholesterol (CHL) in the inner leaflet and 35% POPC, 10 POPE, 35% SSM, and 20% CHL in the outer leaflet, respectively.
We first ran equilibrium molecular dynamics (MD) simulations for 16.0 monomer μs (0.5 μs for a large system having 32 AQP3 monomers, shown in Fig. 1) which is sufficiently long for direct observation of a few glycerol transport events through AQP3. In an event of transporting a substrate across the cell membrane, a glycerol molecule can bind to AQP3 from one side of the membrane and dissociate from AQP3 to the other side. This pathway dominates when the substrate concentration is low and the probability is negligible for simultaneous binding of multiple substrates. Our large-scale simulation (having 200 mM glycerol in the system) showed a new transport pathway. Along this pathway, two substrates can bind simultaneously inside the AQP3 channel, lining up in a single file manner. The two substrates bound inside the channel next to each other are in constant thermal fluctuations pushing one another and thus making it easy for one of them to dissociate from the protein to complete the transport of one glycerol molecule. This new pathway can be exemplified in a glycerol efflux event: there is always a glycerol bound at the high affinity site near the center of the channel. A second glycerol binds to a low affinity site on the intracellular (IC) side next to the first glycerol. When this second glycerol falls into the high affinity site, it pushes the first one to the low affinity site on the extracellular (EC) side. From there, the first glycerol can easily dissociate from AQP3 into the EC fluid. This second transport pathway would become more significant as the substrate concentration increases, resulting in unsaturable transport characteristics of an aquaglyceroporin. It is interesting to note that, long before the discovery of aquaporins, it was already proposed3,6 that glycerol transport involved simultaneous binding of two glycerol molecules from one side of the membrane and releasing them to the other side of the membrane. Now, we have the atomistic details about the inner workings of an aquaglyceroporin.
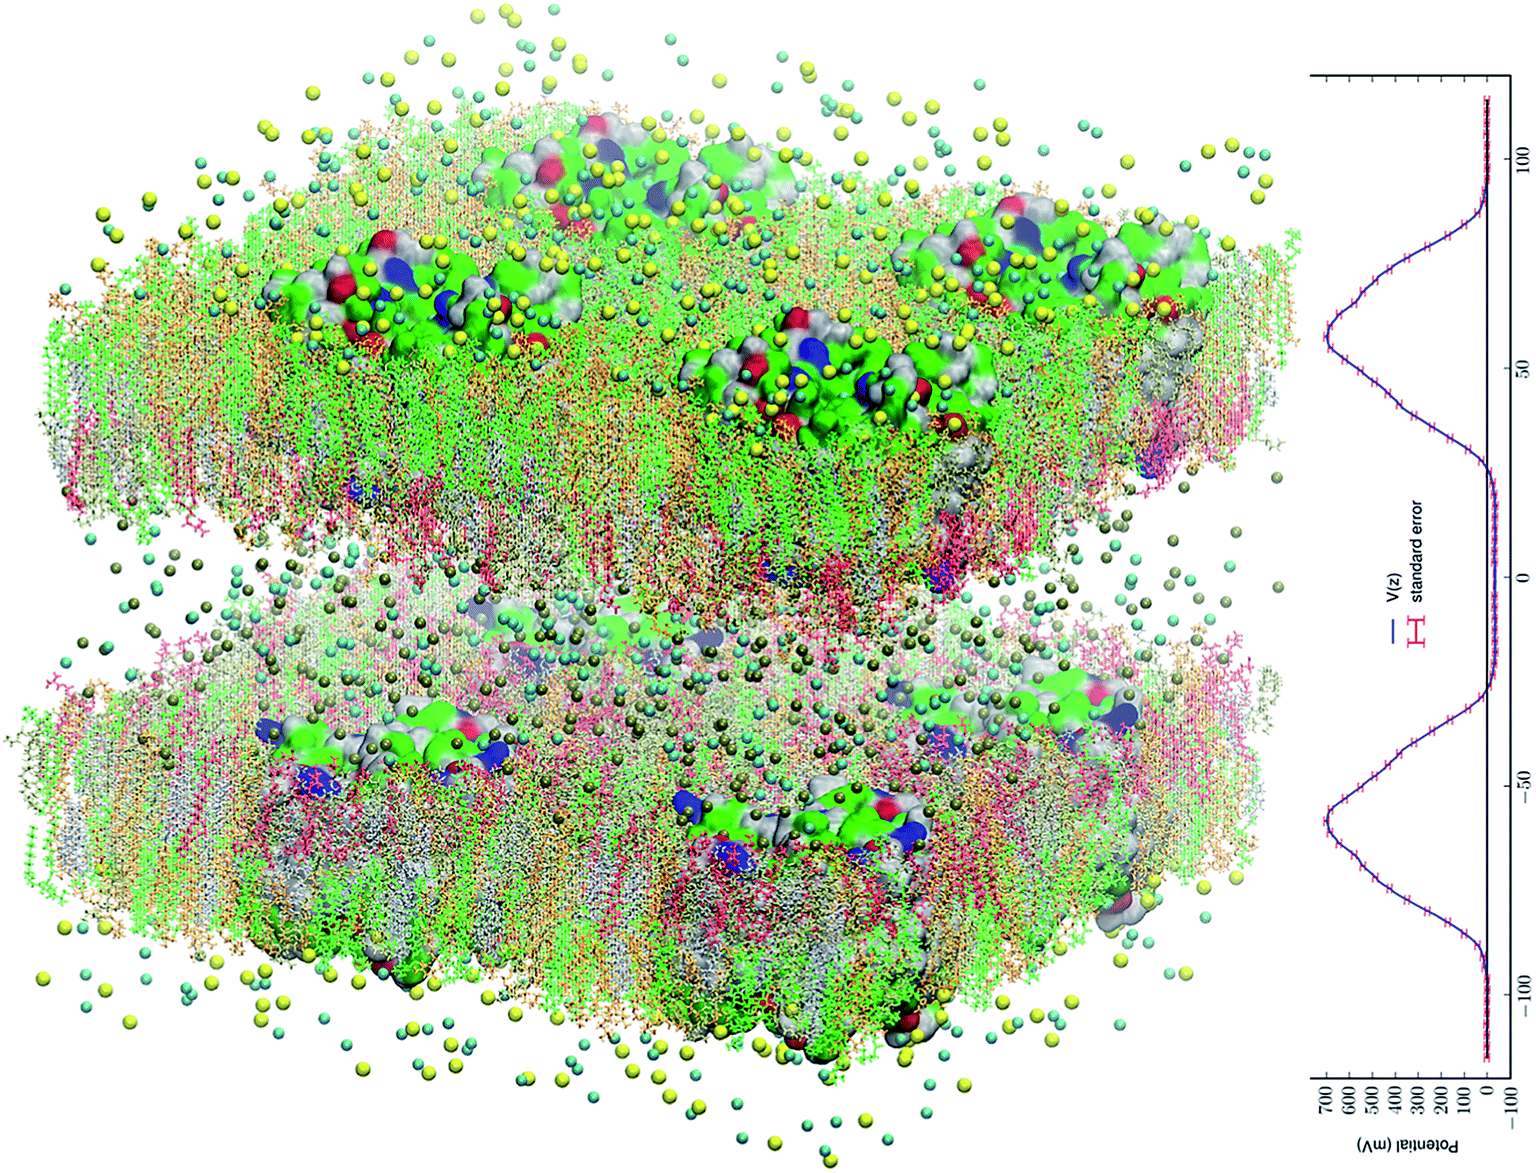 | ||
Fig. 1 All-atom model system of eight AQP3 tetramers in asymmetric environments mimicking the membrane of a human erythrocyte. The system consists of 1![[thin space (1/6-em)]](https://www.rsc.org/images/entities/char_2009.gif) 249096 atoms. The intracellular space is located at −40 Å < z < 40 Å and the extracellular space at z < −95 Å and z > 95 Å. The water and glycerol molecules are not shown for a clearer view of all the other constituents of the system. The intracellular salt (KCl) and the extracellular salt (NaCl) are shown as spheres colored by atom names (Cl, cyan; K, metallic; Na, yellow). The lipids are represented as licorices colored by lipid names (POPC, orange; POPE, tan; POPS, red; SSM, green; CHL, silver). The proteins are presented as surfaces colored by residue types (hydrophilic, green; hydrophobic, white; positively charged, blue; negatively charged, red). Molecular graphics in this paper were rendered with VMD.83 The PME-based electrostatic potential is shown in the right panel. 249096 atoms. The intracellular space is located at −40 Å < z < 40 Å and the extracellular space at z < −95 Å and z > 95 Å. The water and glycerol molecules are not shown for a clearer view of all the other constituents of the system. The intracellular salt (KCl) and the extracellular salt (NaCl) are shown as spheres colored by atom names (Cl, cyan; K, metallic; Na, yellow). The lipids are represented as licorices colored by lipid names (POPC, orange; POPE, tan; POPS, red; SSM, green; CHL, silver). The proteins are presented as surfaces colored by residue types (hydrophilic, green; hydrophobic, white; positively charged, blue; negatively charged, red). Molecular graphics in this paper were rendered with VMD.83 The PME-based electrostatic potential is shown in the right panel. | ||
For quantitative characteristics, we ran 1.68 μs steered MD to map out the driving force, namely the gradient of the potential of mean force (PMF) which is the Gibbs free energy of the system as a function of the coordinates of a glycerol molecule along the transport path throughout AQP3 between the cytoplasm and the EC fluid. From the PMF curve and the fluctuations at the three binding sites inside the AQP3 channel, we computed the glycerol–AQP3 affinities showing high affinity ∼500/M at the central binding site near the asparagine–proline–alanine (NPA) motifs and low affinities ∼1/M at two other sites, one on the IC side and one on the EC side. We further quantified the transport kinetics based on the PMF curve to predict the time courses of erythrocyte swelling–shrinking caused by glycerol uptake. We conducted in vitro experiments of glycerol uptake for five substrate concentrations ranging from 25 mM to 400 mM at four temperatures from 5 °C to 37 °C. The experimental data invariably validated the computational predictions with a single fitting parameter that is the rate constant for glycerol to bind on to AQP3 from the IC side.
Methods
The parameters, the coordinates, and the scripts for setting up the model systems, running the simulations, and analyzing the data are available at Harvard Dataverse via DOI: 10.7910/DVN/V9I4YQ.Model system setup and simulation parameters
Following the well-tested steps in the literature, we employed CHARMM-GUI84–86 to build an all-atom model of an AQP3 tetramer embedded in a 117 Å × 117 Å patch of erythrocyte membrane. The AQP3 coordinates were taken from ref. 53 (optimized homology model validated with in vitro experiments). The positioning of the AQP3 tetramer was determined by matching the hydrophobic side surface with the lipid tails and aligning the channel axes perpendicular to the membrane. The AQP–membrane complex was sandwiched between two layers of TIP3P waters, each of which was approximately 30 Å thick. The system was then neutralized and salinated with Na+ and Cl− ions to a salt concentration of 150 mM. Glycerol was added to the system to 200 mM in concentration. The system so constructed consists of four AQP3 monomers in a single patch of membrane constituted with 156137 atoms, which is referred to as SysI (shown in ESI, Fig. S1†). We employed NAMD 2.13 (ref. 87) as the MD engine. We used CHARMM36 parameters88–90 for inter- and intra-molecular interactions. After the initial equilibration steps, we fully equilibrated the system by running unbiased MD for 500 ns with constant pressure at 1.0 bar (Nose–Hoover barostat) and constant temperature at 303.15 K (Langevin thermostat). The Langevin damping coefficient was chosen to be 1/ps. The periodic boundary conditions were applied to all three dimensions. The particle mesh Ewald (PME) was used for the long-range electrostatic interactions (grid level: 128 × 128 × 128). The time step was 2.0 fs. The cut-off for long-range interactions was set to 10 Å with a switching distance of 9 Å.
We replicated the fully equilibrated SysI seven times to obtain eight copies of SysI. With appropriate translations and rotations of the eight copies, we formed SysII, a large system of two patches of membrane that consists of 1249096 atoms. In each patch of the membrane, there are four AQP3 tetramers (16 monomers). We replaced Na+ ions in the intracellular space with K+ ions. In this manner, we constructed an all-atom AQP3–membrane system (illustrated in Fig. 1) that has an intracellular saline of KCl separated by two membrane patches from the extracellular saline of NaCl. The model membrane has the asymmetry in the lipid compositions of the inner and the outer leaflets mimicking the human erythrocyte membrane. Unbiased MD was run for 500 ns for this large SysII with identical parameters used for SysI except that the PME was implemented on a grid level of 256 × 256 × 256. The last 200 ns of the trajectories were used in the computation of the membrane potential (Fig. 1) and the search for the glycerol transport pathways. The advantages of SysII are twofold. First, the 200 ns production run of this large system having 8 copies of the AQP3 tetramer is statistically equivalent to a 1.6 μs run of SysI that has only one biologically functional unit (AQP3 tetramer). This statistical time scale is more than the average time, 1.1 μs, for a single transport event per AQP3 tetramer. A sub-microsecond run of SysII, which is achievable in days, not weeks, on high-performance supercomputers, should be sufficient for the search of transport mechanisms. Second, SysII has a significant enhancement of the signal to noise ratio over SysI because the intrinsic pressure fluctuation of a system is inversely proportional to the volume of the system.91 This second advantage, while not critical in this study, may be needed in other studies where the biophysical processes are sensitive to the pressure fluctuations.
Computing the Gibbs free-energy profile
We conducted 1680 ns steered MD of SysI (illustrated in Fig. 2 and S1†) to compute the PMF along the glycerol transport path through an AQP3 channel across the membrane. We followed the multi-sectional protocol detailed in ref. 75. We defined the forward direction as along the z-axis, from the EC side to the IC side. We divided the entire glycerol transport path across the membrane from z = −20 Å to z = 20 Å into 40 evenly divided sections. From the central binding site (z = 0 Å, shown in Fig. 2) to the IC side (z ≥ 20 Å), the center-of-mass z-degree of freedom of glycerol was steered at a speed of 0.25 Å ns−1 for 4 ns over one section for a z-displacement of 1.0 Å to sample a forward path over that section. At the end of each section, the z-coordinate of the glycerol center-of-mass was fixed (or, technically, pulled at a speed of 0.0 Å ns−1) while the system was equilibrated for 10 ns. From the end of the 10 ns equilibration, the z-coordinate of the glycerol center-of-mass was pulled for 4 ns for a z-displacement of −1.0 Å to sample a reverse path. From the binding site (z = 0 Å) to the EC side (z ≤ −20 Å), the center-of-mass z-degree of freedom of glycerol was steered for 4 ns for a z-displacement of −1.0 Å to sample a reverse path over one section. At the end of that section, the z-coordinate of the glycerol center-of-mass was fixed while the system was equilibrated for 10 ns. From the end of the 10 ns equilibration, the z-coordinate of the glycerol center-of-mass was pulled for 4 ns for a z-displacement of +1.0 Å to sample a forward path. In this way, section by section, we sampled a set of four forward paths and four reverse paths in each of the 40 sections (20 sections from the central binding site to the IC side and 20 sections from the central binding site to the EC side) along the entire transport path between the EC and the IC sides. The force acting on the glycerol center-of-mass was recorded along the forward and the reverse pulling paths for computing the PMF along the entire transport path from the EC side to the central binding site and then to the IC side. The PMF was computed from the work along the forward paths and the work along the reverse paths via the Brownian-dynamics fluctuation–dissipation theorem.75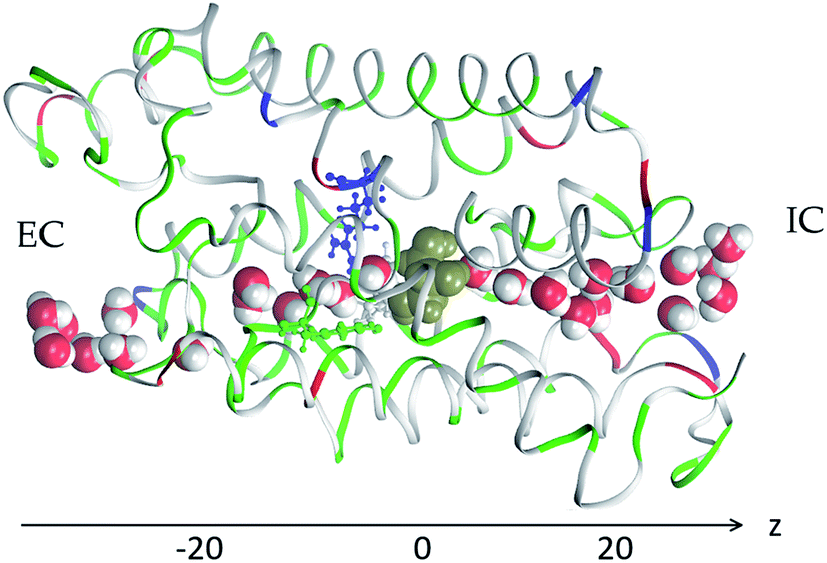 | ||
| Fig. 2 AQP3 monomer channel with a glycerol molecule (gold colored spheres) at the central binding site near the NPA motifs. The whole monomer protein is shown as ribbons along with the aromatic/arginine motif residues (Phe63, Tyr212, and Arg218) shown in ball-and-sticks, all colored by residue types (see Fig. 1 for colors). The water molecules inside and near the channel are shown in space-filling spheres colored by atoms (O, red; H, white). | ||
Binding affinity from PMF in 3D
Following the standard literature (e.g., ref. 92), one can relate the binding affinity (inverse of the dissociation constant kDi) at the i-th binding site to the PMF difference in 3 dimensions (3D) and the two partial partitions as follows:| 1/kDi = exp[−ΔWi/RT]Zi/Z∞. | (1) |
Experimental assays and analyses
The packed red blood cells from three anonymous healthy donors were purchased from the South Texas Blood and Tissue Center. Equal volumes of the three erythrocyte samples were mixed and washed three times and then suspended in phosphate buffered saline (PBS) to a total concentration of 4% hematocrit. In each experimental run, 5 μL of the 4% hematocrit suspension in PBS was rapidly mixed with an equal volume of PBS containing glycerol at a concentration of 2ΔcGOL using an Applied PhotoPhysics SX20 stopped-flow spectrometer. In such a mixture solution, the extracellular environment of the erythrocyte is initially hyperosmotic with a gradient of ΔcGOL which drives a water efflux out of the cell via AQP1 resulting in cellular shrinkage in the initial phase. However, the extracellular glycerol diffuses through AQP3 into the cytoplasm. Subsequent to the initial phase, the glycerol influx drags along a water influx via AQP1 resulting in cellular swelling which lasts until the glycerol gradient dissipates away and the cells return to the state before mixing. The intensity of light scattered at 90° was measured to monitor the erythrocyte shrinking–swelling process. The scattered light intensity is related to the varying cellular volume as follows:| I(t) = 1 + b(V0/V(t) − 1). | (2) |
 | (3) |
| d[c(t)V(t)]/dt = NAQ3K(c(t),ce)(ce − c(t)). | (4) |
For each experiment, the full dynamics in eqn (3) and (4) were numerically integrated for a given set of parameters (one of which was used as a fitting parameter) for a time-course solution in eqn (2), which was least-squares fitted to the measured intensity of scattered light in the cellular shrinking–swelling process.
Results and discussion
Mechanisms of glycerol transport
In order to obtain direct observation of a transport event, we conducted 500 ns unbiased equilibrium MD run of SysII (shown in Fig. 1) having a glycerol concentration of 200 mM. We observed that glycerol molecules bind inside an AQP3 channel at three different locations illustrated in Fig. 3. We note the central binding site near the NPA motifs as site 0, the one on the EC side of the NPA as site 1, and the one on the IC side of the NPA as site 2. There are eight possible states for three binding sites being occupied or unoccupied, which are tabulated in Table 1. Fig. 3A illustrates these eight states and the transitions between them. The transition rate constants are tabulated in Table 2. Fig. 3B illustrates the transitions that gave rise to the IC-to-EC transport of one glycerol molecule via the collective motion of two glycerol molecules. | ||
| Fig. 3 (A) Eight states of the glycerol–AQP3 complex and transitions between them. The three wells on a red curve indicate the binding sites of glycerol inside the AQP3 channel. Each green nut indicates the presence of a glycerol molecule at the binding site. (B) An IC-to-EC transport event. The protein AQP3 monomer is shown in ribbons and the ar/R sf residues (Phe63, Tyr212, Arg218) in ball-and-sticks, all colored by residue types (hydrophobic, white; hydrophilic, green; negatively charged, red; positively charged, blue). Water molecules inside and near the AQP3 channel are shown in space-filling spheres colored by atoms (O, red; H, white). Two glycerol molecules are shown in space-filling spheres: GOL661 colored purple and GOL102 colored gold. | ||
| Binding site | State 000 | State 010 | State 001 | State 011 | State 100 | State 110 | State 101 | State 111 |
|---|---|---|---|---|---|---|---|---|
| EC side, site 1 | G | G | G | G | ||||
| Central, site 0 | G | G | G | G | ||||
| IC side, site 2 | G | G | G | G |
| From | To | |||||||
|---|---|---|---|---|---|---|---|---|
| State 000 | State 010 | State 001 | State 011 | State 100 | State 110 | State 101 | State 111 | |
| State 000 | k −2 | k 1 | ||||||
| State 010 | kk D/kD2 | k −2 | kk D/kD1 | k 1 | ||||
| State 001 | k −2 k D2 | k | k 1 | |||||
| State 011 | k −2 k D2 | k | kk D/kD1 | k 1 | ||||
| State 100 | k 1 k D1 | k | k −2 | |||||
| State 110 | k 1 k D1 | kk D1/kD2 | kk D/kD2 | k −2 | ||||
| State 101 | k 1 k D1 | k | k −2 k D2 | k | ||||
| State 111 | k 1 k D1 | k −2 k D2 | ||||||
Examining the trajectories during the last 200 ns (after SysII was fully equilibrated), we gained the following insights: site 0 was always occupied indicating that state 010 has the lowest free energy. States 000, 100, 111, 001, and 101 were nearly never occupied indicating that either site 1 or site 2 has much higher free energy than site 0. Double occupancies (state 011 and state 110) did show up, noting that SysII has a high glycerol concentration of 200 mM. The transitions between states 010 and 110 occurred multiple times and so did the transitions between states 010 and 011. These transitions indicated that the free energy for a glycerol being at site 1 or 2 is not much lower than the bulk level (when it is outside the channel on the EC or IC side). They further indicated that there is no significant attraction between the two glycerols in state 011 or 110. Transitions between state 011 and state 110 also occurred within the 0.2 μs time frame, indicating that states 011 and 110 have similar free energies. All of these insights will be quantitatively validated when the free-energy profile is computed along the glycerol diffusion path throughout the AQP3 channel.
Qualitatively, we now are clear that there are two pathways for glycerol transport across the cell membrane through AQP3. At a low glycerol concentration, double or triple occupancy inside the channel is very low. Namely, states 110 and 011 (double occupancy) have negligibly small probabilities and even more so do states 101 (double occupancy) and 111 (triple occupancy). The EC to IC transport pathway consists of consecutive transitions from 000 to 100 to 010 to 001 to 000 and the IC to EC transport pathway consists of the same transitions in reverse sequence. The bottleneck of the transport pathway is the 010 to 001 transition or the 010 to 100 transition because the central binding site has high affinity. At a higher glycerol concentration, double occupancies inside the channel become more probable. A second transport pathway starts to play a more significant role. This second pathway consists of consecutive transitions from 010 to 011 to 110 to 010 for a glycerol efflux event (illustrated in Fig. 3) or the same transitions in reverse order for a glycerol uptake event.
In principle, it is desirable to extend the unbiased equilibrium MD to many milliseconds in length to achieve statistically significant results for glycerol transport. In practice, it is infeasible and unnecessary to incur such a great computing cost because quantitatively accurate results can be obtained from steered MD simulations for less than two microseconds.
Quantitative characteristics
Fig. 4 shows the PMF throughout the AQP3 channel as a function of the z-coordinate of the glycerol's center of mass. It represents the Gibbs free energy of the system when a glycerol molecule is located at a given location. The reference level of the PMF was chosen at the bulk level on either the EC or the IC side. The two bulk levels must be equal for neutral solute transport across the cell membrane which is not an actively driven process but a facilitated passive process of diffusion down the concentration gradient. The PMF curve leveling off to zero on both the EC side and the IC side in Fig. 4 indicates the accuracy of our computation. Inside the protein channel, the PMF presents a deep well (ΔW0 = −7.5 kcal mol−1) near the NPA motifs (around z ∼ 0), which is a binding site for glycerol (site 0). On the EC side, between the NPA and the aromatic/arginine (ar/R) selectivity filter (sf), there is another binding site (site 1) where the PMF has a local minimum (ΔW1 = −3.5 kcal mol−1). The third binding site (site 2) is located on the IC side of the NPA where the PMF is ΔW2 = −2.2 kcal mol−1. These PMF well depths of the three binding sites are the main factors to determine the affinities (the inverse dissociation constants): 1/kD = f0exp[−ΔW0/RT] for site 0, 1/kD1 = f1exp[−ΔW1/RT] for site 1, and 1/kD2 = f2exp[−ΔW2/RT] for site 2. The other factors involved in the determination of the affinities are the fluctuations at the three sites (f0, f1, f2) which was computed straightforwardly from the equilibrium MD runs with the gaussian approximation. Combining the fluctuations and the PMF well depths, we obtained the dissociation constants tabulated in Table 3. It should be noted that the PMF curve in Fig. 4 represents changes in the Gibbs free energy of the system when one glycerol is displaced throughout the channel. It is necessary to test if having a glycerol at site 0 will change the binding affinities at sites 1 and 2. Our simulations of pulling a second glycerol away from site 1 or 2 while the first glycerol was at site 0 (unrestrained) produced no differences beyond the error bars. There are no significant attractions between the two glycerols. However, pulling the second glycerol from site 1 or 2 towards site 0 caused the first glycerol at site 0 (unrestrained) to move out of the central binding site, which represents the transitions between state 110 and state 011.
 | ||
| Fig. 4 PMF of glycerol throughout the AQP3 channel. The coordinates are set so that the center of membrane is located at z ∼ 0 Å. In the single-file region (−10 Å < z < 10 Å), the PMF is one dimensional. In the EC (z < −10 Å) or IC (z > 10 Å) side of the channel, the PMF is three dimensional. The three binding sites are located at: site 1, z ∼ −6 Å; site 0, z ∼ 0 Å; site 2, z ∼ 8 Å. | ||
| Central binding site, kD | EC binding site, kD1 | IC binding site, kD2 | |
|---|---|---|---|
| 36.6 °C | 4.0 mM | 0.9 × 10³ mM | 1.2 × 10³ mM |
| 23.5 °C | 2.0 mM | 0.5 × 10³ mM | 0.8 × 10³ mM |
| 16.1 °C | 1.6 mM | 0.4 × 10³ mM | 0.7 × 10³ mM |
| 5.3 °C | 1.0 mM | 0.35 × 10³ mM | 0.55 × 10³ mM |
Interestingly, the PMF curve dictates that the rate constants for transitions between the states are related to one another as tabulated in Table 2. Additionally, k = k−2max(kD1,kD2) and k1 = k−2exp(−ΔWEC/RT) where ΔWEC ≃ 1.8 kcal mol−1 is the PMF barrier along the binding path of a glycerol molecule from the EC side. k−2 is the rate constant for glycerol binding onto AQP3 from the IC side. With these relationships, we leave one rate constant k−2 free as a fitting parameter to fit with multiple sets of experimental data for five glycerol concentrations at four different temperatures. If this PMF-based theoretical–computational framework accurately captured all the fundamental steps in glycerol transport through AQP3, at each temperature, k−2 would be nearly independent of the glycerol concentration. The values of k−2 are expected to be slightly dependent on the experimental temperature because the process represented by k−2 (a glycerol molecule binding onto AQP3 from the IC side) is essentially downhill without significant barriers in the PMF profile.
Now, what interactions are responsible for the strong AQP3–glycerol affinity represented by the deep well in the PMF curve in Fig. 4? First, glycerol is hydrophilic. Away from the protein where a glycerol molecule is surrounded by waters, it can form six hydrogen bonds with the surrounding waters. When it is inside the protein channel, it forms two hydrogen bonds with waters and one or two hydrogen bonds with the pore-lining residues. When a glycerol is inside the channel, it displaces two or three waters that are bonded to each other and to the pore-lining residues by six or seven hydrogen bonds. Namely, in the bound state, a glycerol breaks six hydrogen bonds to waters. This counting seems to suggest that hydrogen-bond interactions favor the unbound state of glycerol where it has three more hydrogen bonds. However, in this counting, we ignored the hydrogen bonds between waters in the bulk. In the dissociated state, a glycerol displaces four waters from the volume it occupies and thus disrupts 10 hydrogen bonds between the waters if assuming 2.5 hydrogen bonds per water in the aqueous bulk. Altogether, the system has one more hydrogen bond when a glycerol is inside the protein than in the aqueous bulk. Therefore, even the hydrogen bonding interactions between the miscible glycerol and water actually favor a glycerol molecule bound inside the amphipathic AQP channel. More importantly, glycerol is amphipathic as well. Its three OH-groups are highly hydrophilic, but its HC-side has significant attraction to the hydrophobic side of the amphipathic AQP pore. The strong van der Waals interactions between the hydrophobic side of glycerol and the hydrophobic side of the AQP channel are mostly responsible for the negative PMF near the NPA motifs.
Experimental data vs. computational predictions
In order to validate our PMF-based theoretical–computational study, we performed 20 sets of in vitro experiments on human erythrocytes at four different temperatures between 5 °C and 37 °C for a wide range of glycerol concentrations (tabulated in Table 4). Five sets of data at 23 °C are shown in Fig. 5 and all the other data sets are included in ESI, Fig. S2–S4.† Below we discuss in detail the experimental data and the perfect agreement with the theoretical–computational predictions.| EC [glycerol] | 25 mM | 50 mM | 100 mM | 200 mM | 400 mM |
|---|---|---|---|---|---|
| 36.6 °C | 1.3 × 10³/s M | 1.3 × 10³/s M | 1.3 × 10³/s M | 1.3 × 10³/s M | 1.3 × 10³/s M |
| 23.5 °C | 1.05 × 10³/s M | 1.05 × 10³/s M | 1.05 × 10³/s M | 1.05 × 10³/s M | 1.0 × 10³/s M |
| 16.1 °C | 0.85 × 10³/s M | 0.9 × 10³/s M | 0.9 × 10³/s M | 0.9 × 10³/s M | 0.9 × 10³/s M |
| 5.3 °C | 0.8 × 10³/s M | 0.8 × 10³/s M | 0.8 × 10³/s M | 0.8 × 10³/s M | 0.8 × 10³/s M |
 | ||
| Fig. 5 Experiments at ∼23 °C of glycerol uptake into human erythrocytes for extracellular glycerol concentration at 25 mM, 50 mM, 100 mM, 200 mM, and 400 mM. The data points (colored crosses) represent normalized intensity of light scattered at 90° immediately after mixing of an erythrocyte suspension in 0.7× PBS (containing no glycerol) with an equal volume of 0.7× PBS containing 2ΔcGOL glycerol. Five colors represent five experimental repeats under identical conditions. The black solid curve is the predicated time course with a single fitting parameter k−2 whose fitted values are shown. The fitting has a p-value less than 10−5 and a relative error ∼5% in all five sets. | ||
First of all, the fitted values of the single parameter k−2 turned out to be weakly dependent upon temperature and, for each temperature, independent of the glycerol concentrations ranging from 25 mM to 400 mM (Table 4). The theoretical–computational framework based on the PMF (Fig. 4) indeed captured all the significant factors of glycerol transport through AQP3. Otherwise, the fitted values of the fitting parameter would be strongly case-dependent.
For each given temperature, the time it took for the glycerol uptake to complete (i.e., for the IC glycerol concentration to reach the EC level) was nearly independent of the concentration gradient. It took approximately 20 seconds for the uptake of 25 mM glycerol to complete. Likewise, it took approximately 20 seconds for the uptake of 50 mM, 100 mM, 200 mM, or even 400 mM glycerol (Fig. 5 for experiments at ∼23 °C). The glycerol transport was clearly unsaturated. Otherwise, it would take a longer time for the uptake to complete at a higher concentration. The same conclusion can be drawn from experiments at 5 °C (∼40 s for all of the five concentrations), 16 °C (∼25 s for all of the five concentrations), and 37 °C (∼15 s for all of the five concentrations) (ESI, Fig. S2–S4†). Indeed, glycerol transport through AQP3 is unsaturated in the concentration range up to ∼0.4 M in perfect agreement with the kinetics theory based on the PMF curve showing high AQP3–glycerol affinity at one of the three binding sites.
To answer the question if the AQP3–glycerol experimental data can be interpreted in terms of diffusion over a barrier,94–99 we followed eqn (7) of ref. 99 as follows: the glycerol flux J = K(ce − c) and the coefficient  with W(z) being the PMF shown in Fig. 4 and the diffusivity D being a fitting parameter. If the simple diffusion-over-a-barrier model is valid for the glycerol transport through aquaglyceroporin AQP3 of erythrocytes, then the fitted values of D would be independent of the glycerol concentrations and weakly dependent on the temperatures (∼RT), noting that the absolute temperature T varied from 278.45 K to 309.75 K in our experiments. The fittings are shown in ESI, Fig. S6–S9.† The fitted values of D are tabulated in Table 5, which vary from case to case in contrary to the expected behaviors of D. In comparison with the fitted values of k−2 in Table 4, it is reasonable to conclude that glycerol transport through an aquaglyceroporin cannot be represented by the simple diffusion-over-a-barrier model.
| EC [glycerol] | 25 mM | 50 mM | 100 mM | 200 mM | 400 mM |
|---|---|---|---|---|---|
| 36.6 °C | 9.7 × 10⁵/s cell | 9.5 × 10⁵/s cell | 9.1 × 10⁵/s cell | 8.8 × 10⁵/s cell | 6.9 × 10⁵/s cell |
| 23.5 °C | 1.3 × 10⁶/s cell | 1.1 × 10⁶/s cell | 1.1 × 10⁶/s cell | 1.0 × 10⁶/s cell | 8.3 × 10⁵/s cell |
| 16.1 °C | 1.3 × 10⁶/s cell | 1.3 × 10⁶/s cell | 1.2 × 10⁶/s cell | 1.2 × 10⁶/s cell | 1.0 × 10⁶/s cell |
| 5.3 °C | 1.6 × 10⁶/s cell | 1.5 × 10⁶/s cell | 1.5 × 10⁶/s cell | 1.5 × 10⁶/s cell | 1.3 × 10⁶/s cell |
Conclusions
In the large-scale simulation of human aquaglyceroporin AQP3 in the erythrocyte membrane, we reached the time scale for direct observation of an event of transporting a glycerol molecule across the membrane. We observed a new transport pathway that two glycerol molecules moved collectively to transport one from the cytoplasm to the EC fluid. From the quantitative investigation, the kinetics theory based on the Gibbs free-energy gradient (the driving force for the transport process), we found the affinities of AQP3 for glycerol and the probabilities of glycerol transport pathways. With validation by experiments on human erythrocytes, we conclude that human aquaglyceroporin AQP3 has ∼500/M affinity for glycerol and that AQP3 conducts glycerol transport in an unsaturable manner for glycerol concentrations <1 M. Due to the glycerol–glycerol interactions facilitated by the AQP3 channel, an aquaglyceroporin having high affinity for its substrate can transport the substrate across the cell membrane in an unsaturated manner.Data availability
The dataset (parameters, coordinates, scripts, etc.) to replicate this study is available at Harvard Dataverse, DOI: 10.7910/DVN/V9I4YQ.Author contributions
RAR and LYC conducted the theoretical–computational work; RC and HL did the experimental measurements; LYC conceptualized the research and wrote the paper; all participated in analyzing the data and editing the manuscript.Funding
This work was supported by the NIH (GM121275). The content of this paper is solely the responsibility of the authors and does not necessarily represent the official views of the National Institutes of Health.Conflicts of interest
There are no conflicts to declare.Acknowledgements
The authors acknowledge use of computational time on Frontera at the Texas Advanced Computing Center at the University of Texas at Austin. Frontera is made possible by National Science Foundation award OAC-1818253.References
- M. H. Jacobs, H. N. Glassman and K. Parpart Arthur, J. Cell. Comp. Physiol., 1935, 7, 197–225 CrossRef CAS.
- P. G. LeFevre, J. Gen. Physiol., 1948, 31, 505 CrossRef CAS PubMed.
- W. D. Stein, Biochim. Biophys. Acta, 1962, 59, 47–65 CrossRef CAS PubMed.
- R. I. Macey, D. M. Karan and R. E. L. Farmer, in Biomembranes: passive permeability of cell membranes: a satellite symposium of the XXV International Congress of Physiological Sciences, Munich, Germany, July 25–31, 1971, organized by the Department of Physiology, University of Nijmejen, Nijmejen, Netherlands, and held in Rotterdam, July 20–22, 1971, ed. F. Kreuzer and J. F. G. Slegers, Springer US, 1972, pp. 331–340 Search PubMed.
- P. Mazur and R. H. Miller, Cryobiology, 1976, 13, 507–522 CrossRef CAS.
- A. Carlsen and J. O. Wieth, Acta Physiol. Scand., 1976, 97, 501–513 CrossRef CAS PubMed.
- K. B. L. Heller, E. C. C. Wilson and T. Hastings, J. Bacteriol., 1980, 144, 5 CrossRef PubMed.
- P. Agre, M. Bonhivers and M. J. Borgnia, J. Biol. Chem., 1998, 273, 14659–14662 CrossRef CAS PubMed.
- J. B. Heymann and A. Engel, Physiology, 1999, 14, 187–193 CrossRef CAS.
- K. Murata, K. Mitsuoka, T. Hirai, T. Walz, P. Agre, J. B. Heymann, A. Engel and Y. Fujiyoshi, Nature, 2000, 407, 599–605 CrossRef CAS PubMed.
- B. L. de Groot and H. Grubmüller, Science, 2001, 294, 2353–2357 CrossRef CAS.
- A. Engel and H. Stahlberg, in International Review of Cytology, ed. W. D. S. Thomas Zeuthen, Academic Press, Cambridge, MA, 2002, vol. 215, pp. 75–104 Search PubMed.
- T. Gonen and T. Walz, Q. Rev. Biophys., 2006, 39, 361–396 CrossRef CAS PubMed.
- J. M. Carbrey and P. Agre, Discovery of the Aquaporins and Development of the Field Aquaporins, ed. E. Beitz, Springer Berlin Heidelberg, 2009, vol. 190, pp. 3–28 Search PubMed.
- H. Sui, B.-G. Han, J. K. Lee, P. Walian and B. K. Jap, Nature, 2001, 414, 872–878 CrossRef CAS.
- G. Benga, Eur. Biophys. J., 2013, 42, 33–46 CrossRef PubMed.
- J. Abramson and A. S. Vartanian, Science, 2013, 340, 1294–1295 CrossRef PubMed.
- A. S. Verkman, M. O. Anderson and M. C. Papadopoulos, Nat. Rev. Drug Discovery, 2014, 13, 259–277 CrossRef CAS.
- A. Horner, F. Zocher, J. Preiner, N. Ollinger, C. Siligan, S. A. Akimov and P. Pohl, Sci. Adv., 2015, 1, e1400083 CrossRef PubMed.
- D. Fu, A. Libson, L. J. W. Miercke, C. Weitzman, P. Nollert, J. Krucinski and R. M. Stroud, Science, 2000, 290, 481–486 CrossRef CAS.
- E. Tajkhorshid, P. Nollert, M. Ø. Jensen, L. J. W. Miercke, J. O'Connell, R. M. Stroud and K. Schulten, Science, 2002, 296, 525–530 CrossRef CAS PubMed.
- Z. E. Newby, J. O'Connell 3rd, Y. Robles-Colmenares, S. Khademi, L. J. Miercke and R. M. Stroud, Nat. Struct. Mol. Biol., 2008, 15, 619–625 CrossRef CAS.
- K. Ishibashi, S. Sasaki, K. Fushimi, S. Uchida, M. Kuwahara, H. Saito, T. Furukawa, K. Nakajima, Y. Yamaguchi and T. Gojobori, Proc. Natl. Acad. Sci. U. S. A., 1994, 91, 6269 CrossRef CAS PubMed.
- M. Echevarría, E. E. Windhager and G. Frindt, J. Biol. Chem., 1996, 271, 25079–25082 CrossRef.
- N. Roudier, J.-M. Verbavatz, C. Maurel, P. Ripoche and F. Tacnet, J. Biol. Chem., 1998, 273, 8407–8412 CrossRef CAS PubMed.
- T. Zeuthen and D. A. Klaerke, J. Biol. Chem., 1999, 274, 21631–21636 CrossRef CAS.
- B. Yang, T. Ma and A. S. Verkman, J. Biol. Chem., 2001, 276, 624–628 CrossRef CAS.
- N. Roudier, P. Ripoche, P. Gane, P. Y. Le Pennec, G. Daniels, J.-P. Cartron and P. Bailly, J. Biol. Chem., 2002, 277, 45854–45859 CrossRef CAS.
- M. Zelenina, S. Tritto, A. A. Bondar, S. Zelenin and A. Aperia, J. Biol. Chem., 2004, 279, 51939–51943 CrossRef CAS PubMed.
- H. Kida, T. Miyoshi, K. Manabe, N. Takahashi, T. Konno, S. Ueda, T. Chiba, T. Shimizu, Y. Okada and S. Morishima, J. Membr. Biol., 2005, 208, 55–64 CrossRef CAS PubMed.
- K. Edashige, M. Tanaka, N. Ichimaru, S. Ota, K.-i. Yazawa, Y. Higashino, M. Sakamoto, Y. Yamaji, T. Kuwano, D. M. Valdez, F. W. Kleinhans and M. Kasai, Biol. Reprod., 2006, 74, 625–632 CrossRef CAS PubMed.
- E. W. Miller, B. C. Dickinson and C. J. Chang, Proc. Natl. Acad. Sci. U. S. A., 2010, 107, 15681–15686 CrossRef CAS.
- E. Campos, T. F. Moura, A. Oliva, P. Leandro and G. Soveral, Biochem. Biophys. Res. Commun., 2011, 408, 477–481 CrossRef CAS PubMed.
- G. Calamita, P. Gena, D. Ferri, A. Rosito, A. Rojek, S. Nielsen, R. A. Marinelli, G. Frühbeck and M. Svelto, Biol. Cell, 2012, 104, 342–351 CrossRef CAS.
- A. P. Martins, A. Marrone, A. Ciancetta, A. Galán Cobo, M. Echevarría, T. F. Moura, N. Re, A. Casini and G. Soveral, PLoS One, 2012, 7, e37435 CrossRef CAS PubMed.
- D. C. Soler, X. Bai, L. Ortega, T. Pethukova, S. T. Nedorost, D. L. Popkin, K. D. Cooper and T. S. McCormick, Med. Hypotheses, 2015, 84, 498–503 CrossRef CAS PubMed.
- A. Spinello, A. de Almeida, A. Casini and G. Barone, J. Inorg. Biochem., 2016, 160, 78–84 CrossRef CAS.
- V. Graziani, A. Marrone, N. Re, C. Coletti, J. A. Platts and A. Casini, Chem.–Eur. J., 2017, 23, 13802–13813 CrossRef CAS.
- M. Palmgren, M. Hernebring, S. Eriksson, K. Elbing, C. Geijer, S. Lasič, P. Dahl, J. S. Hansen, D. Topgaard and K. Lindkvist-Petersson, J. Membr. Biol., 2017, 250, 629–639 CrossRef CAS PubMed.
- M. Arif, P. Kitchen, M. T. Conner, E. J. Hill, D. Nagel, R. M. Bill, S. J. Dunmore, A. L. Armesilla, S. Gross, A. R. Carmichael, A. C. Conner and J. E. Brown, Oncol. Lett., 2018, 16, 713–720 Search PubMed.
- G. Calamita, J. Perret and C. Delporte, Front. Physiol., 2018, 9, 851 CrossRef.
- Z. Zhu, L. Jiao, T. Li, H. Wang, W. Wei and H. Qian, Oncol. Lett., 2018, 16, 2661–2667 Search PubMed.
- A. P. Martins, A. Ciancetta, A. de Almeida, A. Marrone, N. Re, G. Soveral and A. Casini, ChemMedChem, 2013, 8, 1086–1092 CrossRef CAS PubMed.
- C. Maurel, J. Reizer, J. I. Schroeder, M. J. Chrispeels and M. H. Saier, J. Biol. Chem., 1994, 269, 11869–11872 CrossRef CAS.
- M. Hansen, J. F. J. Kun, J. E. Schultz and E. Beitz, J. Biol. Chem., 2002, 277, 4874–4882 CrossRef CAS.
- M. Ishii, K. Ohta, T. Katano, K. Urano, J. Watanabe, A. Miyamoto, K. Inoue and H. Yuasa, Cell. Physiol. Biochem., 2011, 27, 749–756 CrossRef CAS PubMed.
- Y. Ohgusu, K.-y. Ohta, M. Ishii, T. Katano, K. Urano, J. Watanabe, K. Inoue and H. Yuasa, Drug Metab. Pharmacokinet., 2008, 23, 279–284 CrossRef CAS PubMed.
- A. Delgado-Bermúdez, M. Llavanera, L. Fernández-Bastit, S. Recuero, Y. Mateo-Otero, S. Bonet, I. Barranco, B. Fernández-Fuertes and M. Yeste, J. Anim. Sci. Biotechnol., 2019, 10, 77 CrossRef.
- A. Delgado-Bermúdez, M. Llavanera, S. Recuero, Y. Mateo-Otero, S. Bonet, I. Barranco, B. Fernandez-Fuertes and M. Yeste, Int. J. Mol. Sci., 2019, 20, 6255 CrossRef.
- A. Delgado-Bermúdez, F. Noto, S. Bonilla-Correal, E. Garcia-Bonavila, J. Catalán, M. Papas, S. Bonet, J. Miró and M. Yeste, Biology, 2019, 8, 85 CrossRef.
- J. A. Freites, K. L. Németh-Cahalan, J. E. Hall and D. J. Tobias, Biochim. Biophys. Acta, Biomembr., 2019, 1861, 988–996 CrossRef CAS.
- E. E. S. Ong and J.-L. Liow, Fluid Phase Equilib., 2019, 481, 55–65 CrossRef CAS.
- R. A. Rodriguez, H. Liang, L. Y. Chen, G. Plascencia-Villa and G. Perry, Biochim. Biophys. Acta, Biomembr., 2019, 1861, 768–775 CrossRef CAS PubMed.
- J. Rodríguez-Gamir, J. Xue, M. J. Clearwater, D. F. Meason, P. W. Clinton and J.-C. Domec, Plant, Cell Environ., 2019, 42, 717–729 CrossRef.
- M. Sisto, D. Ribatti and S. Lisi, in Advances in Protein Chemistry and Structural Biology, ed. R. Donev, Academic Press, 2019, vol. 116, pp. 311–345 Search PubMed.
- Y. Sonntag, P. Gena, A. Maggio, T. Singh, I. Artner, M. K. Oklinski, U. Johanson, P. Kjellbom, J. D. Nieland, S. Nielsen, G. Calamita and M. Rützler, J. Biol. Chem., 2019, 294, 7377–7387 CrossRef CAS PubMed.
- O. H. Wittekindt and P. Dietl, Pflugers Arch., 2019, 471, 519–532 CrossRef CAS PubMed.
- A. Zaragoza, M. A. Gonzalez, L. Joly, I. López-Montero, M. A. Canales, A. L. Benavides and C. Valeriani, Phys. Chem. Chem. Phys., 2019, 21, 13653–13667 RSC.
- X. Zhou and F. Zhu, J. Chem. Inf. Model., 2019, 59, 777–785 CrossRef CAS.
- S. W. de Maré, R. Venskutonytė, S. Eltschkner, B. L. de Groot and K. Lindkvist-Petersson, Structure, 2020, 28, 215–222 CrossRef PubMed.
- M. Hernando, G. Orriss, J. Perodeau, S. Lei, F. G. Ferens, T. R. Patel, J. Stetefeld, A. J. Nieuwkoop and J. D. O'Neil, Biochim. Biophys. Acta, Biomembr., 2020, 1862, 183191 CrossRef CAS PubMed.
- T. Katano, Y. Ito, K. Ohta, T. Yasujima, K. Inoue and H. Yuasa, Drug Metab. Pharmacokinet., 2014, 29, 244–248 CrossRef CAS.
- Y. Liu, D. Promeneur, A. Rojek, N. Kumar, J. Frøkiær, S. Nielsen, L. S. King, P. Agre and J. M. Carbrey, Proc. Natl. Acad. Sci. U. S. A., 2007, 104, 12560–12564 CrossRef CAS.
- H. Tsukaguchi, C. Shayakul, U. V. Berger, B. Mackenzie, S. Devidas, W. B. Guggino, A. N. van Hoek and M. A. Hediger, J. Biol. Chem., 1998, 273, 24737–24743 CrossRef CAS PubMed.
- S. Hatakeyama, Y. Yoshida, T. Tani, Y. Koyama, K. Nihei, K. Ohshiro, J.-I. Kamiie, E. Yaoita, T. Suda, K. Hatakeyama and T. Yamamoto, Biochem. Biophys. Res. Commun., 2001, 287, 814–819 CrossRef CAS.
- K. Ishibashi, T. Morinaga, M. Kuwahara, S. Sasaki and M. Imai, Biochim. Biophys. Acta, Gene Struct. Expression, 2002, 1576, 335–340 CrossRef CAS.
- A. Mobasheri, M. Shakibaei and D. Marples, Histochem. Cell Biol., 2004, 121, 463–471 CrossRef CAS PubMed.
- D. C. Soler, A. E. Young, A. D. Griffith, P. F. Fu, K. D. Cooper, T. S. McCormick and D. L. Popkin, Exp. Dermatol., 2017, 26, 949–951 CrossRef CAS.
- K. Gotfryd, A. F. Mósca, J. W. Missel, S. F. Truelsen, K. Wang, M. Spulber, S. Krabbe, C. Hélix-Nielsen, U. Laforenza, G. Soveral, P. A. Pedersen and P. Gourdon, Nat. Commun., 2018, 9, 4749 CrossRef PubMed.
- E. Beitz, S. Pavlovic-Djuranovic, M. Yasui, P. Agre and J. E. Schultz, Proc. Natl. Acad. Sci. U. S. A., 2004, 101, 1153–1158 CrossRef CAS.
- K. Edashige, S. Ohta, M. Tanaka, T. Kuwano, D. M. Valdez Jr, T. Hara, B. Jin, S.-i. Takahashi, S. Seki, C. Koshimoto and M. Kasai, Biol. Reprod., 2007, 77, 365–375 CrossRef CAS PubMed.
- J. M. Lahmann, J. D. Benson and A. Z. Higgins, Cryobiology, 2018, 80, 1–11 CrossRef CAS.
- M. J. Borgnia and P. Agre, Proc. Natl. Acad. Sci. U. S. A., 2001, 98, 2888–2893 CrossRef CAS.
- L. Y. Chen, J. Struct. Biol., 2013, 181, 71–76 CrossRef CAS PubMed.
- L. Y. Chen, Biochim. Biophys. Acta, Biomembr., 2013, 1828, 1786–1793 CrossRef CAS.
- F. J. Moss, P. Mahinthichaichan, D. T. Lodowski, T. Kowatz, E. Tajkhorshid, A. Engel, W. F. Boron and A. Vahedi-Faridi, Front. Physiol., 2020, 11, 728 CrossRef.
- A. H. Bryk and J. R. Wiśniewski, J. Proteome Res., 2017, 16, 2752–2761 CrossRef CAS PubMed.
- J. T. Dodge and G. B. Phillips, J. Lipid Res., 1967, 8, 667–675 CrossRef CAS.
- M. S. Bretscher, Nature (London), New Biol., 1972, 236, 11–12 CrossRef CAS.
- R. F. A. Zwaal and A. J. Schroit, Blood, 1997, 89, 1121 CrossRef CAS.
- J. A. Virtanen, K. H. Cheng and P. Somerharju, Proc. Natl. Acad. Sci. U. S. A., 1998, 95, 4964 CrossRef CAS.
- R. Chan, M. Falato, H. Liang and L. Y. Chen, RSC Adv., 2020, 10, 21283–21291 RSC.
- W. Humphrey, A. Dalke and K. Schulten, J. Mol. Graphics, 1996, 14, 33–38 CrossRef CAS PubMed.
- S. Jo, T. Kim, V. G. Iyer and W. Im, J. Comput. Chem., 2008, 29, 1859–1865 CrossRef CAS.
- J. Lee, X. Cheng, J. M. Swails, M. S. Yeom, P. K. Eastman, J. A. Lemkul, S. Wei, J. Buckner, J. C. Jeong, Y. Qi, S. Jo, V. S. Pande, D. A. Case, C. L. Brooks, A. D. MacKerell, J. B. Klauda and W. Im, J. Chem. Theory Comput., 2016, 12, 405–413 CrossRef CAS PubMed.
- J. Lee, D. S. Patel, J. Ståhle, S.-J. Park, N. R. Kern, S. Kim, J. Lee, X. Cheng, M. A. Valvano, O. Holst, Y. A. Knirel, Y. Qi, S. Jo, J. B. Klauda, G. Widmalm and W. Im, J. Chem. Theory Comput., 2019, 15, 775–786 CrossRef CAS.
- J. C. Phillips, R. Braun, W. Wang, J. Gumbart, E. Tajkhorshid, E. Villa, C. Chipot, R. D. Skeel, L. Kalé and K. Schulten, J. Comput. Chem., 2005, 26, 1781–1802 CrossRef CAS PubMed.
- R. B. Best, X. Zhu, J. Shim, P. E. M. Lopes, J. Mittal, M. Feig and A. D. MacKerell, J. Chem. Theory Comput., 2012, 8, 3257–3273 CrossRef CAS.
- K. Vanommeslaeghe, E. Hatcher, C. Acharya, S. Kundu, S. Zhong, J. Shim, E. Darian, O. Guvench, P. Lopes, I. Vorobyov and A. D. Mackerell, J. Comput. Chem., 2010, 31, 671–690 CrossRef CAS PubMed.
- J. B. Klauda, R. M. Venable, J. A. Freites, J. W. O'Connor, D. J. Tobias, C. Mondragon-Ramirez, I. Vorobyov, A. D. MacKerell and R. W. Pastor, J. Phys. Chem. B, 2010, 114, 7830–7843 CrossRef CAS PubMed.
- L. D. Landau and E. M. Lifshitz, Statistical Physics, Part 1, Pergamon Press, Tarrytown, 1985 Search PubMed.
- H.-J. Woo and B. Roux, Proc. Natl. Acad. Sci. U. S. A., 2005, 102, 6825–6830 CrossRef CAS.
- R. A. Rodriguez, L. Yu and L. Y. Chen, J. Chem. Theory Comput., 2015, 11, 4427–4438 CrossRef CAS.
- J. M. Diamond and Y. Katz, J. Membr. Biol., 1974, 17, 121–154 CrossRef CAS PubMed.
- S.-J. Marrink and H. J. C. Berendsen, J. Phys. Chem., 1994, 98, 4155–4168 CrossRef CAS.
- S. Mitragotri, M. E. Johnson, D. Blankschtein and R. Langer, Biophys. J., 1999, 77, 1268–1283 CrossRef CAS PubMed.
- W. T. Coffey, Y. P. Kalmykov, S. V. Titov and B. P. Mulligan, Phys. Rev. E: Stat., Nonlinear, Soft Matter Phys., 2006, 73, 061101 CrossRef CAS PubMed.
- T. X. Xiang and B. D. Anderson, Adv. Drug Delivery Rev., 2006, 58, 1357–1378 CrossRef CAS PubMed.
- M. Orsi and J. W. Essex, Soft Matter, 2010, 6, 3797–3808 RSC.
Footnote |
| † Electronic supplementary information (ESI) available: Part I gives four additional figures that are discussed but not included in the main text. Part II gives the long formulas of the transport kinetics and an illustration of saturated vs. unsaturated transport. Part III contains four figures for fitting the experimental data to a simple model of diffusion over a barrier. See DOI: 10.1039/d0ra05262k |
| This journal is © The Royal Society of Chemistry 2020 |