DOI:
10.1039/D0RA05157H
(Paper)
RSC Adv., 2020,
10, 40916-40922
A one-pot synthesis of a monolithic Cu2O/Cu catalyst for efficient ozone decomposition†
Received
11th June 2020
, Accepted 16th September 2020
First published on 10th November 2020
Introduction
It is well understood that the stratospheric ozone layer hinders short-wavelength ultraviolet light from threatening lives on the surface of Earth.1 However, the ground-level ozone is a destructive chemical, which has been generated in high concentrations via photo-chemical reactions over the past few decades in the summers and is commonly detected in surrounding human environments, such as aircraft cabins, photocopier offices, laser printers, and sterilizers. (Batakliev et al., 2015;4 Hollósy, 2002;1 Oyama, 2000;3 Rim et al., 2018 (ref. 2)). Therefore, the ozone exposure standard has regularly been set at about 70 ppb over an average time of 8 hours.5
The degradation rate of ozone in ambient atmosphere is comparatively low, and thus the contaminants cannot be entirely removed naturally. Hence, the catalytic ozone decomposition process has received considerable attention than other removal techniques such as adsorption6,7 and thermal decomposition.8,9 Lately, the catalytic ozone decomposition technique at low temperatures has also been communicated,10–12 and long-term studies confirmed the approach as safe, efficient, cost-effective, and fast ozone conversion under ambient conditions.11–13 A series of essential catalysts for ozone decomposition have been developed, of which the most active and productive candidates for catalytically converting ozone to oxygen molecules are indeed noble metals and transition metal oxides.12,14 Transition metal oxide-based catalysts are incredibly efficient from an environmental perspective and simultaneously provide a convenient and affordable way to decompose the ozone molecules. In this regard, transition metal oxides including MnO2,15–17 Cu2O/CuO,10,18 Fe2O3,19,20 and NiO21 have been reported as active catalysts.12
Due to the low price, environmental friendliness, and other versatile functionalities, Cu-based materials have been extensively studied and synthesized through various routes in the recent past decades. Our group has recently communicated Cu2O powder as a promising catalyst to decompose 20 ppm ozone with 100% conversion at space velocity of 240![[thin space (1/6-em)]](https://www.rsc.org/images/entities/char_2009.gif) 000 mL g−1 h−1, which has been acknowledged as one of the most active powder-based catalysts.10,18,22 However, the reported powder-based catalysts are not practical to render for the gas-phase catalytic decomposition until they are integrated into a porous substrate to form a monolithic catalyst. Then, problems such as weak adhesion between the substrate and catalyst powders, sophisticated multi-step or long term integration, and fabrication at high temperatures have been encountered.23–27 In this study, we successfully propose a one-pot synthesis of the monolithic Cu2O nanocatalyst on the surface of a Cu foam by a facile chemical oxidation approach without using additives, which offer superior ozone catalytic performance with high stability and low production cost. This study provides not only a simple synthesis method of the supported catalyst, but also a highly active Cu2O/Cu ozone decomposition material.
000 mL g−1 h−1, which has been acknowledged as one of the most active powder-based catalysts.10,18,22 However, the reported powder-based catalysts are not practical to render for the gas-phase catalytic decomposition until they are integrated into a porous substrate to form a monolithic catalyst. Then, problems such as weak adhesion between the substrate and catalyst powders, sophisticated multi-step or long term integration, and fabrication at high temperatures have been encountered.23–27 In this study, we successfully propose a one-pot synthesis of the monolithic Cu2O nanocatalyst on the surface of a Cu foam by a facile chemical oxidation approach without using additives, which offer superior ozone catalytic performance with high stability and low production cost. This study provides not only a simple synthesis method of the supported catalyst, but also a highly active Cu2O/Cu ozone decomposition material.
Experimental
Material and method
Hydrochloric acid (HCl), aqueous ammonia (NH4OH), and acetone (CH3COCH3) of analytical grade were purchased from Sinopharm Chemical Reagent Co. Ltd. and utilized as received without further purification. The ultrapure water with a resistivity of 18.2 MΩ cm was used for all the synthesis and experiments. A commercial Cu foam sample (500 mesh) was first cut into round-shape pieces (diameter 12 mm, thickness 2 mm). In general, the foam was first immersed in diluted HCl and thoroughly washed with deionized water, then put in acetone and sonicated for 5 min to remove impurities and native oxides on the Cu foam. Afterward, the sample was dried in N2 gas for further use. In a typical synthesis experiment, the pre-processed Cu foam was quickly transferred to a glass beaker and immersed in a solution containing 0.4 mL of 1 M HCl, 27 μL of 13.38 M NH3, and 20 mL distilled water. The glass beaker was covered by an aluminum foil. Then, the experiments were carried out at constant temperatures (60, 70, 80, and 90 °C) for a given oxidation time (8, 12, 18, and 24 h). The Cu oxidation condition in the solution was then labeled as CuTemperature, Time (e.g., Cu80 °C, 8 h denotes 80 °C, 8 h).
Characterization
The crystalline structures were recorded using a powder X-ray diffractometer (XRD) on a PANalytical X′ Pert high score system (40 kV, 40 mA) with Cu-Kα radiation (λ = 0.15418 nm). The diffraction angles were selected from 5° to 90° with a step size of 0.033° and at a rate of 17° min−1. The morphology was studied using a scanning electron microscope (SEM, JEOL JSM-6700F, Japan, 15 kV, 10 mA). The Raman spectra were recorded on Jobin-Yvon LABRAM HR800 Raman Microscope with a resolution of 2 cm−1 at an excitation of 532 nm laser. The surface analyses were determined via X-ray photoelectron spectroscopy (XPS) on an XLESCALAB 250Xi electron spectrometer from VG Scientific with mono-chromatic Al-Kα radiation. The surface area was characterized by a BET specific surface area and pore size analyser (BJBUILDER SSA-7300, China). The humidity was measured by a humidity sensor (Center 310 RS-233, TES, Taiwan).
Catalyst test
The as-synthesized sample was loaded in a continuous tube reactor (inner diameter 14 mm). 20 ppm ozone was generated by a commercial ozone generator (COM-AD-01-OEM, Anseros Company, Anshan, China) and the total flow rate was maintained at 200 standard cubic centimeters per minute (sccm, 190 sccm air and 10 sccm oxygen) using mass-flow controllers, equivalent to a gas hourly space velocity (GHSV) of 12500 h−1. The inlet and outlet ozone concentrations (Cin and Cout, respectively) in the gas phase were determined by an ozone detector (Model 106M, 2B Technologies, USA), and the conversion was calculated as 100% × (Cin − Cout)/Cin.
Results and discussions
Cu2O/Cu was initially synthesized via a simple oxidation approach in the solution containing 0.4 mL 1 M HCl, 27 μL 13.38 M NH4OH and 20 mL distilled water. Upon the introduction of fresh Cu foam into the solution, the first sign of the oxidation reaction appeared from the change in the solution color to blue after a couple of minutes, as shown in Fig. S1 in the ESI.† Also, the molar ratio of NH4OH:HCl was optimized as 1:0.9, as shown in Table S1.†
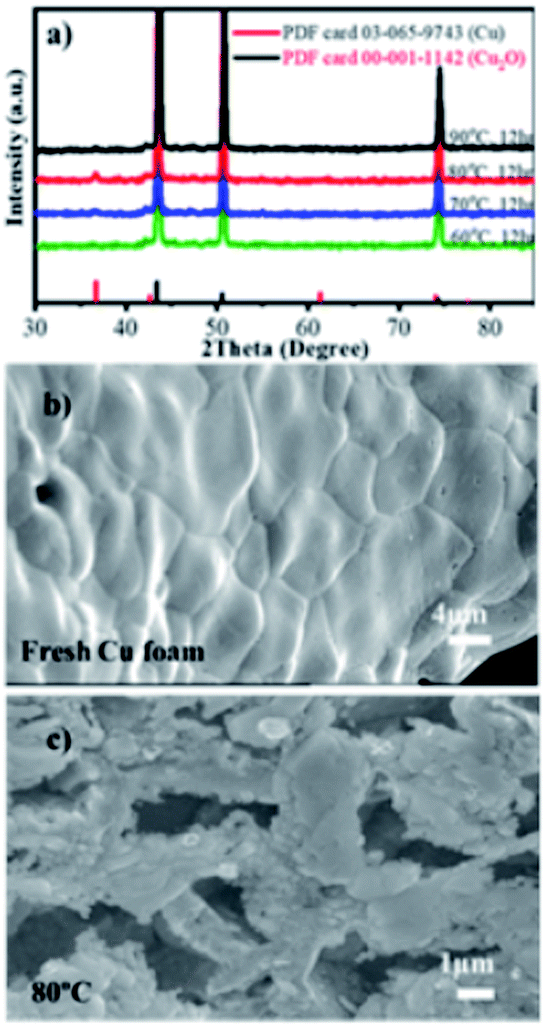
XRD and SEM were employed to investigate the crystal structure and morphology of the samples prepared at different reaction temperatures of 60–90 °C for 12 h. As exhibited in Fig. 1a, the XRD patterns of the Cu foam reacted at 60, 70 and 90 °C were observed with three sharp peaks at 43.4°, 50.6° and 74.3°, which can be indexed to the (111), (200) and (220) planes of the Cu crystal structure (JCPDS 03-065-9743), respectively. However, after the reaction at 80 °C, the oxidation of superficial Cu leads to the formation of the Cu2O nanocatalyst, which can be verified by the additional XRD peak at 2θ = 36.6°, attributing to the (111) plane of the face-centered cubic structure of Cu2O (JCPDS 00-001-1142). This confirms that the hybrid Cu2O/Cu nanocatalysts have been successfully obtained by the one-pot synthesis method, which can be further verified by the SEM images in Fig. 1b and c. Fig. 1b shows a relatively smooth surface of pure Cu foam with a three-dimensional open network framework. Notably, crystalline Cu2O particles were observed at Cu80 °C, 12 h (mean < 100 nm), as shown in Fig. 1c. Therefore, the synthesis temperature was set at 80 °C, and the growth time was further investigated in order to obtain as much Cu2O particles as possible on the surface of the Cu foam. The size of Cu2O formed at 60 °C is 90 nm, and at 70 and 90 °C are less than 115 nm. It should also be noted that after 8 h treatment at 80 °C, the BET specific surface area of the Cu foam was only 5.8 m2 g−1, as shown in Fig. S2,† showing the existence of few pores in the Cu2O/Cu catalyst.
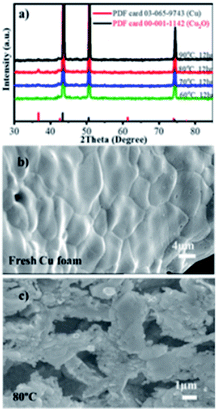 |
| | Fig. 1 (a) XRD patterns of Cu2O/Cu obtained at different temperatures, and SEM images of (b) fresh Cu foam (c) Cu80 °C, 12 h. | |
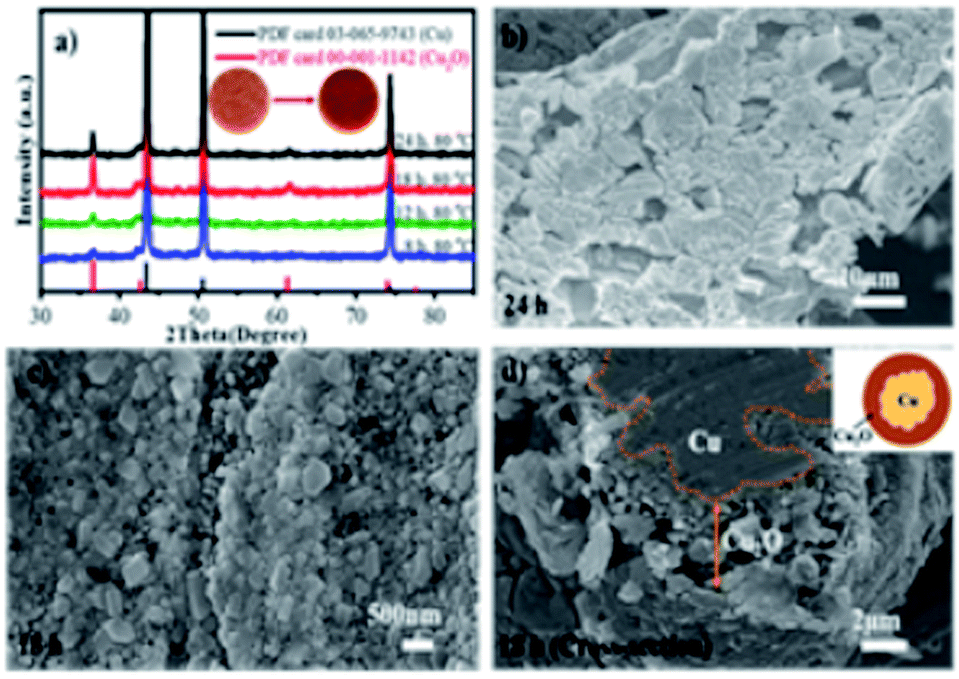
Afterward, the reaction time was varied from 8 to 24 h, and the XRD patterns were obtained and are shown in Fig. 2a. It is clear that the Cu2O peaks at 36.6° become more visible as the reaction time increases from 8 to 18 h, thereby signifying that the crystallinity of Cu2O was controlled by the oxidation time and temperature and the Cu foam turned brick reddish after 18 h, as shown in the inset of Fig. 2a. It should also be noted that the XRD patterns only belong to the deposited Cu2O layer and the underlying Cu metal substrate without any detectable impurities such as CuO. However, after 24 h reaction time, the surface Cu2O was partially dissolved in the solution as clearly depicted in Fig. 2b. As a comparison, the Cu2O layer obtained after 18 h (mostly < 100 nm) is dense and homogeneously covers the entire surface of the Cu foam as shown in the surface and cross-sectional SEM images in Fig. 2c and d. The micro and nanoscale morphology of Cu2O plays a vital role in determining their properties such as catalytic activity.28 Further, the cross-sectional SEM images are employed to measure the average thickness of the layer, which is about 2.67 μm for the Cu80 °C, 18 h sample. The SEM images reveal that the proper depth and the bridging structure of the as-synthesized irregular Cu2O nanoparticles provide a significantly extra high contact surface area for ozone decomposition.
 |
| | Fig. 2 (a) XRD patterns of Cu2O/Cu obtained at different oxidation times, SEM images of (b) Cu80 °C, 24 h, (c) surface SEM and (d) cross-sectional SEM images of Cu80 °C, 18 h. | |
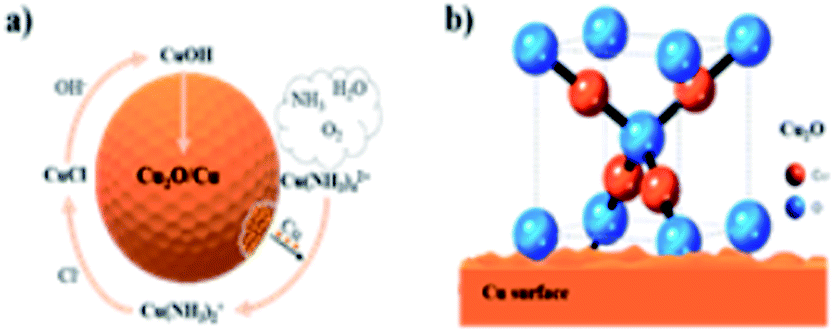
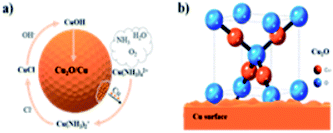
To understand the reaction mechanism of the Cu2O formation on the Cu foam, control experiments were carried out. If aqueous ammonia was solely used without HCl, the Cu foam would dissolve gradually and the solution would change into blue color, which infers that the role of aqueous ammonia is to dissolve Cu. On the other side, if aqueous ammonia is not used, Cu foam would remain unchanged in HCl as HCl cannot dissolve Cu. Therefore, initially, Cu dissolves readily with the help of dissolved oxygen in aqueous ammonia, as shown in eqn (1). This step is fast to occur and the deep blue color infers the product of the Cu and NH3H2O complex (Cu(NH3)42+, coordination constant 1013.32). This ammine complex has a relatively higher oxidation potential as to oxidize the metallic Cu further into the Cu(NH3)2+ complex (coordination constant 1010.86), as shown in eqn (2).29 Further, with the help of Cl−, CuCl would precipitate onto the surface of the Cu foam due to the low solubility product of 1.72 × 10⁻⁷, as shown in eqn (3). Then, CuCl would react fast with local OH− to form less soluble CuOH (solubility product 1 × 10⁻¹⁴), as shown in eqn (4).30–32 Finally, the intermediate CuOH would immediately decompose into Cu2O due to its thermodynamic instability, as shown in eqn (5).33
| | |
2Cu + 8NH3 + O2 + 2H2O → 2Cu(NH3)42+ + 4OH−
| (1) |
| | |
Cu(NH3)42+ + Cu → 2Cu(NH3)2+
| (2) |
| | |
Cu(NH3)2+ + Cl− → 2NH3 + CuCl
| (3) |
| | |
2CuCl + 2OH− → 2CuOH+ 2Cl− + H2O
| (4) |
Herein, a stable layer of Cu2O was formed with noticeable thickness as Cu was exposed to NH3H2O and Cl−. The outline mechanism of the Cu2O synthesis is illustrated schematically in Fig. 3.
 |
| | Fig. 3 Schematic of (a) the Cu2O formation mechanism and (b) the lattice model. | |
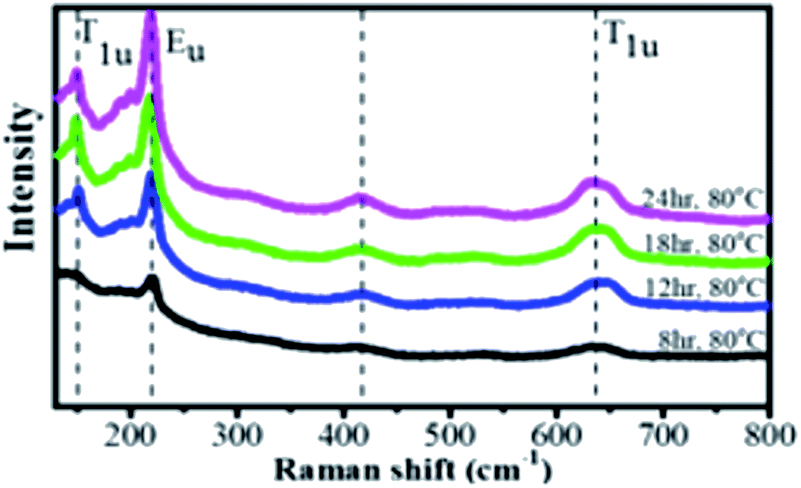
In order to further verify the crystal structure of the product, Raman spectra were obtained, as shown in Fig. 4. The Cu2O layer exhibited four distinct peaks in the spectra at 150, 220, 420, and ∼640 cm−1.34 The origin of 150, 220, and ∼640 cm−1 peaks are known to be due to the Γ−(1)15, 2Γ−12 and Γ−(2)15 phonons in good agreement with the literature,34–36 respectively. Also, the peak at 420 cm−1 is assigned to the region of the multiphonon process.37 Different orientations of the samples may cause a discrepancy in the Cu2O Raman peak intensities.38 Naturally, the Γ−(1)15 and Γ−(2)15 phonons can be activated by either local defects or impurities in Raman scattering. The Raman results are consistent with the SEM results, in which catalysts are formed incompletely. The Γ−(1)15 and 2Γ−12 phonons at 150 and 220 cm−1 can be ascribed to the Cu tetrahedron rotations around its center and was reported to be very sensitive to the surface damages.39
 |
| | Fig. 4 Raman spectra with main peaks at 150, 220, 420, and 635 cm−1 (dashed vertical lines) excited by a 532 nm laser. | |
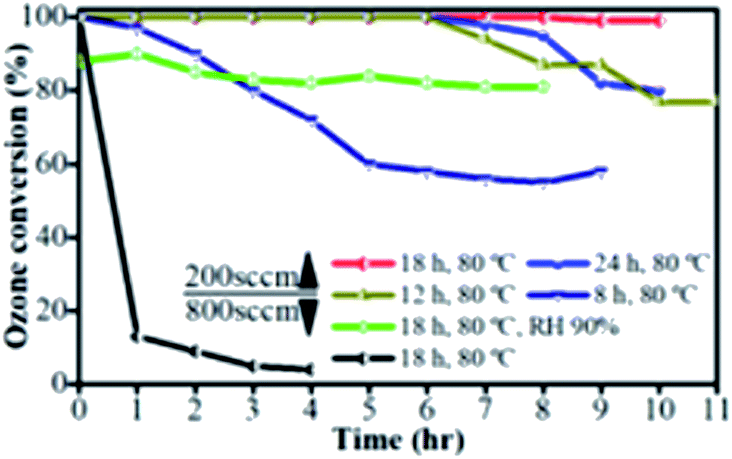
Then, the catalytic performances of the Cu2O/Cu samples were tested for the removal of O3 at ambient temperature, as depicted in Fig. 5. In general, three dimensional porous Cu foam provides the contact possibility and Cu2O provides the active sites compared with the bulk Cu.26 In this study, 20 ppm ozone with 200 sccm flow rate (190 sccm air and 10 sccm O2) and a GHSV of 12500 h−1 was introduced into the as-prepared Cu2O/Cu. The efficiency remains 100% over 6 h of continuous operation in dry air conditions for the Cu2O/Cu catalyst prepared at 80 °C for 12 h and 24 h, and then slightly deviated. The efficiency of the Cu2O/Cu catalyst for 18 h oxidation time is up to 98% over 10 h among the other samples. Also, to explore the catalytic activity and stability in the real situation, ozone conversion was performed in the presence of water vapor (relative humidity, RH). It is not much affected by 90% RH, and after an 8 h test, the ozone conversion maintained approximately 80% efficiency. This high performance can be ascribed to the as-prepared interconnected Cu2O nanoparticles and ultra-high surface area on the surface of porous Cu foam. However, the activity was dramatically dropped for a higher flow rate of 800 sccm (GHSV of 50000 h−1), which might be the result of the low contact time of O3 with the catalyst for such a high flow rate. Besides, the Cu foam was separately verified and possessed low efficiency (less than 15 min activity) in ozone decomposition performance. The monolithic ozone catalysts are compared in Table 1, where it is clear that the obtained catalyst shows highly active O3 decomposition performance in dry and relative humidity compared to other monolithic catalysts.
 |
| | Fig. 5 Catalytic performance of ozone conversion over the as-prepared catalysts, flow rate = 200 sccm and 800 sccm, ozone concentration = 20 ppm, GHSV = 12500 and 50000 h−1. | |
Table 1 A comparison of the ozone decomposition performance of the reported monolithic catalysts
| Catalysts |
Conc. (ppm) |
T (°C) |
RH (%) |
SV (h−1) |
Conv. (%) |
Reaction rate (mmol L−1 h−1) |
Ref. |
| MOx/γ-Al2O3 |
2 |
40 |
40 |
31940 |
≤42 |
1.04 |
12 |
| MnOx + MnCO3 |
14 |
25 |
Dry air |
460000 |
85 |
244.34 |
40 |
| Pd-MnOx/La-Al2O3 |
0.6 |
14 |
85–90 |
380000 |
82 |
7.94 |
41 |
| Pd-MnOx/SiO2 |
0.6 |
14 |
85–90 |
380000 |
82 |
7.94 |
41 |
| Pd-MnOx/γ-Al2O3 |
0.6 |
14 |
85–90 |
380000 |
77 |
7.45 |
41 |
| Pd-MnOx/SiO2–Al2O3-350 °C |
0.6 |
40 |
55–65 |
635000 |
90 |
13.34 |
42 |
| Pd-MnOx/SiO2–Al2O3 with 80% MnOx |
0.58 |
45 |
55–65 |
510000 |
>90 |
10.19 |
43 |
| Cu2O/Cu |
20 |
25 |
90 |
12500 |
>80 |
8.19 |
This work |
| Cu2O/Cu |
20 |
25 |
Dry air |
12500 |
>98 |
10.04 |
This work |
It has been earlier reported that the catalytic ozone decomposition on Cu2O can be described as per the eqn (6)–(8), where freeing adsorbed oxygen species such as O22− on Cu2O is the rate-determining step (eqn (8)).18
| | |
O3 + [Cu+] → O2 + Oads−[Cu2+]
| (6) |
| | |
O3 + Oads−[Cu2+] + [Cu+] → O2 + O22−[Cu2+]2
| (7) |
| | |
O22−[Cu2+]2 → O2 + 2[Cu+] (slow)
| (8) |
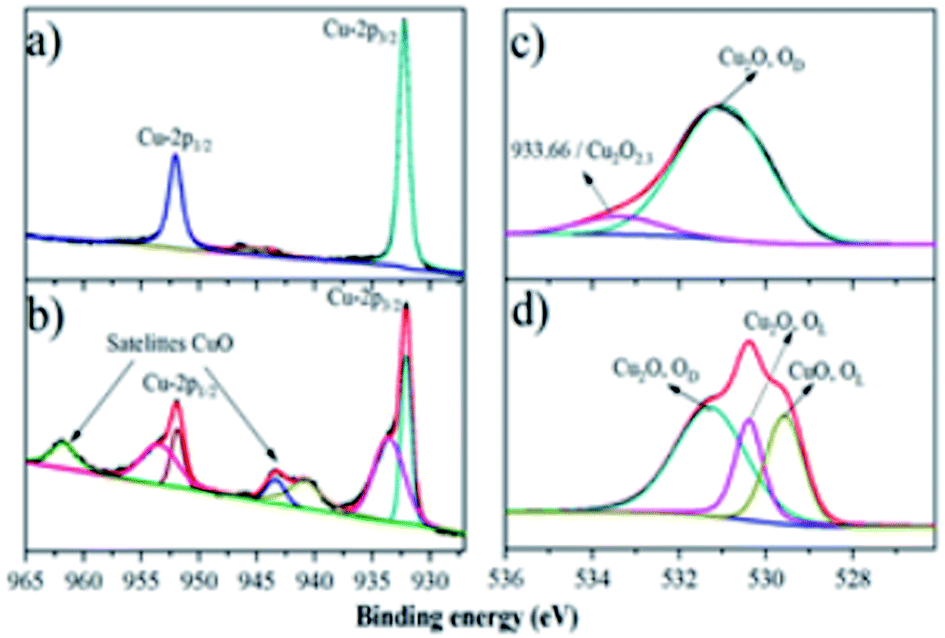
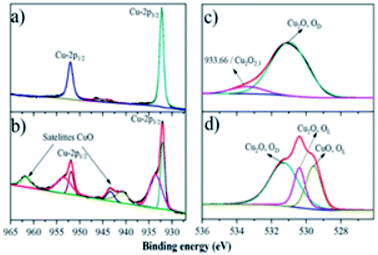
To further explore the surface property difference of the catalysts, XPS was conducted to verify and address the Cu2O composites before and after performing the ozone decomposition test, as shown in Fig. 6. The two main peaks located at ∼932–935 eV and ∼952–955 eV come from the Cu 2p3/2 and Cu 2p1/2 orbits from Cu2O.44 Moreover, the shakeup satellite feature located at 943–947 eV in Fig. 6a demonstrated the unfilled electron state of Cu 3d orbitals45 and the 3d shell may contain 9.6 or 9.5 electrons,46,47 which can be used to prove the presence of Cu2O. LMM-2 Auger transition in the XPS spectra is checked to discriminate Cu from Cu2O owing to the overlapping binding energies. The LMM-2 Auger transition peak is located at about 570 eV (Fig. S3† in the ESI) in the samples, which can be ascribed to Cu2O rather than Cu (568 eV).48 Therefore, the Cu foam surface was totally covered by the Cu2O nanoparticles. In the meanwhile, after the ozone decomposition experiment, a shoulder peak at 933 eV and satellite peaks at about 943 and 962 eV appeared, as shown in Fig. 6b, inferring that some of the Cu(I) ions are oxidized into Cu(II). The oxidation of Cu(I) into Cu(II) would not be the main reason of the catalyst activity according to a previous study.18 Therefore, O 1s spectra were obtained and compared as shown in Fig. 6c and d.
 |
| | Fig. 6 Composition study of Cu2O, Cu 2p XPS spectra of (a) Cu80 °C, 18 h, (b) Cu80 °C, 18 h after the O3 catalytic process, and O 1s XPS spectra of (c) Cu80 °C, 18 h, and (d) Cu80 °C, 18 h after the O3 catalytic process. | |
As shown in Fig. 6c, the broad O 1s peak has been generally deconvoluted into multiple overlapping peaks at about 529.6, 530.2, and 531.4 eV, attributing to the lattice oxygen (OL) in CuO, lattice oxygen in Cu2O, and defective oxide (oxygen vacancy),27,49–51 respectively. It is clear in Fig. 6c that Cu80 °C, 18 h has relatively high oxygen defect, which might be the reason of the relatively higher catalytic property. A very weak peak at 933.66 eV resulting from the Cu–O bonds of a small fraction of none crystalline Cu2O2.3 (ref. 51) in the O 1s spectra of Cu80 °C, 18 h (Fig. 6c), might also contribute to the high catalytic performance.50 After the O3 test, the appearance of the lattice oxygen of CuO is in good agreement with the Cu 2p spectra. It should be noted that Cu2O would be deactivated if the intermediate surface adsorbed oxygen (O22−) would accumulate on the surface, whilst the partial oxidation of Cu(I) would not deactivate the catalyst as revealed in this study. Cu2O is an intrinsically p-type semiconductor, where the positively charged holes would attract electrons from the O22− and thus release the intermediate to accelerate the decomposition of O3.
As a comparison, sodium hydroxide and urea were used instead of NH3 in the preparation. As shown in Fig. 7, the catalytic effect was clearly worse than using NH3 when NaOH and urea were applied in the processing of Cu foam. NaOH can react rapidly with HCl, and the product NaCl is too stable to participate in the oxidation reaction; on the other hand, 1 mol urea decomposes in an acidic aqueous solution at 80 °C into 2 mol NH3, excessive ammonia can form complex Cu(NH3)2+, which may destroy the cuprous oxide layer of the Cu foam. When a copper foil was used instead of the copper foam, almost no catalytic effect on ozone decomposition was observed under the same conditions (equal mass). It may be due to the nonporous structure and thus limited the contact of copper foil with ozone.
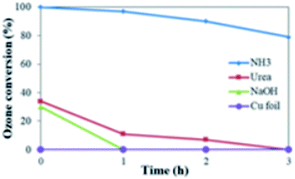 |
| | Fig. 7 Comparison of the catalytic effect in using different alkali at 80 °C, 8 h. | |
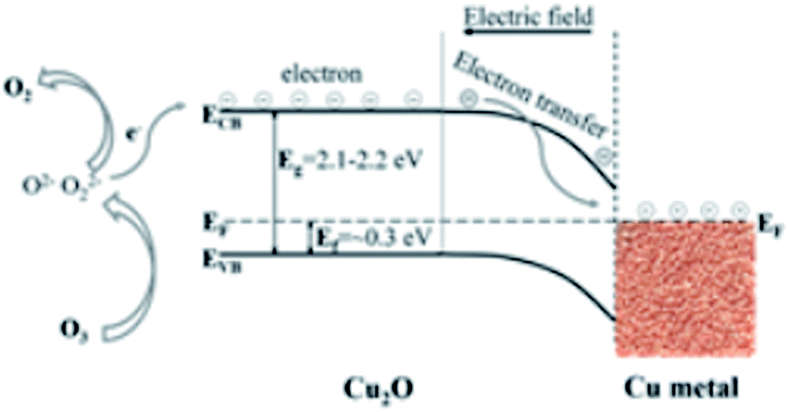
In the meanwhile, there would also exist a Schottky barrier between the surface Cu2O and the Cu foam, as reported by Iwanoski et al.52 For p-type Cu2O semiconductors, the Fermi level lies approximately at 0.3 eV above the valence band level.53,54 Also, it is reported that the measured electron affinity is about 3.2 eV that does not vary on changing the temperature of the Cu2O samples.55,56 Consequently, considering the estimated energy gap of 2.1–2.2 eV,55–58 the work function for Cu2O lies in the range of 5.0–5.1 eV. Furthermore, the reported work function values for bulk Cu vary between 4.2 and 4.6 eV.59,60 Taking these into considerations, it is likely for the electrons to drift from Cu towards Cu2O at the interface. In this study, the most possible scenario for the barrier-height results is establishing an electron-rich region at the Cu2O/Cu interface. Based on the Schottky–Mott rule, a suggested energy band structure diagram of Cu/Cu2O and an ozone reaction process are exhibited in Fig. 8, where the Schottky barrier would also contribute to the electron transfer in the O3 degradation process. Therefore, all these results show the potency of these defective nanometer-sized Cu2O particles heterojunctioned on the Cu foam for highly active ozone decomposition.
 |
| | Fig. 8 Schematic of the possible charge transfer mechanism at the Cu–Cu2O interface with consideration of ozone decomposition illustration. | |
Conclusions
A monolithic Cu2O/Cu hybrid catalyst was successfully synthesized by a one pot wet chemical oxidation of Cu foam in an aqueous solution containing NH3 and HCl. The obtained Cu2O/Cu could be readily used for O3 decomposition, and the optimized preparation conditions are NH3:HCl = 1:0.9, oxidation temperature of 80 °C and time 18 h. When adopted for decomposing 20 ppm O3 at gas hourly space velocity of 12500 h−1, the catalyst shows a high degradation efficiency of >98% in 10 h run in dry air and >80% in 90% relative humidity. The high efficiency can be attributed to the porous structure and abundant defects in Cu2O nanoparticles and also to the Schottky barrier between Cu2O and Cu, facilitating the electron transfer from O3 degradation intermediate O22− to the catalyst. Therefore, the Cu2O/Cu-supported catalyst not only possesses the advantage of a facile synthesis and low cost, but also shows its promise in depredating O3 contaminants.
Conflicts of interest
There are no conflicts to declare.
Acknowledgements
This research was financially supported by the National Key R&D Program of China (2016YFC0207100), the Strategic Priority Research Program of the Chinese Academy of Sciences (XDB05050400).
References
- F. Hollósy, Micron, 2002, 33, 179–197 CrossRef
 .
. - D. Rim, E. T. Gall, S. Ananth and Y. Won, Build. Environ., 2018, 130, 40–48 CrossRef .
- S. T. Oyama, Catal. Rev. - Sci. Eng., 2000, 42, 279–322 CrossRef CAS .
- T. Batakliev, V. Georgiev, M. Anachkov, S. Rakovsky and G. E. Zaikov, Phys. Chem. Res. Eng. Appl. Sci., 2015, 1, 273 Search PubMed .
- J. R. Balmes, Am. J. Respir. Crit. Care Med., 2019, 200, 958–959 CrossRef .
- K. Thomas, P. E. Hoggan, L. Mariey, J. Lamotte and J. C. Lavalley, Catal. Lett., 1997, 46, 77–82 CrossRef CAS .
- K. M. Bulanin, J. C. Lavalley and A. A. Tsyganenko, J. Phys. Chem., 1995, 99, 10294–10298 CrossRef CAS .
- S. W. Benson and A. E. Axworthy, J. Chem. Phys., 1957, 26, 1718–1726 CrossRef CAS .
- E. Castellano and H. J. Schumacher, J. Chem. Phys., 1962, 36, 2238 CrossRef CAS .
- S. Gong, J. Chen, X. Wu, N. Han and Y. Chen, Catal. Commun., 2018, 106, 25–29 CrossRef CAS .
- J. Ji, Y. Fang, L. He and H. Huang, Catal. Sci. Technol., 2019, 9, 4036–4046 RSC .
- B. Dhandapani and S. T. Oyama, Appl. Catal., B, 1997, 11, 129–166 CrossRef CAS .
- C. Subrahmanyam, D. A. Bulushev and L. Kiwi-Minsker, Appl. Catal., B, 2005, 61, 98–106 CrossRef CAS .
- T. Batakliev, V. Georgiev, M. Anachkov, S. Rakovsky and G. E. Zaikov, Interdiscip. Toxicol., 2014, 7, 47–59 Search PubMed .
- H. Wang, P. Rassu, X. Wang, H. Li, X. Wang, X. Wang, X. Feng, A. Yin, P. Li, X. Jin, S.-L. Chen, X. Ma and B. Wang, Angew. Chem., 2018, 130, 16654–16658 CrossRef .
- W. Li, G. V. Gibbs and S. T. Oyama, J. Am. Chem. Soc., 1998, 120, 9041–9046 CrossRef CAS .
- J. Ma, C. Wang and H. He, Appl. Catal., B, 2017, 201, 503–510 CrossRef CAS .
- S. Gong, W. Li, Z. Xie, X. Ma, H. Liu, N. Han and Y. Chen, New J. Chem., 2017, 41, 4828–4834 RSC .
- D. Mehandjiev and A. Naidenov, Ozone: Sci. Eng., 1992, 14, 277–282 CrossRef .
- L. Yan, J. Bing and H. Wu, Sci. Rep., 2019, 9, 1–10 CrossRef .
- M. Stoyanova, P. Konova, P. Nikolov, A. Naydenov, S. Christoskova and D. Mehandjiev, Chem. Eng. J., 2006, 122, 41–46 CrossRef CAS .
- S. Gong, X. Wu, J. Zhang, N. Han and Y. Chen, CrystEngComm, 2018, 20, 3096–3104 RSC .
- C. H. Kuo and M. H. Huang, J. Am. Chem. Soc., 2008, 130, 12815–12820 CrossRef CAS .
- X. Liang, L. Gao, S. Yang and J. Sun, Adv. Mater., 2009, 21, 2068–2071 CrossRef CAS .
- L. Wan, Q. Zhou, X. Wang, T. E. Wood, L. Wang, P. N. Duchesne, J. Guo, X. Yan, M. Xia, Y. F. Li, A. A. Jelle, U. Ulmer, J. Jia, T. Li, W. Sun and G. A. Ozin, Nat. Catal., 2019, 2, 889–898 CrossRef CAS .
- W. Lu, Y. Sun, H. Dai, P. Ni, S. Jiang, Y. Wang, Z. Li and Z. Li, Sens. Actuators, B, 2016, 231, 860–866 CrossRef CAS .
- B. Long, H. Yang, M. Li, M. S. Balogun, W. Mai, G. Ouyang, Y. Tong, P. Tsiakaras and S. Song, Appl. Catal., B, 2019, 243, 365–372 CrossRef CAS .
- A. J. Zarur and J. V. Ying, Nature, 2000, 403, 65–67 CrossRef CAS .
- E. O. Charles, J. Chem. Educ., 1991, 68, 248–249 CrossRef .
- J. A. Dean, Lange's handbook of chemistry, 15th edn, 2005 Search PubMed .
- Y. Shang, D. Zhang and L. Guo, J. Mater. Chem., 2012, 22, 856–861 RSC .
- Y. Shang, Y. M. Shao, D. F. Zhang and L. Guo, Angew. Chem., 2014, 126, 11698–11702 CrossRef .
- Y. Shang, Y. M. Shao, D. F. Zhang and L. Guo, Angew. Chem., Int. Ed., 2014, 53, 11514–11518 CrossRef CAS .
- C. C. Hou, Q. Q. Chen, C. J. Wang, F. Liang, Z. Lin, W. F. Fu and Y. Chen, ACS Appl. Mater. Interfaces, 2016, 8, 23037–23048 CrossRef CAS .
- H. Solache-Carranco, G. Juárez-Díaz, A. Esparza-García, M. Briseño-García, M. Galván-Arellano, J. Martínez-Juárez, G. Romero-Paredes and R. Peña-Sierra, J. Lumin., 2009, 129, 1483–1487 CrossRef CAS .
- Y. Deng, A. D. Handoko, Y. Du, S. Xi and B. S. Yeo, ACS Catal., 2016, 6, 2473–2481 CrossRef CAS .
- N. G. Elfadill, M. R. Hashim, K. M. Chahrour, M. A. Qaeed and M. Bououdina, Superlattices Microstruct., 2015, 85, 908–917 CrossRef CAS .
- P. Y. Yu, Y. R. Shen and Y. Petroff, Solid State Commun., 1973, 12, 973–975 CrossRef CAS .
- A. Compaan, Solid State Commun., 1975, 16, 293–296 CrossRef CAS .
- J. Jia and P. Zhang, Ozone: Sci. Eng., 2018, 40, 21–28 CrossRef CAS .
- C.-J. Ren, L.-N. Zhou, H.-Y. Shang and Y.-Q. Chen, Acta Phys.-Chim. Sin., 2014, 30, 957–964 CAS .
- Q. Yu, H. Pan, M. Zhao, Z. Liu, J. Wang, Y. Chen and M. Gong, J. Hazard. Mater., 2009, 172, 631–634 CrossRef CAS .
- Q. Yu, M. Zhao, Z. Liu, X. Zhang, L. Zheng, Y. Chen and M. Gong, Chin. J. Catal., 2009, 30, 1–3 CrossRef CAS .
- O. Akhavan, R. Azimirad, S. Safa and E. Hasani, J. Mater. Chem., 2011, 21, 9634–9640 RSC .
- X. Xiang, X. Li, Z. Huang, T. Gao, H. Yuan and D. Xiao, ChemElectroChem, 2019, 6, 1078–1087 CrossRef CAS .
- M. Grioni, J. B. Goedkoop, R. Schoorl, F. M. F. de Groot, J. C. Fuggle, F. Schäfers, E. E. Koch, G. Rossi, J.-M. Esteva and R. C. Karnatak, Phys. Rev. B, 1989, 39, 1541–1545 CrossRef CAS .
- A. R. Williams and N. D. Lang, Phys. Rev. Lett., 1978, 40, 954–957 CrossRef CAS .
- J. Y. Park, Y. S. Jung, J. Cho and W. K. Choi, Appl. Surf. Sci., 2006, 252, 5877–5891 CrossRef CAS .
- C. D. Wagner, W. M. Riggs, L. E. Davis, J. F. Moulder and G. E. Muilenberg, Handbook of X-ray Photoelectron Spectroscopy, 1979 Search PubMed .
- J. Ghijsen, L. H. Tjeng, J. Van Elp, H. Eskes, J. Westerink, G. A. Sawatzky and M. T. Czyzyk, Phys. Rev. B, 1988, 38, 11322–11330 CrossRef CAS .
- M. C. Biesinger, Surf. Interface Anal., 2017, 49, 1325–1334 CrossRef CAS .
- R. J. Iwanowski and D. Trivih, Sol. Cells, 1985, 13, 253–264 CrossRef CAS .
- L. Liao, Q. Zhang, Z. Su, Z. Zhao, Y. Wang, Y. Li, X. Lu, D. Wei, G. Feng, Q. Yu, X. Cai, J. Zhao, Z. Ren, H. Fang, F. Robles-Hernandez, S. Baldelli and J. Bao, Nat. Nanotechnol., 2014, 9, 69–73 CrossRef CAS .
- T. A. Shifa, F. Wang, Z. Cheng, P. He, Y. Liu, C. Jiang, Z. Wang and J. He, Adv. Funct. Mater., 2018, 28, 1–8 CrossRef .
- S. C. Wu, C. S. Tan and M. H. Huang, Adv. Funct. Mater., 2017, 27, 1–8 Search PubMed .
- F. Biccari, Defects and doping in Cu2O, Lulu.com, 2012 Search PubMed .
- H. Raebiger, S. Lany and A. Zunger, Phys. Rev. B, 2007, 76, 1–5 CrossRef .
- P. He, X. Shen and H. Gao, J. Colloid Interface Sci., 2005, 284, 510–515 CrossRef CAS .
- G. D. M. R. Dabera, M. Walker, A. M. Sanchez, H. J. Pereira, R. Beanland and R. A. Hatton, Nat. Commun., 2017, 8, 1894 CrossRef .
- B. De Boer, A. Hadipour, M. M. Mandoc, T. Van Woudenbergh and P. W. M. Blom, Adv. Mater., 2005, 17, 621–625 CrossRef CAS .
Footnote |
| † Electronic supplementary information (ESI) available: Fig. S1–S3. See DOI: 10.1039/d0ra05157h |
|
| This journal is © The Royal Society of Chemistry 2020 |
Click here to see how this site uses Cookies. View our privacy policy here. 
 Open Access Article
 This Open Access Article is licensed under a Creative Commons Attribution-Non Commercial 3.0 Unported Licence
 *ac and
Yunfa Chen
*ac and
Yunfa Chen