 Open Access Article
Cerium–zirconium mixed oxide nanostructures for diesel soot oxidation: synthesis and effect of structure
Pablo Teles Aragão Campos,
João Pedro Vieira Lima,
Daniele Renata de Queiroz Silva,
Claudinei Fabiano Oliveira,
Sílvia Cláudia Loureiro Dias and
José Alves Dias
 *
*
Universidade de Brasília, Campus Universitário Darcy Ribeiro, Instituto de Química, Laboratório de Catálise, Asa Norte, Brasília-DF, 70910-900, Brazil. E-mail: jdias@unb.br; josediasunb@gmail.com; Web: http://www.labcat.unb.br Fax: +55-61-3107-3900; Tel: +55-61-3107-3846
First published on 23rd July 2020
Abstract
Nanostructured materials have been used in several branches of science and technology. Particulate matter is one of the major air pollution concerns. In this work, nanorods and nanoparticles of Ce0.8Zr0.2O2 (CZ) mixed oxides were prepared by different routes, and the use of an organic template was evaluated in diesel soot oxidation. The catalysts were characterized by several techniques including structural analysis (XRD, TEM, N2 adsorption–desorption) and activity (TPR/MS, TPO/MS). A fast TPR/MS method is proposed to calculate hydrogen consumption that can be correlated to the oxygen storage capacity (OSC). It was demonstrated that CZ-nanorods with twice the amount of template in the syntheses (CZ-NRs-2X) were very active for soot oxidation with T50% at 351 °C, and CO2 and H2O were the only oxidation products from Printex®-U (Evonik). This catalyst, reported for the first time, was subjected to up to three cycles and it showed fair activity, proving that this morphology is one of the best mixed oxides of CZ for oxidation.
1. Introduction
The development of nanostructured materials has been pointed out to be useful for future applications in materials science. The main properties of nanomaterials compared to their similar bulk materials are ascribed to their high surface area to volume ratio, modification of lattice parameters, confinement effect, and symmetry.1–3 Nonetheless, the morphology of solid-state materials is an important factor for their unique properties and utilization.4–9Diesel soot particulate matter is a major pollutant of the atmosphere, and many efforts have been developed to improve the quality of engine combustion and minimize the amount of exhaust gases in the air.10–13 A combination of diesel particulate filters (DPFs) and catalysts to retain and react with carbonaceous deposits exiting the exhaust system should be developed to increase their efficiency and lifetime.14–16 Because of the relatively high diameter of the particulates (10 to 100 nm), penetration into microporous catalysts is not favorable, and additional aspects of reactivity must be sought for improved performance.14–18 One important class of nanomaterials for diesel soot oxidation comprises ceria-based catalysts, because they show high activity in soot combustion. There have been many publications in the literature on the different characteristics of these materials that are related to their activity in a variety of oxidation processes such as CO and soot oxidation.7 In addition, there are many studies related to the synthesis and characterization of ceria nanomaterials with different morphologies (e.g., rod, tube, wire), because these structures have the facets (100), (110) and (111) that are considered to be most active for oxidation reactions.19–26
One of the main properties to be analyzed on cerium oxide-based materials is the oxygen storage capacity (OSC), that is, how much the material is capable of donating oxygen to the external environment and thus oxidizing the substrate and performing the facile redox cycle of the cerium atom (Ce3+/Ce4+). OSC is also related to the large number of oxygen vacancies in the framework, which can be usually measured based on surface reduction under H2 or CO gases followed by oxidation with dioxygen.21–23 This property is a balance between theoretical descriptors, such the vacancy formation energy surface (E□) and the surface reduction energy (Ered), which describes the ability of a cation to accept an electron.20 Thus, OSC influences the catalytic capacity in reactions involving oxidation. Increased OSC has been associated with the exposure of the more reducible {100} and {110} planes in nanoshaped ceria, and it follows the order of nanocubes > nanorods ≫ nanopolyhedra.22 On the other hand, the addition of another metal in the framework decreases E□ and facilitates the diffusive mechanism and consequently increases OSC.20 High values of OSC are closely related to easier oxidation of CO or diesel soot. However, the comparison between different OSC values is difficult due to the variety of experimental procedures for its calculation.22
To improve the exposition of those planes, synthetic procedures can be used that lead to a greater OSC and consequently to a better redox cycle.8 The generation of nanostructures that have active preferential planes5,9,10 and the insertion of another transition metal to generate a mixed oxide is one of the most common strategies that has been used.27–38 For instance, cobalt, copper, zirconium, manganese, silver, gold, lanthanum, etc. have been reported to help improve the catalytic capacity. However, the insertion of another metal alone is not enough because there is a loss of activity as recycles occur. It is necessary to generate a true mixed oxide nanostructure for such an improvement; this has seldom been reported in the literature. One of the major difficulties is the choice of the right synthetic methodology because of formation of unwanted intermediates during the synthesis (e.g., hydroxides of the transition metals). The fundamental synthesis used to generate ceria nanostructures is the hydrothermal method in a strong basic medium, i.e., there is the formation of a reactive intermediate, Ce(OH)3, and the subsequent formation of CeO2.23 On the other hand, the methodology using an organic template, i.e., leveling agents,32 has gained notoriety for the preferential formation of nanostructures as well as better redox properties. It is worth noting that most of the literature uses the initial formation of ceria for the subsequent insertion of the metal atom, i.e., ceria is used as a support.33 Actually, in most of those cited publications, only ceria materials have been developed, and a few publications have been devoted to ceria mixed oxides in nanostructured forms.
Therefore, in this work, we will compare four synthetic samples of CZ (Ce0.8Zr0.2O2) that form different nanostructures: nanorods and nanoparticles. These structures were characterized, and some parameters (e.g., crystallinity, size particle, and specific surface) were correlated with the activity of these materials in diesel soot oxidation. The use of temperature programmed reduction (TPR) is proposed to be a fast and easy tool to calculate the OSC capacity based on the hydrogen consumption. The choice of Ce0.8Zr0.2O2 stoichiometry is based on previous studies by our group27 and the literature,28 which showed that this sample was the most active for the oxidation of soot in a series of CexZr1−xO2. Moreover, the synthesis of a mixed oxide of Ce0.8Zr0.2O2 nanorods is reported for the first time, to the best of our knowledge.
2. Experimental
2.1 Preparation of Ce0.8Zr0.2O2 nanorods (CZ-NRs)
First, 0.96 g of diammonium hydrogen citrate ((NH4)2C6H6O7, Vetec, Brazil, 98%) was weighed, diluted in 20 mL of deionized water, and kept under stirring until total solubilization (10 min). Then, 0.82 g of CeCl3·7H2O (Aldrich, USA, 99.9%) and 0.17 g of ZrOCl2·8H2O (Sigma-Aldrich, USA, 98%) were diluted in 10 mL of deionized water (Quimis, reverse osmosis system, model Q842-210, Brazil) and stirred until complete solubilization (10 min). In the citrate solution, 1.20 g of urea ((NH2)2CO, Vetec, Brazil, 99%) was added under stirring until total solubilization. Finally, the solution with the Ce and Zr precursors was added to the citrate solution. This final solution was stirred for 30 min before transferring it to a Teflon autoclave (75 mL). The solution in the autoclave was placed in a vacuum oven with a microprocessor (Quimis, model Q819V2, Brazil) to control the temperature at 120 °C for 24 h without stirring. The same synthesis was repeated using the same proportion of reagents but with twice the amount of (NH4)2C6H6O7, (CZ-NRs-2x). The mixed oxides were ground and further calcined at 500 °C for 4 h prior to all characterizations.2.2 Preparation of Ce0.8Zr0.2O2 nanoparticles (CZ-NPs)
A total of 0.86 g of CeCl3·7H2O and 0.18 grams ZrOCl2·8H2O were weighed and dissolved in 30 mL of ethanol (Vetec, Brazil, 99.5%) under vigorous stirring. Then, 1.0 g of oxalic acid was added and fully dissolved, and the solution transferred to an autoclave (75 mL), which was placed in the vacuum oven at 160 °C for 24 h without stirring. The same synthesis was repeated using the same proportion of reagents but with twice the amount of oxalic acid, (CZ-NPs-2x). The mixed oxides were ground and then calcined at 500 °C for 4 h prior to all characterization methods.2.3 Nanocatalyst characterization
The composition of the samples was calculated by energy dispersive X-ray fluorescence (EDXRF) in a Shimadzu EDX 720 spectrometer (Japan) using a rhodium X-ray tube. The spectra were collected under vacuum (<45 Pa) using 2-channels where the X-ray source was set at 50 and 15 kV for Ti–U and Na–Sc ranges, respectively. The powder samples were placed inside the sample holder using a polypropylene film, and the Ce and Zr contents were obtained by the Quali-Quant method of fundamental standards.Powder X-ray diffraction (XRD) were obtained in a Bruker D8 FOCUS diffractometer (Germany) between 5° < 2θ < 70° (0.02° per step and integration time of 10 s per step) with Cu-Kα radiation of 1.5418 Å (40 kV and 30 mA) and a graphite monochromator.
Transmission electron microscopy (TEM) images were acquired by a JEOL JEM 2100 transmission electron microscope (Japan) operating at 200 kV. The powder was dispersed in ethyl alcohol using an ultrasonic bath. Then it was placed on a TEM copper grid of 400 mesh, covered with carbon, and dried at room temperature.
Textural properties (e.g., specific surface area, volume of pores, porosity) of the samples were measured based on adsorption and desorption isotherms of nitrogen obtained at −196 °C in a Micromeritics model ASAP 2020C instrument (USA). Degasification was performed under vacuum at 200 °C for 4 h before the adsorption measurements. The BET (Brunauer–Emmett–Teller) specific surface area was calculated from the adsorption branches in the relative pressure range of 0.06–0.20, and the average pore size and pore volume were calculated from the desorption branches using the Barrett–Joyner–Halenda (BJH) method.
2.4 Preparation of a mixture of nanocatalyst with diesel soot
Prior to the measurements of the catalytic activities of the mixed oxides, each one was mixed with a standard soot produced in a fuel burner (Printex®-U by Evonik). This model soot was analyzed, and it showed a composition in agreement with the literature.27 The Printex®-U was mixed with the mixed oxide at a mass ratio of 1![[thin space (1/6-em)]](https://www.rsc.org/images/entities/char_2009.gif) :
:![[thin space (1/6-em)]](https://www.rsc.org/images/entities/char_2009.gif) 20.27 A tight contact was used, considering that the type of contact between the catalyst and the soot is very important in the reaction. The mixing process was carried out in an agate mortar and pestle for 5 min to promote firm contact between the components. Then, the catalyst-soot was placed into a dark glass flask to be further used in the reactor. This procedure was used in triplicate measurements for studies of the oxidation, and it showed excellent reproducibility.
20.27 A tight contact was used, considering that the type of contact between the catalyst and the soot is very important in the reaction. The mixing process was carried out in an agate mortar and pestle for 5 min to promote firm contact between the components. Then, the catalyst-soot was placed into a dark glass flask to be further used in the reactor. This procedure was used in triplicate measurements for studies of the oxidation, and it showed excellent reproducibility.
2.5 Catalytic oxidation of diesel soot
The oxidation of diesel soot was evaluated by temperature programed oxidation coupled with a mass spectrometer (TPO/MS), which was performed on a reaction system from Altamira Instruments (model AMI-90R, USA). This equipment had a TCD detector and it was also coupled to a Dycor Ametek mass spectrometer (range 0–100 m/z) with continuous and simultaneous detection in up to eight channels. The catalyst-soot (100 mg) was placed in a U quartz reactor tube that was inserted into the furnace of the equipment. The TPO experiment was programmed using three steps. First, the catalyst was dried at 150 °C (25 to 150 °C, heating ramp of 5 °C min−1) for a total of 40 min under argon (Ar) flow at 20 cm3 min−1. Then, a heating ramp of 10 °C min−1 up to 750 °C was applied while switching the gas to 10% O2 on Ar under a flow of 10 cm3 min−1. The third step was a calibration of the O2 consumption using different pulses of 10% O2 on Ar at a flow of 20 cm3 min−1. The reaction products were monitored via their respective mass fragments (m/z), according to NIST Webbook.39 Mass-spec: 18 (base peak of water); 28 and 29 (base and additional peak of CO); 32 (base peak of oxygen); 44 and 45 (base and additional peak of CO2). Individual fragmentation for CO or CO2 were followed in separate experiments in order to check the correct assignment of products.2.6 Catalytic reduction of nanocatalysts
The characterization of the reducibility of the catalysts was measured by temperature programed reduction coupled with a mass spectrometer (TPR/MS) using the same apparatus employed for TPO/MS experiments. The TPR experiment was programmed using three steps. First, the catalyst was dried at 150 °C (25 to 150 °C, heating ramp of 5 °C min−1) for a total of 40 min under argon (Ar) flow at 20 cm3 min−1. Then, a heating ramp of 10 °C min−1 up to 900 °C was applied while switching the gas to 10% H2 on Ar under a flow of 10 cm3 min−1. The third step was a calibration of the H2 consumption, using different pulses of 10% H2 on Ar at a flow of 10 cm3 min−1. The reaction products were monitored via their respective mass fragments (m/z) according to NIST Webbook.39 Mass-spec: 2 (base peak of hydrogen); 18 (base peak of water); 40 (base peak of argon).3. Results and discussion
3.1 Considerations about the synthetic procedures
Hydrothermal and solvothermal methods were used for the synthesis of the mixed cerium oxides. This allowed the use of high temperatures even in the liquid state without boiling water or ethanol. In particular, the hydrothermal method was used to form nanorods, and the solvothermal method was used to prepare the nanoparticles. The great advantage of using these methods when compared to the coprecipitation method is the formation of nanostructures as well as a significant increase in crystallinity. Moreover, a weak base, such as urea, was used instead of a strong base (e.g., NaOH). However, an organic template35 is required for the formation of nanostructures. In particular, citric acid and oxalic acid were used for nanorods and nanoparticles,40 respectively. These organic acids participate in the formation of nanostructures by promoting favorable crystalline planes that improve the catalytic capacity.35,40 Another important factor is the nature of the ions in solution (i.e., the source of the metal ions).41 In both cases, precursors coming from chlorides were used, not phosphates or nitrates, because these ions favor the formation of undesired nano-octahedra or nanocubes.23,41 An important step in the synthesis is calcination, and increasing the temperature may cause the loss of crystalline planes that are active but unstable. In addition, sintering is a concern regarding the loss of activity by the decrease of specific area. Thus, 500 °C was used to ensure that the chloride ions and the organic template degraded without appreciable loss of important crystal facets.19,42,433.2 Structural and morphological characterization
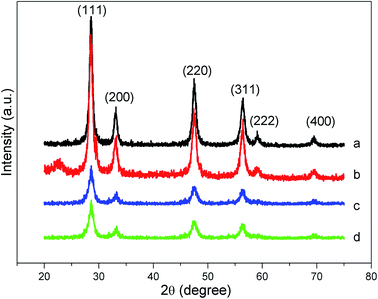
Elemental analysis of Ce and Zr by EDXRF in all prepared materials demonstrated the actual formula (Ce0.78Zr0.22O2), which was very close to the nominal representation (Ce0.8Zr0.2O2). The nominal formula will be denoted in this work.The crystalline structure of ceria is the same as that of fluorite (CaF2), i.e., face-centered cubic with the space group Fm3m, where the oxygen atoms occupy the tetrahedral interstices. The structure of the mixed oxide is the same as that for ceria, differing only from the substitution of the cerium atoms by zirconium in the chosen proportion. The crystalline structure of the materials can be obtained by XRD (Fig. 1).
In the XRD powder analysis, all diffraction peaks can be attributed to a fluorite cubic unit similar to the ceria crystal structure. No other crystalline phase was detected, and no phase segregation (e.g., tetragonal zirconia) was observed.27 The characteristic diffraction peaks at 2θ values of 28.6, 33.1, 47.5, 56.3, 59.1, and 69.4° were well identified and indexed as the (111), (200), (220), (311), (222), and (400) planes. Using the Scherrer equation, we calculated the particle size (DXRD) from the FWHM (full width at half maximum) of the main peak (111). The crystallinity of solids is also a concern after synthesis. Thus, a calculation of the crystalline content was performed using the ratio of the area of crystalline peaks to the total area of the diffractogram. It should be mentioned that this calculation is only relative since no standard pattern was attributed to 100% crystallinity. These parameters are shown in Table 1. In general, no regular trend was observed among the DXRD and crystallinity results related to the synthetic procedure, except that increasing the template concentration decreased the particle size and increased the crystallinity with respect to each synthetic procedure. Nonetheless, there was a similarity in these parameters, ranging from 1.9 to 1.2 nm and 38 to 52% in size and crystallinity, respectively (the errors are within 0.5 nm and 5% in those measurements). The very low DXRD values are an important indicator of the reactivity of these solids. It has been established in the literature1 that the smaller the particle size is, the higher the Ce3+ concentration is. Cerium(III) is present in all ceria-based materials, and its content is reflected in the (OSC) and ultimately in the oxidation capacity of the soot.1,19,21
| Catalyst | DXRD (nm) | Crystallinity (%) | SBET (m2 g−1) | VP (cm3 g−1) |
|---|---|---|---|---|
| CZ-NRs | 1.9 | 38 | 36 | 0.06 |
| CZ-NRs-2x | 1.7 | 47 | 70 | 0.17 |
| CZ-NPs | 1.2 | 52 | 21 | 0.09 |
| CZ-NP-2x | 1.3 | 48 | 69 | 0.18 |
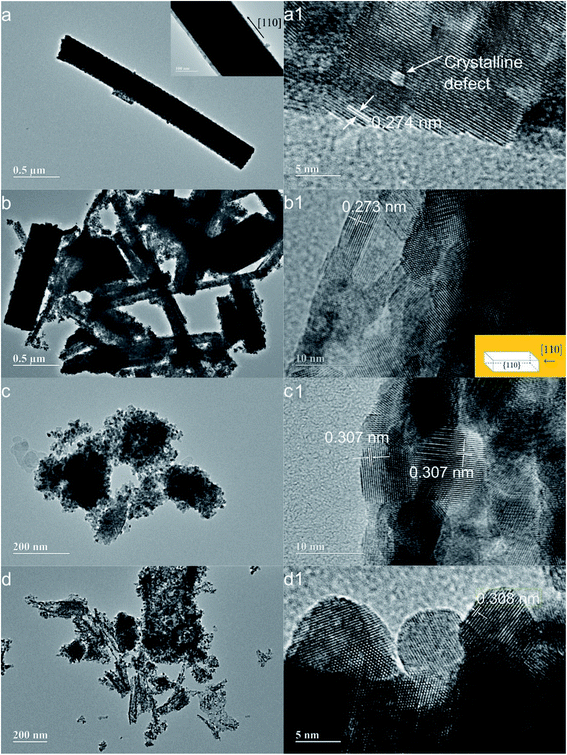
A detailed morphological and structural analysis of the samples was developed using transmission electron microscopy (TEM) with the typical results shown in Fig. 2. A more complicated situation exists with rod-shaped morphologies due to the higher reactivity of the Ce(OH)3 precursor and the strong influence of reaction conditions on the final morphology.21 The synthetic methodology using organic templates modifies the structure of the reaction intermediates. For example, when dibasic ammonium citrate was used, nanorods were obtained (Fig. 2a and b), but when oxalic acid was used, almost spherical nanoparticles were formed (Fig. 2c and d). A careful analysis of TEM pictures reveals that the interplanar spacings of 0.308 and 0.271 nm are assigned to facets (111) and (110), respectively.40 All of the synthesized nanostructures in this article have shown these facets. The formation of nanorods is extremely relevant due to the activity of the exposed planes. The organic template makes the nanorods grow in the direction [110], so that this nanostructure is geometrically surrounded by facets {110}, {100} and {111}.21,40,44–46 In this work, the leveling agent promotes nanorods growth in direction [110], and it is surrounded by the main planes according to the model proposed in the literature.41 Furthermore, crystalline defects can be identified from white dots in the TEM images. Such defects may be due to the absence of an atom or deformation of crystalline planes,42 which can be observed on the surface of the catalysts. The presence of dark pits1 is also an important factor to be analyzed because these represent a roughness factor and therefore define how Printex®-U comes into contact with the surface of the catalyst.
Additional information about the nanostructures could be found by textural analysis, which was obtained by the analyses of nitrogen adsorption–desorption isotherms (Fig. 3). The aspect of these curves resembles isotherms of type II and type III, according to IUPAC classification.47 The major characteristics of these isotherms are the presence of large pores. Type H3-hysteresis can be tentatively assigned, which is related to slit-shaped pores formed by nonrigid plate aggregates. In addition, a curve distribution of the incremental pore sizes confirmed the presence of pores within 2 and 50 nm (mesoporous) and above 50 nm (macroporous) with no regular shape or narrow size distribution. The BET areas and the average pore volumes (Table 1) increased with the same trend as increasing the template concentration in the syntheses. These facts agree with the described effect of the organic templates on favoring the respective growth of nanostructures, increasing the specific surfaces and pore volumes.
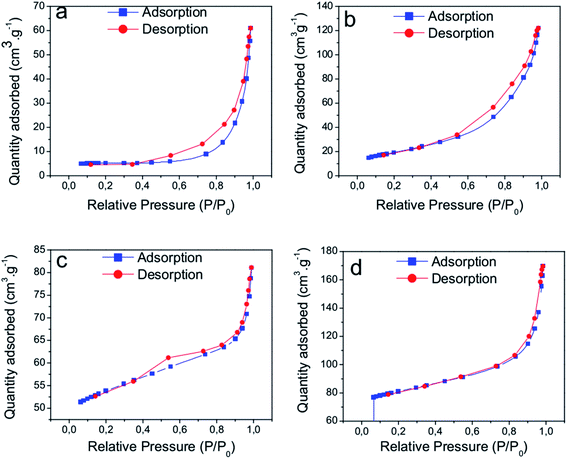 | ||
| Fig. 3 N2 adsorption–desorption isotherms at −196 °C of the nanocatalysts: (a) CZ-NRs, (b) CZNRs-2x, (c) CZ-NPs, and (d) CZ-NPs-2x. | ||
3.3 Temperature-programmed reduction coupled to mass spectrometry (TPR/MS)
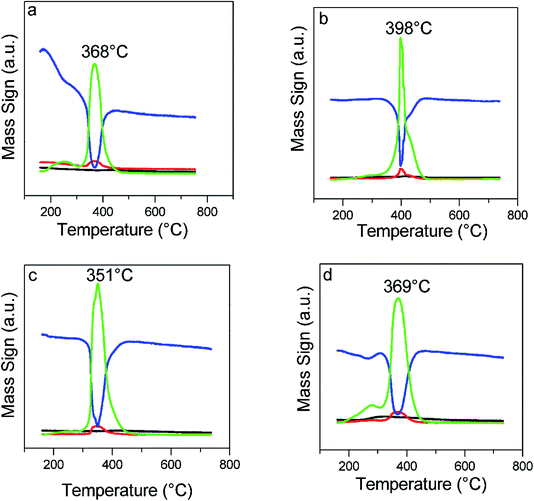
The potential application of the catalysts probed by hydrogen (m/z = 2) using TPR/MS is shown by the curves in Fig. 4 and the corresponding formation of water (m/z = 18, Fig. 5). The first peak (Fig. 4) was characteristic of the surface oxygen reaction with hydrogen, whereas the second peak (or a shoulder) was attributed to the bulk oxygen reaction. It could be noted that the CZ-NRs had H2 consumption under a lower temperature range than the similar CZ-NPs. In addition, in the materials containing twice the concentration of leveling agents, there was a decrease in the hydrogen consumption and temperature range (Table 2).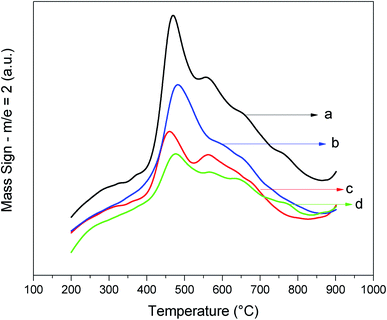 | ||
| Fig. 4 TPR/MS (m/z = 2, H2) curves of the nanocatalysts: (a) CZ-NRs, (b) CZ-NPs, (c) CZ-NRs-2x, and (d) CZ-NPs-2x. | ||
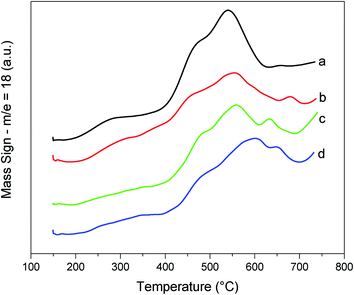 | ||
| Fig. 5 TPR/MS (m/z = 18, H2O) curves of the nanocatalysts: (a) CZ-NRs, (b) CZ-NRs-2x, (c) CZ-NPs-2x, and (d) CZ-NPs. | ||
| Catalyst | n(H2) (mmol g−1) | OSC (μmol g−1) | n(O2) (mmol g−1) |
|---|---|---|---|
| CZ-NRs | 0.77 | 513 | 14.7 |
| CZ-NRs-2x | 0.34 | 710 | 9.5 |
| CZ-NPs | 0.60 | 234 | 11.3 |
| CZ-NPs-2x | 0.22 | 381 | 10.9 |
The hydrogen consumption was analyzed from the signal of the mass spectra. This initially requires a calibration factor (f) that is the ratio between the signal area of the gas molecule of interest (e.g., H2) and the area of the carrier gas, in particular Ar. These data are obtained by performing a pulse to obtain a signal of the gas without the presence of the catalyst to emulate the real situation (Fig. 6). Actually, a series of pulses are obtained and taken as an average for each gas. Thus, it is possible to quantify the number of moles of hydrogen (nH2) from eqn (1), where A (H2) and A (Ar) are the observed areas of hydrogen and argon signals and Vinj is the injected hydrogen gas volume in the experiment.
 | (1) |
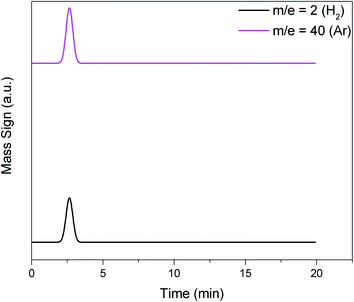 | ||
| Fig. 6 Examples of standard H2 (m/z = 2) and Ar (carrier gas, m/z = 40) that generate mass signal peaks for calculating the calibration factor (f) of eqn (1). | ||
The hydrogen consumption and OSC indicates the types of the respective nanostructures and the mobility of oxygen in them; so, the ability to generate crystalline defects is strongly associated with the catalytic activity.20–22 It is well known that the mobility of oxygen depends on the morphology of the crystal and follows this order for the nanostructures: rods ≥ cubes > octahedra > particles.22 This is related to the planes exposed by each nanostructure, since the migration associated with oxygen from the bulk to the surface is much easier on facets of the type {100} and {110}.20,21 Thus, the temperature that hydrogen consumption occurs, i.e., the range in which the reaction with surface oxygen takes place, is an indication of the amount of reactive facet distributions.48 The lower temperature peak demonstrates the relative distribution of facets for the easiest oxygen migration on the {110} and {100} surfaces.21,22,42,49,50 In addition, the lower consumption of hydrogen in the materials containing twice the concentration of leveling agents suggests greater distribution of facets (100) and (110); indeed, these contain fewer reducible surface oxygen species (rods < cubes < particles).20,51 Therefore, H2-TPR/MS data of the nanocatalysts containing twice the leveling agents suggest a greater distribution of active facets.
Then, based on the literature52 and our experimental results, we could describe the possible mechanism of reduction at the surface of the ceria-zirconia nanomaterials. At low temperatures, molecular hydrogen physisorption occurs on the surface of the CZ at the lowest free energy adsorption sites (□).
| H2 + □ → H2 − □ | (2) |
As the temperature increases, bond cleavage of the adsorbed hydrogen molecule occurs, forming a hydroxyl group with an oxygen atom on the CZ surface, which is experimentally followed by the consumption of hydrogen (m/z = 2, Fig. 4).
| H2 − □ + O → HO + H□ | (3) |
Thus, the formed hydroxyl group reacts with the adsorbed hydrogen atom to generate water, which is detected by MS (m/z = 18, Fig. 5).
| HO + H□ → H2O + □ | (4) |
Using the range of bulk oxygen reaction (550 to 750 °C), we can perform the OSC calculation based on the stoichiometry of the reaction from the hydrogen consumed (calculated by eqn (1)). The catalysts synthesized in this work containing twice the organic template have a higher OSC when compared to conventional catalysts, showing the greater relative distribution of the {110} and {100} planes that are more active to reduction.20,21,23 We know that to maximize vacancy formation, we should make nanostructures with more exposed active planes, in particular {110} and {100},21,23 or to produce a distortion of local symmetry by insertion of smaller atoms in the framework (e.g., Zr4+) and thus facilitate crystalline defect formation.20 The results obtained from the proposed technique are similar to Aneggi et al.,22 Mai et al.,23 Zhang et al.,40 and Wang et al.,53 who reported an increase in OSC when they measured it in ceria nanoshaped materials. Thus, the syntheses containing twice as much organic template promote two important characteristics: (i) the increase in vacancy formation; (ii) the higher relative distribution of active planes, which can be inferred by measuring and calculating hydrogen consumption and OSC, respectively. Both parameters are directly related to catalytic activity.
3.4 Temperature-programmed oxidation coupled to mass spectrometry (TPO/MS)
Soot particles consist of a carbon core with some inorganic material, adsorbed hydrocarbons, and water.54–56 Fig. 7 shows TEM images of the interaction between the nanocatalysts with soot (Printex®-U) after they have been mixed by tight contact. The nanometer particles have an amorphous core surrounded by graphite shell, and these unique particles agglomerate into larger entities with sizes typically in the range of 0.1 to 10 nm.54 On the surface of diesel soot, there are polycyclic aromatic hydrocarbons, volatile organic compounds, etc. So, there is a difference in the combustion temperature of these components.54–56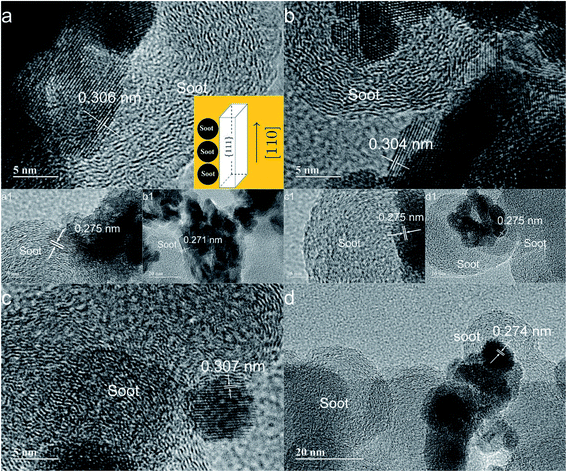 | ||
| Fig. 7 TEM images of CZ-nanocatalysts interacting with soot (Printex-U): (a) CZ-NRs, (b) CZ-NRs-2x, (c) CZ-NPs, and (d) CZ-NPs-2x. | ||
A study of pure Printex®-U (Fig. 8) showed two events correlated to the oxidation of the more volatile organic compounds that are adsorbed on its surface (lower temperature peak) and the oxidation of black carbon (second peak at higher temperature). Accordingly, higher amounts of CO are also produced in the thermal oxidation process of pure soot. The same reaction catalytically performed and followed by TPO/MS presents the curve profiles displayed in Fig. 9. The soot oxidation was analyzed considering the main products through their respective masses, i.e., CO2 and H2O. From the integrated CO2 curves (Fig. 10), we obtained the values of T10%, T50%, and T90%, which are 10, 50, and 90% oxidation of soot, respectively (Table 3). The fragmentation for CO or CO2 were analyzed individually in separate experiments by using the relative intensities of the standard fragmentation of CO2 obtained in the NIST Webbook,39 which indicated that only CO2 was produced in the catalytic oxidation.
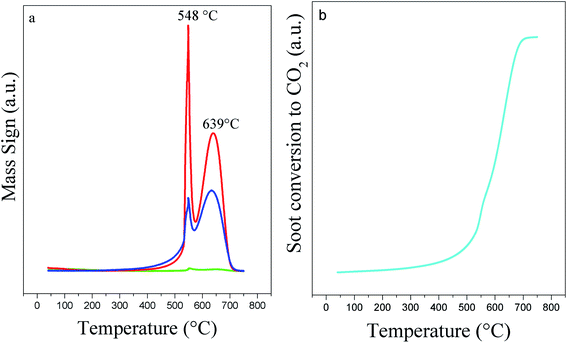 | ||
| Fig. 8 TPO/MS curves of Printex®-U oxidation: (a) (m/z = 28, CO, blue line); (m/z = 18, H2O, green line) and (m/z = 44, CO2, red line); (b) soot conversion to CO2. | ||
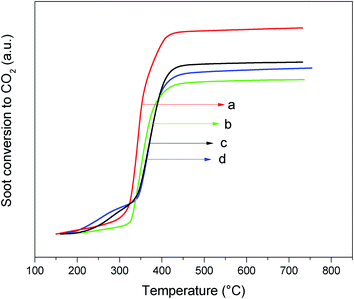 | ||
| Fig. 10 Conversion of soot to CO2 over the nanocatalysts: (a) CZ-NRs-2x, (b) CZ-NPs-2x, (c) CZ-NRs, and (d) CZ-NPs. | ||
| Catalyst | T10% | T50% | T90% |
|---|---|---|---|
| Printex | 508 | 608 | 667 |
| CZ-NPs | 351 | 402 | 441 |
| CZ-NPs-2x | 281 | 368 | 404 |
| CZ-NRs | 257 | 368 | 408 |
| CZ-NRs-2x | 328 | 351 | 398 |
| CZ-NRs-2x-first reuse | 350 | 402 | 428 |
| CZ-NRs-2x-second reuse | 334 | 412 | 459 |
It can be seen that CZ-NRs-2x had the best performance for oxidation of the particulate material. Actually, cerium oxide doped with zirconium promotes the formation of Ce3+ ions in the framework, decreasing the cell parameter. The cubic cell parameter does not show appreciable expansion, because the Zr4+ cations (84 pm) are smaller than Ce4+ (97 pm) and the formation of Ce3+ (107 pm) compensates the tension associated with the increase in ionic radius due to the difference in the sizes of Ce4+ and Ce3+.14,20,27 The Ce4+/Ce3+ redox pair is important in the oxygen mobility that facilitates the mechanism of soot oxidation. Thus, CZ-NRs-2x has a larger surface area and a higher OSC, i.e., two factors that increase the ability to carry out oxidation. This indicates that the synthesis containing twice the leveling agent has a greater distribution of active plans, corroborating the H2-TPR/MS data.
Another important parameter of the soot oxidation reaction is the O2 consumption. The O2 consumed in the oxidation process was obtained from the curves of TPO/MS for each reaction (Fig. 9, blue line). The method to quantify the number of moles of oxygen (Fig. 11) that each catalyst consumes is presented in eqn (5). The terms have the same significance as that for hydrogen consumption (eqn (1)), but in this case, the gas is oxygen.
 | (5) |
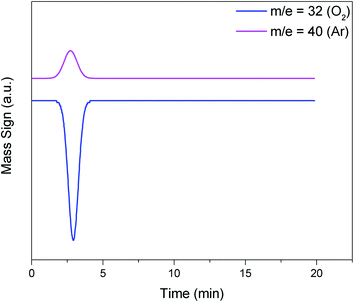 | ||
| Fig. 11 Examples of standard O2 (m/z = 32) and Ar (carrier gas, m/z = 40) that generate mass signal peaks for calculating the calibration factor (f) of eqn (5). | ||
Each nanostructured catalyst consumes oxygen differently because of the presence of more active planes (i.e., more active surface oxygen) dominates the reactivity. The nanocatalysts with twice the leveling agent have more active planes to perform the oxidation of the diesel soot, which is reflected in the lower amount of external oxygen needed to carry out the oxidation (Table 2). In the case of oxidation of soot particles where steric/geometric constrains prevent easy access of gas-phase oxygen, the regeneration of surface oxygen is operated by sub-surface or bulk diffusion of lattice oxygen. It is therefore expected that the nature, dimension, and location of the soot/catalyst interface will strongly affect this mechanism by changing the overall degree of participation of bulk oxygen in soot oxidation.56,57
This technique demonstrates the mechanism known as Mars–van Krevelen oxidation, where the oxygen from the external environment fills the oxygen vacancy of the framework after the oxidation of CO or soot.21,54,55 Because soot particles make this filling more difficult, the participation of oxygen from the subsurface is necessary. The nanostructure and the presence of zirconium facilitate this mobility. Thus, CZ-NRs-2x lower consumption of O2 is explained by the difficult access caused by the better intimate contact (higher specific surface area) in the particulate oxidation reaction and lower subsurface energy compared to the other nanostructures; this agrees with computational data in the literature.20
In addition, the aging of the most active catalyst was studied by making complete reuses in tight contact between the catalyst and Printex®-U (Fig. 12). The conversion profile significantly changed T50%. This phenomenon can be described by analysis of the crystalline planes exposed by the nanorods. The fresh catalyst (calcined at 500 °C) exposed the main active facets to carry out the oxidation, but the stability of these planes is inverse with temperature.20–23 Each soot oxidation cycle reached a high temperature (750 °C), so that partial destruction of the most active planes occurred, and consequently the performance of each oxidation cycle decreased, showing a higher T50%. This is probably related to sintering of the nanocatalyst, since the same trend has been observed in the literature for other systems.15,27,28 Nonetheless, it is worth noting that even after the third cycle, the CZ-NR-2x has a T50% of approximately 404 °C, which is lower than that of ceria nano-octahedron or ceria nanocubes.20,48 The decreased activity showed a 14% loss in relation to the initial T50% (351 °C), which might be avoided with a lower temperature of regeneration (between 450 and 500 °C), since at the temperature of 398 °C, 90% of soot was already oxidized (T90%, Table 3). Powder XRD after third use and elemental analysis did not show any detectable differences in structure and composition.
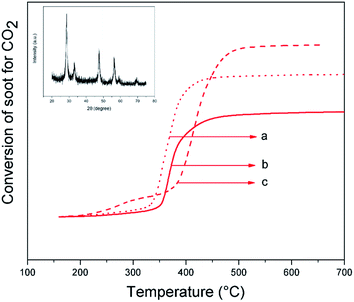 | ||
| Fig. 12 Conversion of soot to CO2 using CZ-NRs-2x nanocatalyst: (a) fresh, (b) first reuse, and (c) second reuse. Inset shows the XRD of CZ-NRs-2x after 3 reuses. | ||
4. Conclusion
Research on developing materials for soot oxidation is important for air pollution control. In this sense, nanostructures of cerium–zirconium Ce0.8Zr0.2O2 (CZ) mixed oxide were synthesized, because this material is one of the most active for that reaction. Particularly, mixed oxides of ceria-zirconia with nanorod morphology were successfully obtained for the first time. A simple one-step synthesis in the presence of leveling agents (organic templates) enabled nanorods (CZ-NRs) and nanoparticles (CZ-NPs) to be obtained. The effect of their concentration on the synthesis demonstrated that twice as much organic template affected the textural, redox and catalytic properties. In this work, we proposed to use a conventional technique in the study of reducing properties (temperature-programmed reduction, TPR) to obtain useful catalytic parameters (hydrogen consumption and OSC). Thus, a fast methodology for obtaining TPR curves using mass spectrometry without the need for long pretreatment of the samples was effective in showing the differences among the nanocatalysts in the initial diesel soot oxidation. The hydrogen consumption correlated well with the synthetic methods, the oxygen storage capacity (OSC), and the oxygen consumption in the series of nanocatalysts. The lower consumption of hydrogen in the materials containing twice the concentration of leveling agents suggested greater distribution of facets (100) and (110). Indeed, these contain fewer reducible surface oxygen species (rods < cubes < particles) in agreement with the literature. The synthesized nanocatalysts containing twice the organic template have a higher OSC, which shows a greater relative distribution of the {110} and {100} planes that are more active to be reduced. The lower consumption of external oxygen needed to carry out the oxidation with the nanocatalysts with twice leveling agent corroborate the trend in the hydrogen consumption, i.e., they have more active planes to perform soot oxidation. The catalytic test successfully identified the reaction products with Printex®-U (CO2 and H2O) with no CO detected. Moreover, the best catalyst (CZ-NRs-2x) underwent three reuses with a relative activity loss of 14%. This was mostly attributed to the temperature treatment of the CZ nanorod (750 °C from every cycle). Therefore, CZ nanorods might be one of the best nanostructure oxides for the purpose of soot oxidation.Conflicts of interest
There are no conflicts to declare.Acknowledgements
We acknowledge CNPq (grant 307091/2018-0, 307845/2019-2 and 307867/2016-1) and CAPES (grant 001) for research, graduate and undergraduate student scholarships and the financial support provided by DPI/IQ/UnB, MCTIC/CNPq (grant 480165/2013-0 and 484384/2012-0), FAPDF (grant 0193.001799/2017), FINEP/CTPetro/CTInfra, CAPES, and Petrobras. In addition, we would like to thank Dr Tatiane Oliveira dos Santos from Laboratório Multiusuário de Microscopia de Alta Resolução (LabMic) at IF/UFG-Brazil for TEM measurements, and CAIQ/IQ/UnB (http://www.caiq.unb.br) for using XRD and Temperature-Programmed Reactions equipment.References
- S. Deshpande, S. Patil, S. V. Kuchibhatla and S. Seal, Appl. Phys. Lett., 2005, 87, 133113 CrossRef
.
- R. J. Gorte, H. Kim and J. Vohs, J. Power Sources, 2002, 106, 10–15 CrossRef CAS
.
- S. Yabe and T. Sato, J. Solid State Chem., 2003, 171, 7–11 CrossRef CAS
.
- C. Burda, X. Chen, R. Narayanan and M. A. El-Sayed, Chem. Rev., 2005, 105, 1025–1102 CrossRef CAS
.
- Y. Mao and S. S. Wong, J. Am. Chem. Soc., 2006, 128, 8217–8226 CrossRef CAS PubMed
.
- Y. Zheng, K. Liu, H. Qiao, Y. Zhang, Y. Song, M. Yang, Y. Huang, N. Guo, Y. Jia and H. You, CrystEngComm, 2011, 13, 1786–1788 RSC
.
- C. Sun, H. Li and L. Chen, Energy Environ. Sci., 2012, 5, 8475–8505 RSC
.
- W. Huang and Y. Gao, Catal. Sci. Technol., 2014, 4, 3772–3784 RSC
.
- Q. Shen, M. Wu, H. Wang, C. He, Z. Hao, W. Wei and Y. Sun, Catal. Sci. Technol., 2015, 5, 1941–1952 RSC
.
- L. Zhu, J. Yu and X. Wang, J. Hazard. Mater., 2007, 140, 205–210 CrossRef CAS
.
- M. Piumetti, S. Bensaid, N. Russo and D. Fino, Appl. Catal., B, 2016, 180, 271–282 CrossRef CAS
.
- M. S. Gross, M. A. Ulla and C. A. Querini, Appl. Catal., A, 2009, 360, 81–88 CrossRef CAS
.
- S. Braum, L. G. Appel and M. Schmal, Quim. Nova, 2003, 27, 472–482 CrossRef
.
- M. Shelef and R. W. McCabe, Catal. Today, 2000, 62, 35–50 CrossRef CAS
.
- I. Atribak, B. Azambre, A. Bueno-López and A. García-García, Appl. Catal., B, 2009, 92, 126–137 CrossRef CAS
.
- B. van Setten, J. Schouten, M. Makkee and J. Moulijn, Appl. Catal., B, 2000, 28, 253–257 CrossRef CAS
.
- A. I. Kozlov, Do H. Kim, A. Yezerets, P. Andersen, H. H. Kung and M. C. Kung, J. Catal., 2002, 209, 417–426 CrossRef CAS
.
- R. Di Monte and J. Kaspar, Top. Catal., 2004, 28, 47–57 CrossRef CAS
.
- M. Nolan, S. C. Parker and G. W. Watson, Surf. Sci., 2005, 595, 223–232 CrossRef CAS
.
- M. Capdevila-Cortada, G. Vilé, D. Teschner, J. Pérez-Ramírez and N. López, Appl. Catal., B, 2016, 197, 299–312 CrossRef CAS
.
- A. Trovarelli and J. Llorca, ACS Catal., 2017, 7, 4716–4735 CrossRef CAS
.
- E. Aneggi, D. Wiater, C. Leitenburg, J. Llorca and A. Trovarelli, ACS Catal., 2014, 4, 172–181 CrossRef CAS
.
- H.-X. Mai, L.-D. Sun, Y.-W. Zhang, R. Si, W. Feng, H.-P. Zhang, H.-C. Liu and C.-H. Yan, J. Phys. Chem. B, 2005, 109, 24380–24385 CrossRef CAS
.
- M. Zhang, J. Li, H. Li, Y. Li and W. Shen, Catal. Today, 2009, 148, 179–183 CrossRef
.
- M. Piumetti, S. Bensaid, N. Russo and D. Fino, Appl. Catal., B, 2015, 165, 742–751 CrossRef CAS
.
- Z. Wu, M. Li and S. H. Overbury, J. Catal., 2012, 285, 61–73 CrossRef CAS
.
- C. F. Oliveira, F. A. Garcia, D. R. Araújo, J. L. Macedo, S. C. Dias and J. A. Dias, Appl. Catal., A, 2012, 413–414, 292–300 CrossRef CAS
.
- E. Aneggi, C. Leitenburg, G. Dolcetti and A. Trovarelli, Catal. Today, 2006, 114, 40–47 CrossRef CAS
.
- G. Zhang, Z. Zhao, J. Liu, G. Jiang, A. Duan, J. Zheng, S. Chen and R. Zhou, Chem. Commun., 2010, 46, 457–459 RSC
.
- J. C. Medina, S. E. Rodil and R. Zanella, Catal. Sci. Technol., 2020, 10, 853–863 RSC
.
- X. Wu, Q. Liang, D. Weng and Z. Lu, Catal. Commun., 2007, 8, 2110–2114 CrossRef CAS
.
- X. Wu, F. Lin, H. Xu and D. Weng, Appl. Catal., B, 2010, 96, 101–109 CrossRef CAS
.
- P. X. Huang, F. Wu, B. L. Zhu, X. P. Gao, H. Y. Zhu, T. Y. Yan, W. P. Huang, S. H. Wu and D. Y. Song, J. Phys. Chem. B, 2005, 109, 19169–19174 CrossRef CAS
.
- Q. Li and V. Thangadurai, Fuel Cells, 2009, 9, 684–698 CrossRef CAS
.
- J. Zhang, S. Ohara, M. Umetsu, T. Naka, Y. Hatakeyama and T. Adschiri, Adv. Mater., 2007, 19, 203–206 CrossRef CAS
.
- G. Corro, A. Flores, F. Pacheco-Aguirre, U. Pal, F. Bañuelos, A. Ramirez and A. Zehe, Fuel, 2019, 250, 17–26 CrossRef CAS
.
- G. Corro, E. Vidal, S. Cebada, U. Pal, F. Bañuelos, D. Vargas and E. Guilleminot, Appl. Catal., B, 2017, 216, 1–10 CrossRef CAS
.
- G. Corro, J. A. Flores, F. Pacheco-Aguirre, U. Pal, F. Bañuelos, R. Torralba and O. Olivares-Xometi, ACS Omega, 2019, 4, 5795–5804 CrossRef CAS PubMed
.
- https://webbook.nist.gov, accessed in 01/03/2020.
- W. Zhang, X. Niu, L. Chen, F. Yuan and Y. Zhu, Sci. Rep., 2016, 6, 29062 CrossRef CAS PubMed
.
- Q. Wu, F. Zhang, P. Xiao, H. Tao, X. Wang, Z. Hu and Y. Lu, J. Phys. Chem. C, 2008, 112, 17076–17080 CrossRef CAS
.
- T. S. Sreeremya, A. Krishnan, K. C. Remani, K. R. Patil, D. F. Brougham and S. Ghosh, ACS Appl. Mater. Interfaces, 2015, 7, 8545–8555 CrossRef CAS PubMed
.
- S. Yang and L. Gao, J. Am. Chem. Soc., 2006, 128, 9330–9331 CrossRef CAS PubMed
.
- L. Yan, R. Yu, J. Chen and X. Xing, Cryst. Growth Des., 2008, 8, 1474–1477 CrossRef CAS
.
- K. Zhou, X. Wang, X. Sun, M. Q. Peng and Y. Li, J. Catal., 2005, 229, 206–212 CrossRef CAS
.
- H.-X. Mai, L.-D. Sun, Y.-W. Zhang, R. Si, W. Feng, H.-P. Zhang, H.-C. Liu and C.-H. Yan, J. Phys. Chem. B, 2005, 109, 24380–24385 CrossRef CAS PubMed
.
- P. A. Webb and C. Orr, Analytical methods in fine particle technology, Wiley, Norcross, 1st edn, 1997 Search PubMed
.
- S. Liu, X. Wu, J. Tang, P. Cui, X. Jiang, C. Chang, W. Liu, Y. Gao, M. Li and D. Weng, Catal. Today, 2017, 281, 454–459 CrossRef CAS
.
- T. Désaunay, G. Bonura, V. Chiodo, S. Freni, J.-P. Couzinié, J. Bourgon, A. Ringuedé, F. Labat, C. Adamo and M. Cassir, J. Catal., 2013, 297, 193–201 CrossRef
.
- Y. Li, Z. Wei, F. Gao, L. Kovarik, C. H. F. Peden and Y. Wang, J. Catal., 2014, 315, 15–24 CrossRef CAS
.
- M. Kovacevic, B. L. Mojet, J. G. van Ommen and L. Lefferts, Catal. Lett., 2016, 146, 770–777 CrossRef CAS
.
- M. García-Melchor and N. López, J. Phys. Chem. C, 2014, 118, 10921–10926 CrossRef
.
- D. Wang, Y. Kang, V. Doan-Nguyen, J. Chen, R. Kngas, N. L. Wieder, K. Bakhmutsky, R. J. Gorte and C. B. Murray, Angew. Chem., Int. Ed., 2011, 50, 4378–4381 CrossRef CAS PubMed
.
- A. Bueno-López, Appl. Catal., B, 2014, 146, 1–11 CrossRef
.
- M. M. Maricq, J. Aerosol Sci., 2007, 38, 1079–1118 CrossRef CAS
.
- B. A. A. L. van Setten, M. Makkee and J. A. Moulijn, Catal. Rev., 2001, 43, 489–564 CrossRef CAS
.
- E. Aneggi, C. Leitenburg and A. Trovarelli, Catal. Today, 2012, 181, 108–115 CrossRef CAS
.
| This journal is © The Royal Society of Chemistry 2020 |

