
 Open Access Article
 This Open Access Article is licensed under a Creative Commons Attribution-Non Commercial 3.0 Unported Licence
The flow limiting operator: a new approach to environmental control in flow bioreactors
Jeffrey Horbatiuk a,
Lubna Alazzawib and
Carolyn A. Harris*cde
a,
Lubna Alazzawib and
Carolyn A. Harris*cde
aCollege of Liberal Arts and Sciences, Wayne State University, Detroit, MI, USA. E-mail: jeff.horbatiuk@gmail.com
bDepartment of Electrical and Computer Engineering, Wayne State University, USA. E-mail: alazzawi@wayne.edu
cDepartment of Chemical Engineering, Wayne State University, Detroit, MI, USA. E-mail: caharris@wayne.edu
dDepartment of Biomedical Engineering, Wayne State University, USA
eDepartment of Neurosurgery, Wayne State University, USA
First published on 26th August 2020
Abstract
Bioreactors have become a critical step for the testing of new biomaterials and pharmaceuticals. They need to be controllable, ideally high-throughput, and produce a biologically relevant environment. For example, in the brain, it is essential to recreate multiple flow–pressure profiles daily and mimic brain fluid movement for a bioreactor to be more physiologic. In this study, we demonstrate a scalable system that regulates flow rate, pressure, and pulsation amplitude. We also show that with new microcontroller technology, up to 15 chambers running in parallel is theoretically possible. Our system, the Flow Limiting Operator (FLO), achieves these goals by multiplexing a series of valves and pumps to control pressure and volumetric flow rate instead of relying on head gas pressure. With the ability to control multiple parameters and its ease of use, both scientists and clinicians can use FLO to study the effects of pulsation amplitude of the fluid flow, flow rate, and pressure on intercellular interactions for both biomaterials and pharmaceuticals.
Introduction
Bioreactors have become an integral part of testing biomaterials and pharmaceuticals. They are among the first steps for testing because they are faster, cheaper, and more controlled than most multi-factorial animal models. They also act as an important intermediary between computer models and complex biological systems because mechanisms can occur freely instead of relying upon predicted simulations. Bioreactors need to be as physiologic as possible to test specific hypotheses. Many factors go into predicting a cell's behavior including pressure, flow rate, and pulsation amplitude. However, to be an accurate model, these factors need to change over time, something with which current models struggle.1,2 We have created a bioreactor that can manipulate flow rate and pressure as a function of time instead of an arbitrary constant value.There is precedence for biomaterials behaving differently under varying shear stress and pressures. For instance, protein adsorption and cell attachment to biomaterials used for treating the neurologic disorder hydrocephalus is dependent on flow rate.3 Also, micromotion on this scale has already been shown to influence cell migration to some chronically implanted neural probes.1 Furthermore, it is known that the brain goes through cyclical periods of high and low mean flow rates, changes in bulk pressures, and pulsation amplitudes because of rudimentary processes such as circadian rhythm.1,4,5 Therefore, it is logical that these changes may impact neurological biomaterials' performance in other unknown manners.
While there are multiple other variables that influence cell behavior, pressure, flow rate, and pulsation amplitude are among the easiest to manipulate. There are bioreactors devoted to controlling these factors including LumeGen by Bangalore Integrated System Solutions ITE (BISS),6 the Supervising Unit for In Vitro Testing (SUITE),7 and the bioreactor proposed by Mazzei et al.8 All these systems rely on peristaltic pumps to circulate media into chambers and a series of valves used to regulate gases going into the chamber itself. Some systems, like the one sold by BISS can control up to six chambers in parallel, but this is the upper limit of most systems. Another key difference is that these models are targeted towards only pharmaceuticals and not a combination of biomaterials and pharmaceuticals. The difference is the ability to embed the biomaterial into the chamber environment.
Other model systems, such as microfluidic devices, focus on creating very high throughput environments in an easy to analyze size. However, this comes at the cost of size which makes it difficult to study specific cellular responses to biomaterials. For instance, many microfluidic devices have difficulty incorperating three-dimensional substrates. While attempts have been made to change this shortcoming, particularly in brain on a chip models, most substrate materials are added in such small quantities that they adhere to porous membrane instead of forming an independent structure. Additionally, because the substrates are separated by a membrane, cell communication is limited to cytokine transmission, not touch.9,10 This is detrimental to specific cell types within the brain that utilize contact for growth, such as astrocytes.11 Finally, these models have limited operating times ranging up to 14 days.10
However, our system, the Flow Limiting Operator (FLO), improves the previously established systems developed by Harris et al. by creating an add-on system to optionally control flow, pressure, and flow amplitude (Fig. 1a).1,12 Since our system is an addition to the system by Harris et al.,12 the same benefits are still theoretically possible, including running the chambers for more than a month, embedding the biomaterial into an extracellular matrix, and controlling up to 15 chambers at once. Conversely, unlike other bioreactor systems that control pressure through the addition of gas, we present a bioreactor which controls pressure by changing the local speed of fluid moving through the pressure valve. This allows the possibility to change other factors, like chamber compliance. Finally, with improved microcontroller technology, waveforms can be modified as a function of time and constantly monitored.
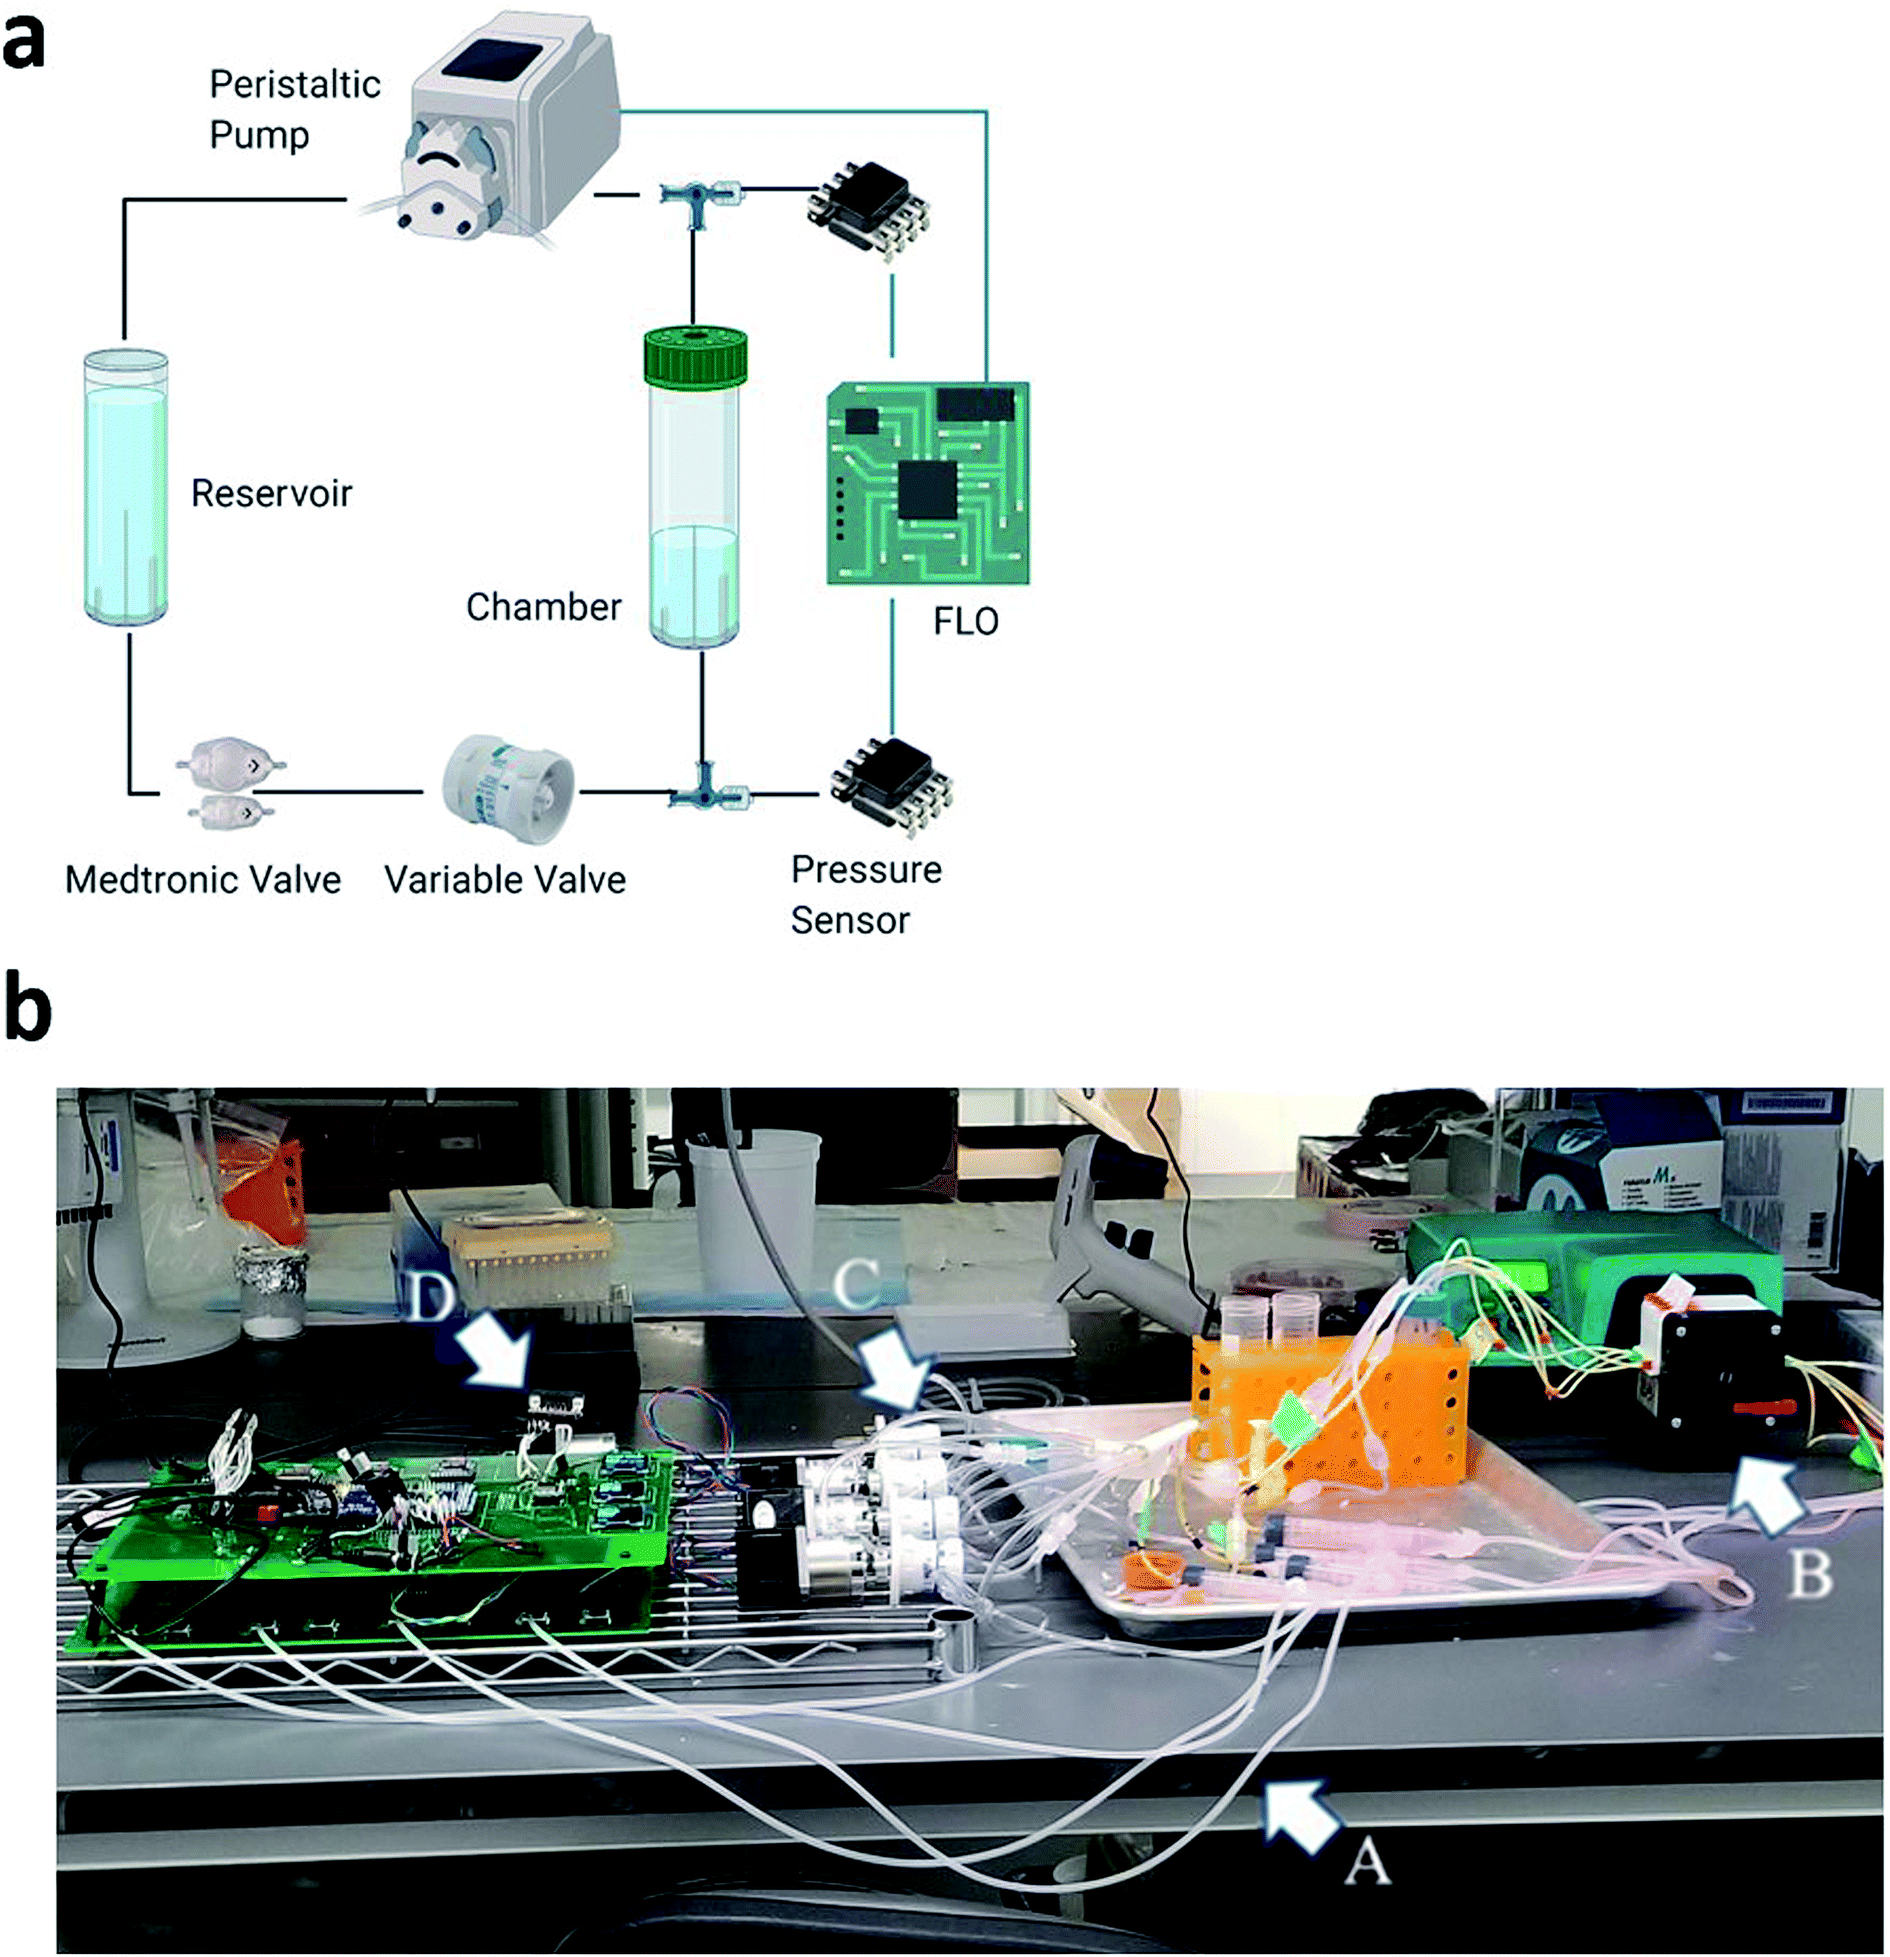 | ||
| Fig. 1 (a) Circuit diagram of the FLO system. Black lines indicate fluid connections while blue indicate electrical connections. Figure created in BioRender with imported images from Honeywell Sensing, Medtronic, and GVS group. (b) Real life representation of FLO. (A) Air columns used to detect changes in pressure. (B) Peristaltic pump used to push fluid through the system. (C) Variable valves which are turned by stepper motors. (D) Arduino module which is the control unit of the of the entire system. | ||
In this study, FLO was programmed to mimic the pressures, flow rates, and pressure amplitudes seen in the brain and show the limits of the current system. These values consist of 17 mmHg average pressure,13 6–9 mmHg for pressure amplitudes,14 and 15–30 ml h−1.15 This was chosen because the original system developed by Harris et al.1 was specifically designed to mimic these parameters important in brain physiology and pathophysiology. While the brain is used as the example model organ for FLO, any waveform can be programmed into the system. FLO is therefore applicable to virtually any organ system needed. This study aims to validate three parts of the FLO system: (1) that the readings obtained from FLO are similar to commercially available techniques; (2) that FLO can manipulate flow rates while keeping pressures within a user defined range; and, (3) that other items in FLO can be theoretically modified such as flow rate wave amplitude.
Results
Bulk pressure
The first step was to verify that bulk pressure detected by FLO was the same as traditional sensors as well as match a user defined value. A target pressure of 17 mmHg was used, and revolutions per minute (rpm) were calculated based on flow rates of 30 ml h−1 to 40 ml h−1. The tests showed no statistically significant difference between the FLO chambers and the traditional sensor (Fig. 2). When registering an over-pressure event, there was a slight delay between the traditional sensor registering a change in pressure and FLO matching the output, less than 1 minute (Fig. 2a). Then when compensating for an over-pressure events, FLO had no delay in registering the decrease in pressure (Fig. 2b). Finally, trends show when the system was below the target pressure and attempted to raise the pressure, there was a delay greater than two minutes between pressures rising in the chamber and the values being registered by FLO (Fig. 2c). While the FLO system did attempt to match the target pressure of 17 mmHg, it was not reached consistently due to changing flow rates. This implies a longer equilibration time needed for the variable valves than initially predicted because more pressure is needed in the air column to get a true positive.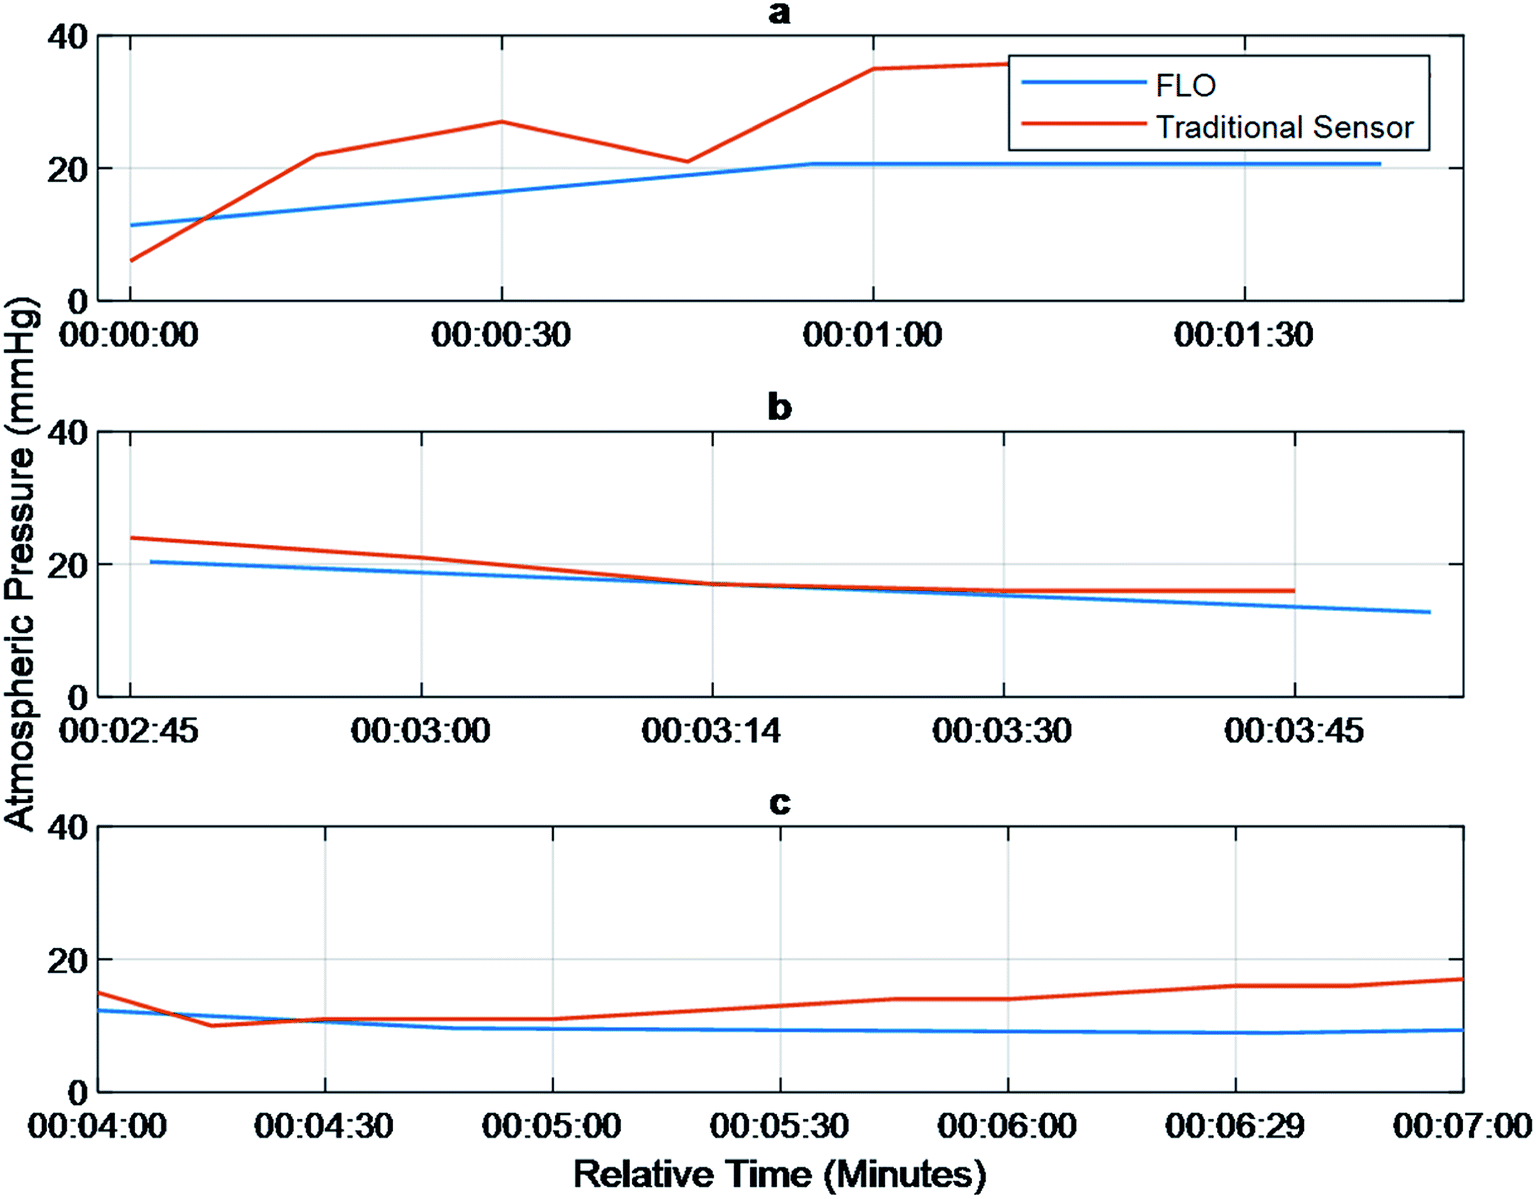 | ||
| Fig. 2 Pressure outputs detected by FLO and Codman Microsensors® were similar in numerical value. Graph of pressure over time in mmHg comparing FLO and traditional, Codman Microsensor®. (a) 40 ml h−1; (b) 30 ml h−1; (c) 40 ml h−1. | ||
Pressure waveforms
In order to verify that the pressure waveforms detected by FLO were the same as traditional sensors, three characteristics were compared: mean frequency, mean amplitude, and FFTs (Fast Fourier Transforms). FLO was set to a constant pressure of 17 mmHg and 30 ml h−1. This waveform was compared to the 8, 30, and 40 ml h−1 setup without FLO (Fig. 3). The frequency and amplitude of the pressure waves were calculated and showed that while the 30 ml h−1, 40 ml h−1, and FLO run at 30 ml h−1 had the same amplitude and frequency the 8 ml h−1 chamber signficantly differed from all other groups (p < 0.05) (Table 1).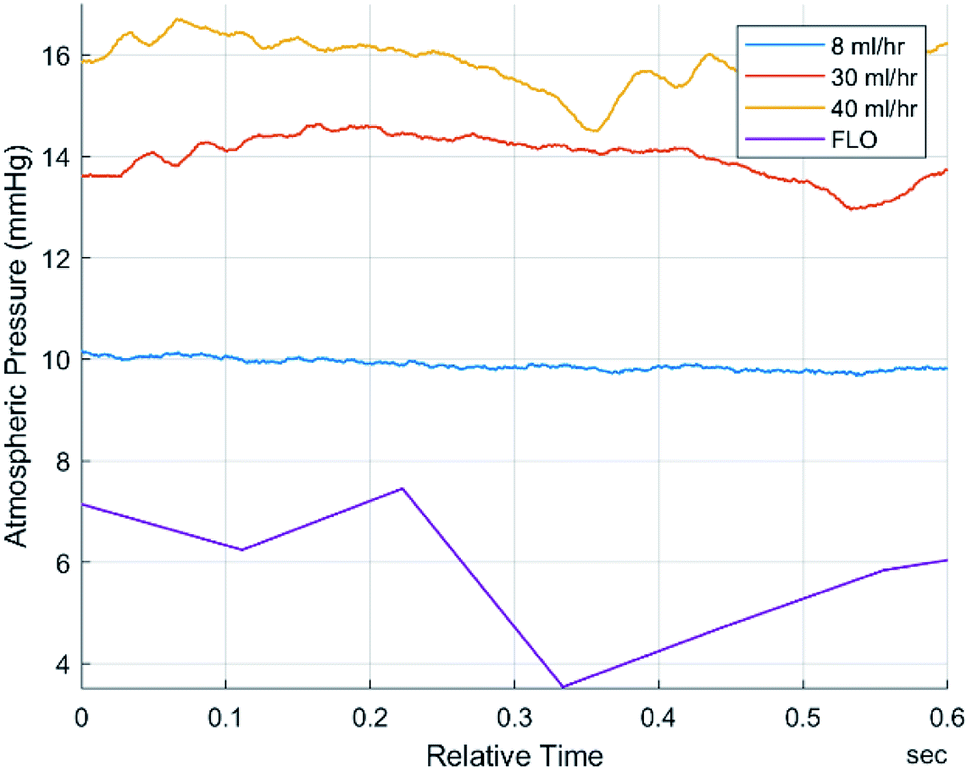 | ||
| Fig. 3 Data suggests a significant difference (p < 0.05) between the 8 ml h−1 frequency/amplitude and all other groups indicating a loss in pressure, possibly due to chamber fatigue. Other groups were not significantly different. | ||
| Pressure characteristics: 0.38 bore tubing | 8 ml h−1 | 30 ml h−1 | 40 ml h−1 | FLO (30 ml h−1) |
|---|---|---|---|---|
| Mean frequency (mmHg) | 4.0410 | 5.3849 | 5.8147 | 5.0534 |
| Frequency standard deviation (mmHg) | 0.1709 | 0.1696 | 0.5896 | 2.5556 |
| Mean amplitude (mmHg) | 0.0354 | 0.0620 | 0.0778 | 3.1646 |
| Amplitude standard deviation (mmHg) | 0.0015 | 0.0054 | 0.0127 | 2.0295 |
The FFT of each chamber were compared. FFTs works by decomposing an equation into an infinite series of sines and cosines to match the input waveform. The series can then be compared using more traditional means. This is typically used to determine the amount of compliance inside a chamber or body part. Not only was there extensive overlap in the raw signals but the graphs also showed a fundamental frequency at 0 hertz and no other harmonic frequencies (Fig. 4). Harmonic frequencies were defined as at least half of the fundamental frequency. This implies no other significant distortion due to flexing of the chambers or peristaltic tubes.
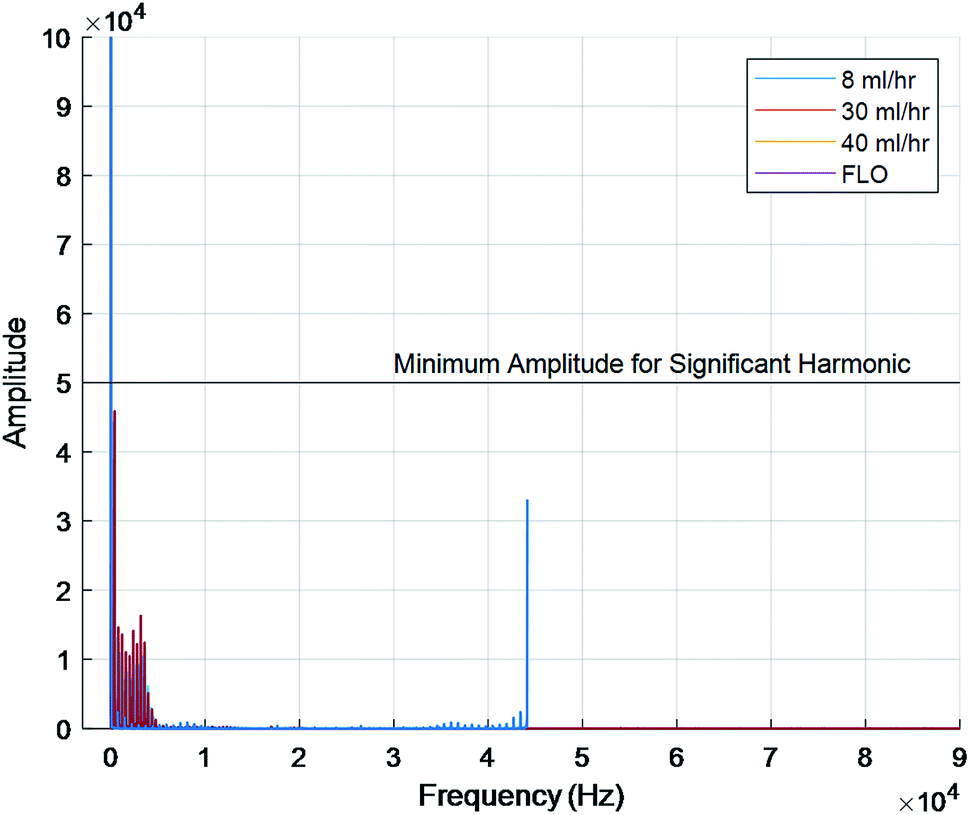 | ||
| Fig. 4 Fundamental frequency at 0 hertz for all chambers. No significant harmonic frequencies shown. | ||
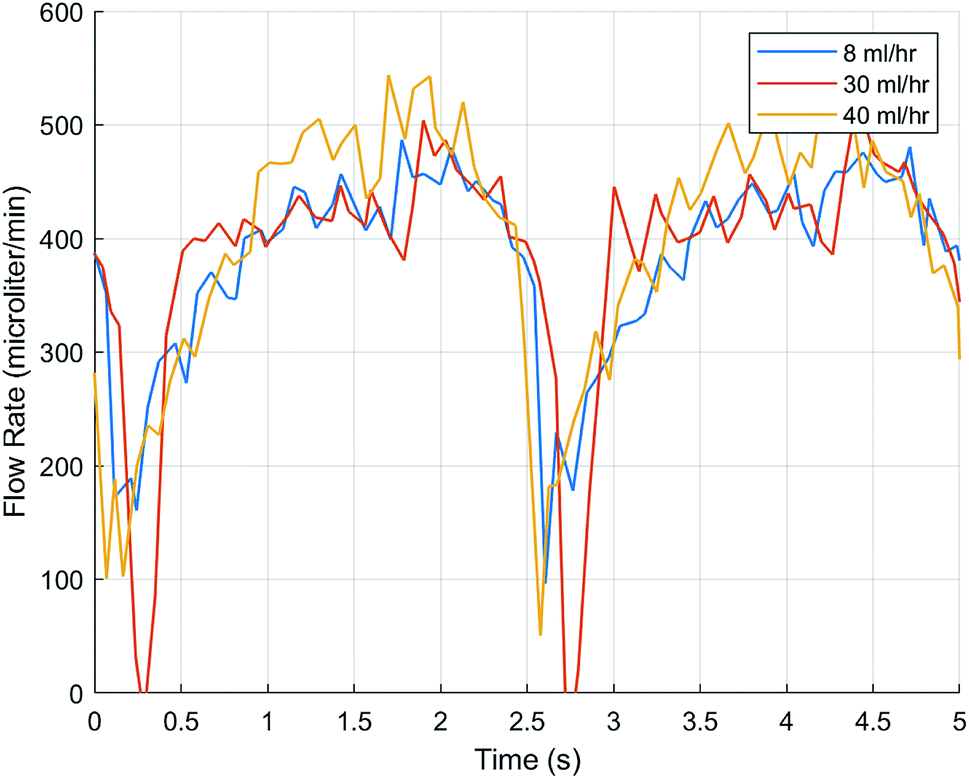
Flow waveform
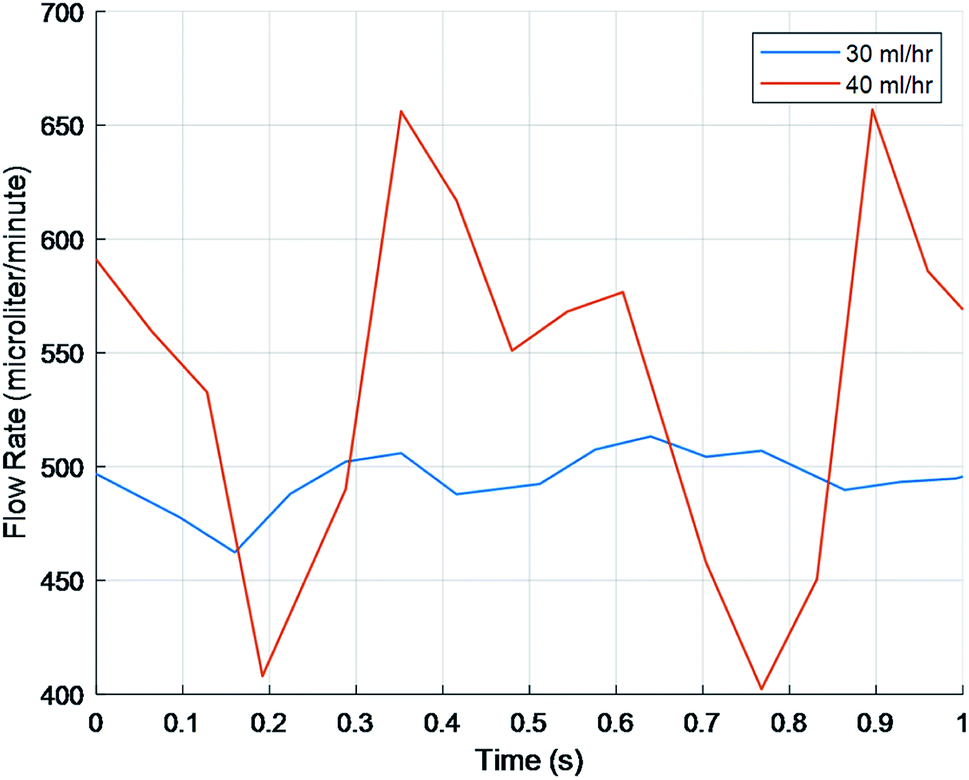
A similar process in which frequency, amplitude, and bulk flow rate were compared between FLO and the system without FLO using 38 mm peristaltic tubing. Statistics showed a significantly different amplitude only with regards to the 8 ml h−1 setting (p < 0.05) and no difference was seen between the frequencies (Table 2). Both the theoretical 30 ml h−1 and 40 ml h−1 sets did not show a significant difference between amplitude or frequency as supported by Fig. 5. No significant differences were found between the theoretical flow rates and the observed.| Flow characteristics: 0.38 mm bore tube | 8 ml h−1 | 30 ml h−1 | 40 ml h−1 | FLO (30 ml h−1) |
|---|---|---|---|---|
| Mean frequency (ml h−1) | 4.1726 | 4.4891 | 4.2464 | 3.5508667 |
| Frequency standard deviation (ml h−1) | 1.0102 | 1.7143 | 1.3517 | 1.351 |
| Mean amplitude (ml h−1) | 21.2782 | 110.5130 | 145.4964 | 92.079967 |
| Amplitude standard deviation (ml h−1) | 0.5165 | 2.2313 | 4.3042 | 6.4526 |
| Bulk flow rate (ml h−1) | 7.2801 | 23.8946 | 30.8753 | 25.414767 |
| Bulk flow rate standard deviation (ml h−1) | 1.7714 | 5.1722 | 5.1758 | 2.6629266 |
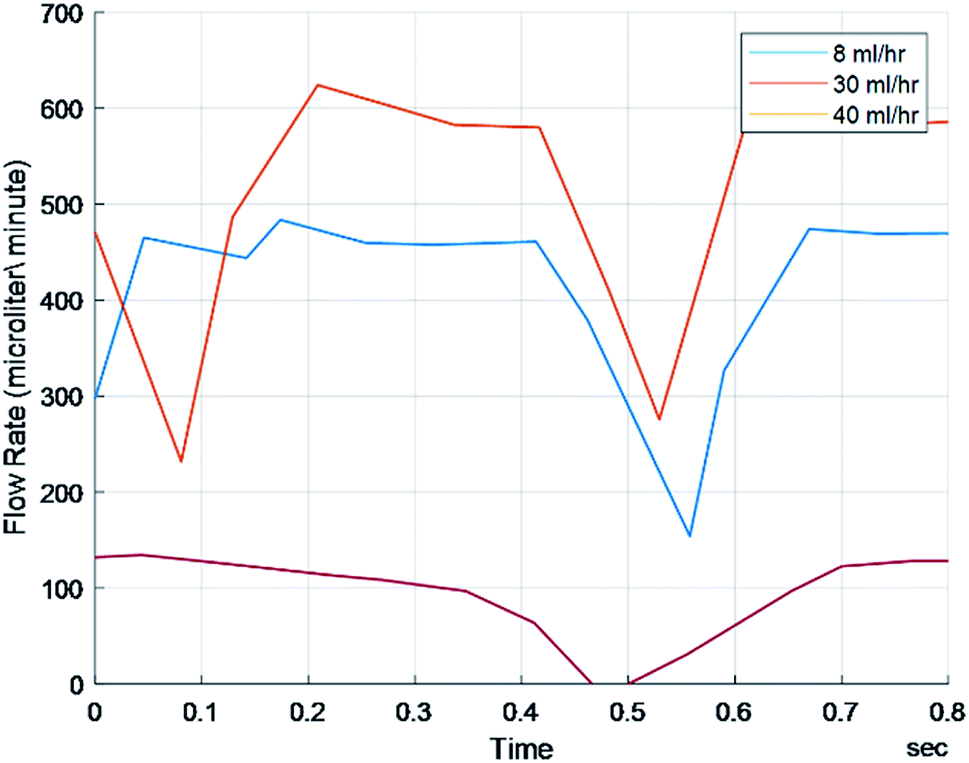
To test FLO's capabilities to maintain a target flow rate, 30 ml h−1 and 40 ml h−1 were programmed. FLO was compared to the chambers running at a constant 25 and 33 rpm. FLO showed no statistically significant difference in amplitude, frequency, or flow rate (p > 0.05). This is supported by graphs showing flow rate over time indicating a period of about 0.4–0.6 seconds and amplitudes of about 25–150 microliters (Fig. 6) which is similar to the control 25 and 33 rpm (Fig. 5). However, both the 30 and 40 ml h−1 groups were similar to each other, indicating an additional source of variance in the bioreactor system as a whole, regardless of FLO.
 | ||
| Fig. 5 Waveforms without FLO system. | ||
To manipulate pulsation amplitude while maintaining the shear stress, 1.02 mm bore tubing was used in place of 0.38 mm bore tubing (Fig. 7). Appropriate rpm were calculated to maintain flow rates based on the change in cross-sectional area between the 0.38 mm bore and 1.02 mm bore tubes. To verify the calculations, flow rates were calculated in MATLAB and compared via a one sample T test. Only the 40 ml h−1 matched the predicted value. Additionally, when comparing the three rpm to each other, the 40 ml h−1 was significantly different from the values other inputs.
 | ||
| Fig. 6 FLO using the 0.38 mm tubing at 30 ml h−1 and 40 ml h−1 shows similar waveform to the system without FLO at those same flow rates (p > 0.05). Note that part of what accounted for this similarity is a high standard deviation. | ||
Finally, when comparing the amplitude and frequency, no significant difference was found between each of the 1.02 mm tubes which can be seen on Fig. 7 in which the functions line up in their peaks, troughs, and frequency. However, while the frequency stayed similar to the 0.38 mm tubes the amplitude showed a significant difference for all three groups (p > 0.05), nearly doubling for the 8 and 40 ml h−1 (Table 3).
 | ||
| Fig. 7 Amplitudes, frequencies, and flow rates were similar between 1.02 mm bore flow rates but the amplitude was significantly larger than the 0.38 mm bore tubing (p < 0.05). | ||
| Flow characteristics: 1.02 mm bore tubing | 8 ml h−1 | 30 ml h−1 | 40 ml h−1 |
|---|---|---|---|
| Mean frequency (ml h−1) | 3.2275 | 3.9122 | 4.2207 |
| Frequency standard deviation (ml h−1) | 0.2676 | 0.3025 | 0.8002 |
| Mean amplitude (ml h−1) | 40.4464 | 81.8513 | 212.0940 |
| Amplitude standard deviation (ml h−1) | 0.7581 | 1.3132 | 5.6750 |
| Bulk flow rate (ml h−1) | 12.7253 | 24.8924 | 53.6856 |
| Bulk flow rate standard deviation (ml h−1) | 0.228792 | 0.402876 | 0.97341 |
Discussion
Most bioreactors are meant to test biomaterials in a semi-dynamic short-term environment. Our FLO system aims to expand on these gaps by modifying the system created by Harris et al.1 to allow multiple pressure and flow waves while creating an environment suitable for long-term biomaterials experiments. The system by Harris et al.1 was used because it is already high throughput, allowing up to 15 samples at once, encloses the target biomaterial in an extracellular matrix analog, and can be run for up to 2 months.12 Therefore, it made it a good candidate for improvement because it accomplished three goals already.The theory behind FLO is that it manipulates the pressure by increasing the resistance on the outlet of the chamber using a variable valve. This is different from current models which use headspace gases to increase or decrease the pressure. FLO is instead based on the Bernoulli equation (eqn (1)) which represents all forms of usable energy in a flowing system. Note that because there is no height change, as the pressure goes up the velocity must decrease.
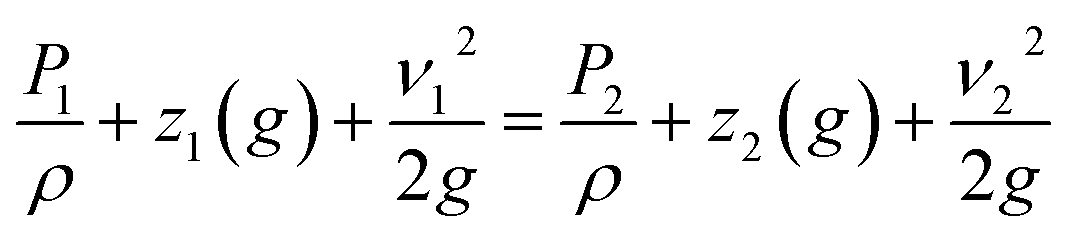 | (1) |
The Bernoulli equation indicates that all energy going into the system must come out of the system but in potentially different forms. Subscript 1 indicates the variables inside the chamber; subscript 2 indicates energies occurring past the variable valve. P indicates pressure, ρ indicates density, z indicates height above table, ν indicates velocity of fluid (m s−1), g indicates gravitational constant.
The experiments performed suggest that FLO followed the Bernoulli equation. For instance, Fig. 2 tried to show that FLO could get the chamber at a specific pressure at different flow rates. Even though the graph does not show a straight line consistently at the target pressure 17 mmHg, every time the flow rate changed, one can see a spike in pressure followed by a slow manipulation towards 17 (Fig. 2c). The initial spike came from the immediate change in volumetric flow (Fig. 2b) from the pump while the slow changes came from FLO moving the resistance on the variable valve. This implies that another method of action is taking place when being filled as opposed to being discharged, such as a longer time to fill the air column. The graph shows that given enough of time at a specific flow rate/pressure combination, FLO can meet the target pressure. This appears to be approximately 3 minutes.
Next, the fact that Fig. 4 only showed a single major peak at 0 hertz indicates no compliance. This is because each line on an FFT indicates elastic deformation of the organ/bioreactor. The FFT deconstructs the signal into an infinite sum of sines and cosines to create a specific line graph of interferences. This has become one of the gold standards for studying waveform activities.13 While other noises were seen on the graphs, they can be explained by the insignificant elastic deformations of the tubing, air pockets, and subtle vibrations on the table.
In Fig. 5 and 6, the fact that both the frequency and flow rate were similar is suspect because the rpm were set higher, 25 and 33, respectively. An increase in wave frequency would be expected as each time the roller compresses the peristaltic tubing, that event should be recorded. A common issue that may have affected the study's outcome includes having small leaks in the chamber. An area of further research includes creating better chambers with a better seal. Furthermore, confirming whether other flow rates, such as 12 ml h−1, including in the 1.02 mm bore tubing, would be advantageous as this is another commonly used value to flow rates in the brain.16
While the FLO system is specifically designed to study biomaterials related to hydrocephalus, it can be adapted to study other materials and specific biologic responses. A potential scenario includes testing traumatic brain injury (TBI) and white blood cells infiltration into the ventricular space. This is something that is already documented by animal studies.17–19 However, the effects of white blood cells on the immune privileged brain is still largely unknown. It is known that white blood cells, such as neutrophils, can manipulate their shape based on pressures and flow rates to get through tight membranes.20 Additionally, blood cells usually do not enter the interstices of the brain unless there is TBI. Moreover, the TBI also would activate macrophages to have M1 characteristics thereby potentially causing neurodegeneration through oxidative stress.21 Research into situations like this in a controlled In Vitro environment can help explain why outcomes with neural implants go wrong so often.
Since FLO is designed to be high throughput, it can be used to study pharmaceuticals in a more robust manner. Treatments are designed around carefully identified biological mechanisms. An example of this discrepancy is the bioavailability of nitric oxide. During strenuous activities, such as exercise, the bioavailability of nitric oxide has been shown to increase compared to homeostatic conditions.22 However, in longer term studies, organic nitrates have also been shown to produce nitrate tolerance.23 Both conditions are impossible to study with current technology because current bioreactors cannot create the acute environment of strenuous activities nor the everyday fluctuations known to happen.
Future work includes modeling other organ systems such as the heart, kidneys, and liver. This could lead to integrating a series of organ systems similar to the ones seen in the SUITE model and in current multi-organ on a chip models, as FLO uses similar technology in these devices. Specific examples include the placement of hydrogels into confined areas for unidirectional expansion, similar to current myocardial systems,10 and the addition of a larger 3D cellular matrix which allows for closer cellular communication.24 These types of studies would elucidate interdependency of other bodily signals on foreign body response to biomaterials.7,10
An especially promising piece of future work is our plan to create a chamber made of clear vinyl that can have tunable compliance. This would be a step away from current technologies in microfluidic devices that are dependent on an external pumps to control material compliance, instead focusing on a single complete system.10 We also hope to add additional cell stimuli including various cytokines to mimic biomaterial insertion, cell–cell communication, and cell activation. Lastly, we aim to increase the sensing range of FLO and make it portable to image cells as they attach in real time.
Experimental
The base system we are attempting to improve upon consisted of a reservoir, chamber, biomaterial, and static valve. Cell culture media was driven through 1.6 mm silicone tubing and emptied into the chamber. Inside the chamber, pieces of Medtronic ventricular catheters (Medtronic, Dublin, Ireland) cut approximately 5 cm from the drainage eye were embedded via a Luer lock system. The Luer lock system was then attached to a high-pressure Medtronic flow controlled valve (Medtronic, Dublin, Ireland) via an additional 75 cm of silicone tubing. Finally, the fluid was circled back to the reservoir. To drive fluid through FLO, a Watson Marlow 323 DU peristaltic pump equipped with a 314MC attachment and 0.38 mm bore/1.02 mm bore peristaltic tubing was used. This was similar to Harris et al. (2010) (Wilmington, MA, USA). For controls, the system was run at 7, 25, and 33 rpm![[thin space (1/6-em)]](https://www.rsc.org/images/entities/char_2009.gif) 1 for at least 2 minutes per test sample. The target flow rates included 8, 25, and 33 ml h−1 and represent standard flow rates for humans over a 24 hours period.16
1 for at least 2 minutes per test sample. The target flow rates included 8, 25, and 33 ml h−1 and represent standard flow rates for humans over a 24 hours period.16
Media creation and priming
All experiments were conducted with cell culture media consisting of 10% Fetal Bovine Serum (FBS) (ScienceCell, Carlsbad, CA, USA), 1% penicillin–streptomycin (ThermoFisher Scientific, Waltham, MA, USA), and Dulbecco's Modified Eagle Medium (DMEM) (TheroFisher Scientific, Waltham, MA, USA). This combination was used because the viscosity is slightly higher than that of water, approximately 0.94 cP (ref. 25), and allows for protein adsorption onto the valve mechanism.To prime the system, 70% ethanol was first run through the chamber system for at least 20 minutes to decrease the bacterial load and dissolve any remaining particles. Cell culture media was then run through the system for at least two hours to coat the chambers with proteins and remove any ethanol residue. This media was then replaced before the start of any tests. This process was completed every seven days.
Pressure waveform testing
To obtain the average pressure over time, a Codman Microsensor® attached to a Codman ICP Express® monitor was placed adjacent to the chamber via a 3-way Luer lock and 10 cm fluid column. A Tuohy Borst Valve® (Qosina, USA) was used to close the system and care taken to not damage the sensor shaft. The microsensor was calibrated according to the manufacturer's instructions between each chamber. Pressures, in mmHg, were recorded every 15 seconds for 3 minutes per target flow rate.To obtain the pressure data including amplitude, frequency, and waveform shapes, a SP200 Pressure Control Unit (Transonic, USA) was connected to a 1.6 French rodent catheter. The catheter was calibrated, hydrated, and zeroed between each chamber per the manufacturer's instructions. Like the Codman insertion technique, the catheter was placed adjacent to the fluid via a 3-way Luer lock and 10 cm fluid column. A Tuohy Borst Valve® (Qosina, USA) was used to close the system and care taken to not damage the sensor shaft. Pressures in mmHg were continuously recorded and read using the Labscribe® data package. Each chamber could run for 3 minutes per theoretical flow rate.
Flow waveform testing
To calculate the flow rate and flow patterns coming out of the chamber, a SLI liquid flow sensor (Sensirion®, Switzerland) was placed in series with the catheter directly outside the chamber. It was primed with 1% w/v Tergezyme® and water, deionized water, and 90% v/v isopropanol alcohol. The SLI sensor was programed to use 16 bit resolution linearized data sampling. When connecting to the sensor, care was taken to eliminate any air pockets in the chamber. During each FLO test, theoretical flow rates of 8, 30, and 40 ml per hour were used which extrapolated to 7, 25, and 33 rpms. Outputs were read and recorded using the stock Sensirion® RS485 program and were saved as microliters per minute.FLO design
FLO is controlled by an Arduino 2560 and has three distinct functions: sensing the data, manipulating the parameters in the chamber system, and recording the results. This is done through two custom printed circuit boards (PCBs) (JLCPCB, Hong Kong, China), one with which the user interfaces and another devoted to interfacing with the chambers. To accomplish these tasks, FLO uses a combination of serial peripheral interface (SPI), inter–intercommunication (I2C), serial-in/parallel-out (SIPO), and Universal Asynchronous Receiver/Transmitter communication systems (UART).To sense the pressure, FLO uses 74 cm air columns connected to 3-way Luer locks in-line to the fluid flow (Fig. 1a). The air columns were connected to HSCMRNN015PAAA5 absolute pressure sensors (Mouser, USA). To transform the absolute pressure readings into atmospheric pressure, a constant 100 kPa was subtracted from all FLO values. The pressure sensor then sent analog signals to a 10 bit analog-to-digital-converter (ADC) (MCP3008, Digikey Electronics, USA) which was connected to a 4.5 voltage reference (Digikey Electronics, USA). This chip then relayed the information to the Arduino via the SPI bus at 3.6 MHz using the Adafruit MCP3008 library.26
To control the peristaltic pump, the stock RS232 communication bus on the pump was used.27 A UART to RS232 adapter transformed the RS232 voltage level into appropriate transistor–transistor logic (Sparkfun, Niwot, CO, USA). A linear relationship between rpm and flow rate was established with the 0.38 mm bore peristaltic tubing to be 0.0203 ml per min per rpm and showed a high correlation coefficient, R2 > 0.94.
To control the pressure, FLO took an average of 10 pressure readings from each chamber and used a threshold function to turn a Nema 17 stepper motor (STEPPERONLINE, USA) connected to the variable valve (Amazon, Seattle, WA, USA) (Fig. 1b). This valve increased or decreased the resistance to fluid flow thereby changing the inline pressure while leaving the volumetric flow rate the same. To drive the step motors, each coil was connected to half of a TB6612 dual H-bridge (Digikey LLC, USA). The logic patterns of when to energize each coil was pre-programmed into the Arduino. Each sequence, once selected by the threshold function, would be sent in binary to the SN54HC595 (Digikey Electronics, USA) SIPO shift registers. These in turn would signal the TB6612 H-bridges accordingly.
The ten data points used to find the average pressure were sent to two different SD readers to create the pressure waveform. As a further back-up, FLO used a total of four SD readers which ensure that if one pair of SD readers reach capacity or is disconnected, data can still be recovered. To choose which card reader is used, FLO went through a series of If–Else statements to determine if the cards are at capacity or not inserted properly. If either condition was broken for all SD cards, the user was alerted via the user interface. To interface with so many cards, FLO used the open source SdFs library28 which also allows the SD cards to be formatted using any of the file allocation table systems, including exFAT.
The user interface consisted of a combination of (Organic Light Emitting Diode) OLED displays (Mini Arduino store, China) and dual in-line packages (DIP switches) (Digikey LLC, USA). The DIP switches formed an electrical connection in series with a shift register to determine if there is power connected to the chamber. The OLED display not only showed values of each of the chambers but also warning signals such as if the SD cards are no longer connected or if a chamber is inactive. To keep FLO referenced to time, all actions were tied to a DS3231 real time clock module that updated when any new data is recorded.29,30
Power regulation was achieved through a 12 volt alternating current to direct current wall adapter which was then subdivided into 5 and 10 volt pathways using LM1084IT-5.0 and LM7810 linear regulators respectively (Digikey Electronics, USA). These voltages were galvanically isolated from each other and smoothed out via various aluminum and ceramic capacitors sizes. Applicable sizes were chosen to optimize power distribution at each data transmission frequency (Digikey Electronics, USA). To make the physical connections, ground plane and power planes were employed. This design not only distributes heat efficiently but also decouples analog signals.
Statistics
Three separate chambers were run with FLO and five chambers without FLO. Within each chamber at least five observations were made with the FLO model and more than 5000 with the traditional sensors. The samples were assumed non-parametric due to the small sample size. To analyze bulk pressure readings, area under the curves were compared via a paired T-test. This was because of the varying times at which observations were taken from each chamber. Additionally, area outside the sensing range of the absolute pressure sensors were excluded from analysis. To compare pressure waveforms, key parameters such as amplitude, frequency, and Fast Fourier Transforms (FFTs) were compared. All computations and graphs were made in MATLAB. Flow rates were calculated by averaging the flow rates determined by the SLI liquid flow sensor. These were compared to their theoretical values of 8 ml h−1, 30 ml h−1, and 40 ml h−1 using a one sample T test. Furthermore, amplitude and frequency were compared between flow rates using a Kruskal–Wallis test and Mann–Whitney post hoc. All statistical analysis was conducted in SPSS with an alpha of 0.05.Conclusion
Herein, we showed how to create a new system that can mimic multiple different flow and pressure waveforms throughout the day by manipulating the flow velocity of the medium. This opens the door to test new biomaterials' reactions and cellular mechanisms in real time. This model proved scalable, currently running three chambers in parallel at once but capable of adding more if needed. This would allow for better optimization and statistical analysis to take place by researchers, clinicians, and corporations alike. Furthermore, this model proved that different factors can be manipulated aside from flow and pressure. Examples included the amplitude of peaks. Future improvements include increasing the sensing range of the system to better accommodate multiple organ systems like the lungs, heart, and kidneys.Conflicts of interest
There are no conflicts of interest to declare.Acknowledgements
Research reported in this publication was supported by the National Institute of Neurological Disorder and Stroke of the National Institutes of Health under award number NIH 1R01NS094570-01A1. Approximately 80% of this project was financed with federal dollars. The content is solely the responsibility of the authors and does not necessarily represent the official views of the National Institutes of Health.References
- C. A. Harris, J. H. Resau, E. A. Hudson, R. A. West, C. Moon and J. P. Mcallister II, Exp. Neurol., 2010, 222, 204–210 CrossRef PubMed.
- BISS TGT Pulsatile Pressure & Flow Biorectors, http://www.tissuegrowth.com/prod_vascular.cfm, accessed 18 December 2018 Search PubMed.
- C. A. Harris, J. H. Resau, E. A. Hudson, R. A. West, C. Moon, A. D. Black and J. P. McAllister, J. Biomed. Mater. Res., Part A, 2011, 97, 433–440 CrossRef PubMed.
- R. Aaslid, S. R. Lash, G. H. Bardy, W. H. Gild and D. W. Newell, Dynamic Pressure–Flow Velocity Relationships in the Human Cerebral Circulation, Stroke, 2003, 34(7), 1645–1649 CrossRef PubMed.
- T. Sæhle and P. K. Eide, J. Neurosurg., 2015, 122, 1076–1086 Search PubMed.
- K. Vilendrer, E. Prairie and T. Nickel, US Pat., 7348175, 2003.
- S. Giusti, D. Mazzei, L. Cacopardo, G. Mattei, C. Domenici and A. Ahluwalia, Processes, 2017, 16, 1–15 Search PubMed.
- D. Mazzei, F. Vozzi, A. Cisternino, G. Vozzi and A. Ahluwalia, IEEE Trans. Ind. Electron., 2008, 55, 3273–3280 Search PubMed.
- S. Bang, S. Jeong, N. Choi and H. N. Kim, Biomicrofluidics, 2019, 13, 1–7 CrossRef PubMed.
- Q. Wu, J. Liu, X. Wang, L. Feng, J. Wu, X. Zhu, W. Wen and X. Gong, Biomed. Eng. Online, 2020, 19, 1–19 CrossRef PubMed.
- G. Carmignoto, Prog. Neurobiol., 2000, 62, 561–581 CrossRef CAS.
- C. Harris, K. Pearson, K. Hadley, S. Zhu, S. Browd, B. W. Hanak and W. Shain, Fluids and Barriers CNS, 2015, 12, 26 CrossRef.
- M. Czosnyka and J. D. Pickard, J. Neurol., Neurosurg. Psychiatry, 2004, 75, 813–821 CrossRef CAS PubMed.
- M. H. Morgalla, F. Stumm and G. Hesse, J. Neurol. Sci., 1999, 168, 90–95 CrossRef CAS.
- T. Brinker, E. Stopa, J. Morrison and P. Klinge, A New Look at Cerebrospinal Fluid Circulation, Fluids Barriers CNS, 2014, 11, 10 CrossRef PubMed.
- C. Nilsson, F. Stahlberg, C. Thomsen, O. Henriksen, M. Herning, C. Owman, F. Sthhlberg, C. Thom-sen and C. Owman Circadian, Circadian variation in human cerebrospinal fluid production measured by magnetic resonance imaging, Am. J. Physiol.: Regul., Integr. Comp. Physiol., 1992, 262(1), R20–R24 CrossRef CAS.
- A. Louveau, I. Smirnov, T. J. Keyes, J. D. Eccles, S. J. Rouhani, J. D. Peske, N. C. Derecki, D. Castle, J. W. Mandell, K. S. Lee, T. H. Harris and J. Kipnis, Nature, 2015, 523, 337–341 CrossRef CAS PubMed.
- Y. W. Liu, S. Li and S. S. Dai, Neutrophils in traumatic brain injury (TBI): friend or foe?, J. Neuroinflammation, 2018, 15, 146 CrossRef PubMed.
- R. Härtl, M. B. Medary, M. Ruge, K. E. Arfors and J. Ghajar, J. Cereb. Blood Flow Metab., 1997, 17, 1210–1220 CrossRef PubMed.
- R. D. Kamm, Cellular Fluid Mechanics, 2001 Search PubMed.
- A. Singh, R. Kukreti, L. Saso and S. Kukreti, Molecules, 2019, 24, 1583 CrossRef CAS PubMed.
- R. Michishita, M. Ohta, M. Ikeda, Y. Jiang and H. Yamato, Hypertens. Res., 2016, 39, 792–798 CrossRef CAS PubMed.
- R. P. Mason and J. R. Cockcroft, J. Clin. Hypertens., 2006, 8, 40–52 CrossRef CAS PubMed.
- M. Hegde, R. Jindal, A. Bhushan, S. S. Bale, W. J. McCarty, I. Golberg, O. B. Usta and M. L. Yarmush, Lab Chip, 2014, 14, 2033–2039 RSC.
- E. Fröhlich, G. Bonstingl, A. Höfler, C. Meindl, G. Leitinger, T. R. Pieber and E. Roblegg, Toxicol. In Vitro, 2013, 27, 409–417 CrossRef PubMed.
- C. Nelson, Adafruit_MCP3008, https://github.com/adafruit/Adafruit_MCP3008 Search PubMed.
- Watson-Marlow Bredel Manuals, https://www.manualslib.com/products/Watson-Marlow-323u-10326488.html Search PubMed.
- B. Greiman, SdFs, https://github.com/greiman/SdFs/blob/master/LICENSE.md, accessed 8 August 2019 Search PubMed.
- P. Rodan, ds3231, https://github.com/rodan/ds3231 Search PubMed.
- Adafruit_SSD1306, https://github.com/adafruit/Adafruit_SSD1306 Search PubMed.
| This journal is © The Royal Society of Chemistry 2020 |