 Open Access Article
Creative Commons Attribution 3.0 Unported Licence
The C2N surface as a highly selective sensor for the detection of nitrogen iodide from a mixture of NX3 (X = Cl, Br, I) explosives†
Muhammad Yara,
Muhammad Ali Hashmi b and
Khurshid Ayub
 *a
*a
aDepartment of Chemistry, COMSATS University, Abbottabad Campus, KPK 22060, Pakistan. E-mail: khurshid@cuiatd.edu.pk; Tel: +92-992-383591
bDepartment of Chemistry, University of Education, Attock Campus, Attock, 43600, Punjab, Pakistan
First published on 27th August 2020
Abstract
Explosives are quite toxic and destructive; therefore, it is necessary to not only detect them but also remove them. The adsorption behavior of NX3 analytes (NCl3, NBr3 and NI3) over the microporous C2N surface was evaluated by DFT calculations. The nature of interactions between NX3 and C2N was characterized by adsorption energy, NCI, QTAIM, SAPT0, NBO, EDD and FMO analysis. The interaction energies of NX3 with C2N are in the range of −10.85 to −16.31 kcal mol−1 and follow the order of NCl3@C2N > NBr3@C2N > NI3@C2N, respectively. The 3D isosurfaces and 2D-RGD graph of NCI analysis qualitatively confirmed the existence of halogen bonding interactions among the studied systems. Halogen bonding was quantified by SAPT0 component energy analysis. The SAPT0 results revealed that ΔEdisp (56.75%) is the dominant contributor towards interaction energy, whereas contributions from ΔEelst and ΔEind are 29.41% and 14.34%, respectively. The QTAIM analysis also confirmed the presence of halogen bonding between atoms of NX3 and C2N surface. EDD analysis also validated NCI, QTAIM and NBO analysis. FMO analysis revealed that the adsorption of NI3 on the C2N surface caused the highest change in the EHOMO–LUMO gap (from 5.71 to 4.15 eV), and resulted in high sensitivity and selectivity of the C2N surface towards NI3, as compared to other analytes. It is worth mentioning that in all complexes, a significant difference in the EHOMO–LUMO gap was seen when electronic transitions occurred from the analyte to the C2N surface.
1. Introduction
Chemical warfare and toxic explosives pose serious threats to civilians and the military defense system. It is essential to quickly detect and dispose of these chemical warfare agents (CWAs) and toxic explosives for the safety and security of civilian and military defense systems. Nitrogen halides are extremely explosive materials in which the N-atom is connected with one of the halogen atoms (Cl, Br and I). NI3 is a highly shock-sensitive red crystalline material and can even explode under slight mechanical stress.1,2 It is usually stable in NI3·NH3 adduct form. NCl3 is a bright yellow volatile liquid that has an unpleasant smell, with a reported melting point of −27 °C and can auto-ignite in the range of 71–73 °C.3 The red oily volatile liquid NBr3 is also a temperature-sensitive agent.4 The literature review revealed that many studies have been carried out for the detection of NCl3 on different surfaces with different chemical methods.5–8 As far as we know, no such studies have been reported for NBr3 and NI3 due to their extreme explosive nature.In recent times, researchers have been mainly working to develop a method for the disposal and detection of these explosives.9,10 For the detection and decay of these explosives, various expensive techniques, such as gas and liquid chromatography11 and spectroscopic techniques have been applied; however, these techniques fail to detect these explosives at low concentrations.12 Moreover, these techniques also require sophisticated sample preparation and skilled persons. The prime requisites for a quality sensor are low cost, fast response, metal-free nature, high selectivity and reproducibility.13,14 Moreover, it should have a high surface to volume ratio over which the analyte can easily and effectively interact.15
A large number of materials such as zeolites,16 metal–organic frameworks,2,3,17,18 metal clusters,19 pristine and boron-doped graphene,20 graphene,21–23 semiconductor nanowires,24 carbon nitride,25 boron nitride,26 aluminum nitride27 and phosphorous carbide sheets,28 have been studied in the past few decades as sensors for detecting trace quantities of these explosives. The major problems still faced by the sensor industries are cost, limited sensitivity, and the lack of reproducibility and sensitivity of the sensor to humidity and temperature.
In this study, we selected the electron-rich nitrogenated holey graphene (C2N) surface as the electrochemical sensor for the detection and capture of nitrogen halide (NCl3, NBr3 and NI3) explosives. In the recent past, several studies have been devoted to predicting the stabilities of yet to be synthesized 2D surfaces. For example, Gueorguiev and coworkers studied the stability of CFx surfaces through first-principles calculations. In another study, the effects of hydrogenation and fluorination in curved 2D carbon surfaces were explored.29,30 The C2N is a 2D material with controlled pore size and periodic geometry. It was recently synthesized by Mahmood et al., via wet chemistry.31 C2N consists of fused rings of benzene and pyrazine, which make it a highly π-conjugated structure. C2N has been used in many fields like batteries,32–34 catalysis,35,36 optical devices,37 gas storage38,39 and photo-catalysis,40 C2N surface with electron-rich nitrogenated cavity has tremendous potential of electrochemical sensor, as reported earlier by Xu et al.41 It has also been studied for physical adsorption of toxic and noble gases like H2S, HF, NH3, HCN, CH4, N2, CO2, He, Ne and Ar.42,43 To the best of our knowledge, the selected C2N surface has not been previously studied as an electrochemical sensor for NX3 explosives. The electron-rich nitrogenated cavity of C2N is thermally stable with a high surface to volume ratio, which provides an ideal environment for the interaction of analytes. Density functional theory (DFT) calculations were executed to investigate the adsorption of NX3 on the C2N surface. The nature of the non-covalent interactions between NX3 and the C2N surface was further explored through Bader's quantum theory of atoms in molecules (QTAIM), non-covalent interactions (NCI), and symmetry adopted perturbation theory (SAPT0) analysis. The electronic properties of NX3@C2N complexes were studied through electronic density differences (EDD), natural bond orbital analysis (NBO) and frontier molecular orbital analysis (FMO).
2. Computational methodology
All DFT calculations for the adsorption of NX3 analytes on C2N surface were executed using the Gaussian 09 software due to its established accuracy and efficacy. For the geometry optimization of analtyes@C2N complexes, the M05-2X/LANL2DZ level of theory was applied, which is the best for studies of non-covalent interactions.44–53 The level of theory chosen was quite adequate for such a complex system. The literature revealed several examples where complex systems were treated with a comparable level of theory.47,50,54–56,58 The non-bonding interactions can play a vital role in deciding the properties of a system and need to be modeled accurately to determine the interactions of NX3 analytes with the C2N surface. Although NI3 exists in the form of the NI3·NH3 adduct, we did not include this adduct in our study because we wanted to have a comparative study of NX3 explosives. This adduct is important only for NI3 but not for other NX3 molecules. The visualization of the geometries and the evaluation of the structural parameters were carried out using the GaussView 5.0![[thin space (1/6-em)]](https://www.rsc.org/images/entities/char_2009.gif) 57,59,60 and Chemcraft software.61 To confirm the optimized geometries as true minima on the potential energy surface, vibrational frequency analysis was performed at the same level of theory.
57,59,60 and Chemcraft software.61 To confirm the optimized geometries as true minima on the potential energy surface, vibrational frequency analysis was performed at the same level of theory.
In search of stable geometries containing the analytes@C2N complex, many different possible orientations of each analyte on the C2N surface were simulated. The adsorption energies of analytes@C2N surface are defined as follows:
| ΔE = [ENX3@C2N − (ENX3 + EC2N)] | (1) |
| Eint.CP = Eint − EBSSE | (2) |
Symmetry adapted perturbation theory (SATP0) analysis was performed with the PSI4 software.51 SAPT0 analysis gives a quantitative idea about the components of energies (induction, dispersion, exchange and electrostatic) involved in non-covalent interactions between NX3 and the C2N surface. The total energy of SAPT0 components is represented as follows:
| ΔEint = ΔEelstat + ΔEexch + ΔEind + ΔEdisp | (3) |
Induction energy (ΔEind) arises due to interactions between filled and partially filled orbitals, while the exchange (ΔEexch) energy part of SAPT0 indicates repulsion between the two fragments of filled orbitals. Similarly, the dispersion energy (ΔEdisp) term represents attractive interactions between filled orbitals where the electrostatic energy (ΔEelst) part arises due to interactions between polarized orbitals of two fragments.
Non-covalent interactions between NX3 and C2N were mapped using Multiwfn 3.7 software.62,63 NCI analysis is described by two factors, i.e., the electron density (ρ) and reduced density gradient (RGD), for understanding the nature of the interactions. The relationship between these factors is represented as follows:
 | (4) |
The sign and the value of the electron density (ρ) is a major descriptor for the characterization of the nature of non-covalent interactions. The plot of RDG versus (λ2)ρ signifies the nature of the interactions. Here, λ2 is the second Eigenvalue of the Hessian matrix, which gives better information for understanding the nature of interactions. The sign (λ2)ρ < 0 represents the accumulations of the electron density (non-covalent interactions), while the sign (λ2)ρ > 0 represents the depletion of the electron density (repulsive interactions). The signs and values of (λ2)ρ are also represented in color-coded form, which are green ((λ2)ρ < 0 to −0.01 a.u.), red ((λ2)ρ > 0) and blue ((λ2)ρ < −0.01 a.u.) to show weak van der Waals, repulsive and H-bonding interactions, respectively.64,65
Non-covalent interactions were further quantified by Bader's quantum theory of atoms in molecules (QTAIM).66,67 The topological parameters of QTAIM analysis used in non-covalent interactions are electron density (ρ), the Laplacian (∇2ρ), −V/G, energy density (H(r)) and Eint (individual bond interactions energy). The non-covalent interactions between interacting systems in QTAIM analysis are usually predicted by the bond critical point.68 Besides the above-mentioned interaction properties, we also studied the charge transfer of NX3@C2N complexes through electron density differences (EDD)69–71 and natural bond orbitals (NBO). EDD analysis was conducted by taking the difference in the electron density of the complex from its constituents (C2N and analyte). Frontier molecular orbital analysis (FMO) was executed to study the changes in the conductivity of the C2N before and after complexation with analytes.
3. Results and discussion
3.1 Geometric optimization and interaction energies
The optimized C2N single-layer structure selected as the electrochemical sensor is presented in Fig. 1, which consists of benzene and pyrazine rings in the fused form. The nitrogen atoms present in the pyrazine ring are arranged periodically in such a way that they form an electron-rich nitrogenated cavity with 8.30 Å diameter.31 The existence of the electron-rich nitrogenated cavity of the C2N surface offers powerful binding and capturing frameworks for shock sensitive agents (NX3).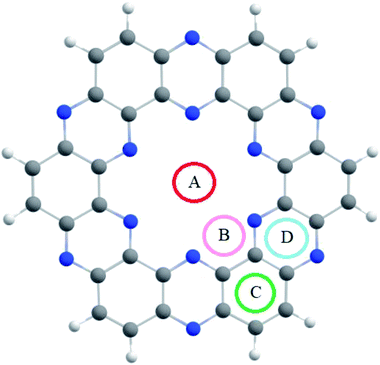 | ||
| Fig. 1 The optimized geometry of the nitrogenated holey graphene (C2N) at the M05-2X/LANL2DZ level of theory. | ||
The binding sites over the C2N structure are represented as A (center of cavity), B (triangle between two nitrogen), C (at top of benzene) and D (at pyrazine rings) (see Fig. 1). To find the stable geometry of the analytes@C2N complexes, all possible orientations of each analyte over the four possible binding sites are tested. The most stable optimized geometries of analytes@C2N are given in Fig. 2, while the rest of the geometries are shown in Fig. S1 (ESI†).
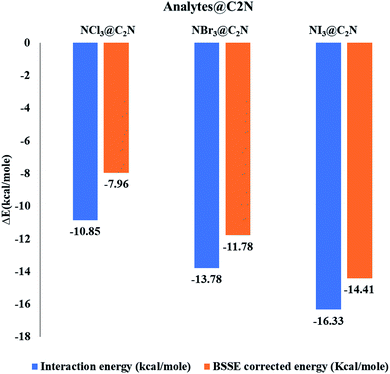
The interaction energies and bond lengths of the studied analytes are given in Table 1 and Fig. 2 (graphical form). The observed interaction energies of the most stable studied NX3@C2N complexes are −10.85 kcal mol−1 (NCl3), −13.78 kcal mol−1 (NBr3) and −16.33 kcal mol−1 (NI3), while other interaction energies are given in Table S1.† Similarly, energies of complexes are also corrected by the basis set superposition error (see Table 1).
| Bond length (Å) | A | Bond length (Å) | B | Bond length (Å) | C | Bond length (Å) | D | Bond length (Å) | Eint (kcal mol−1) | BSSE (kcal mol−1) |
|---|---|---|---|---|---|---|---|---|---|---|
| NCl3@C2N | Cl4⋯N1 | 3.18 | Cl4⋯N2 | 3.00 | Cl4⋯N3 | 3.18 | Cl4⋯X | 1.84 | −10.85 | −7.96 |
| NBr3@C2N | Br4⋯N1 | 3.22 | Br4 ⋯N2 | 3.01 | Br4⋯N3 | 3.18 | Br4⋯X | 1.87 | −13.78 | −11.34 |
| NI3@C2N | I4⋯N1 | 3.25 | I4⋯N2 | 3.01 | I4⋯N3 | 3.24 | I4⋯X | 1.94 | −16.33 | −14.41 |
The analytes studied for sensor studies were nitrogen halides. In most of the complexes, the halogen atoms (Cl, Br, I) of analytes interacted with the N-atoms of the C2N cavity. Such non-covalent interactions where covalently bonded halogens interact with high electronegative atoms are known as halogen bonding. Halogen bonding is an intermolecular force of attraction in which halogen atoms accept electrons from highly electronegative atoms.72 Halogen bonding interactions have been the topic of recent interest in the scientific community because of their potential for use in supramolecular chemistry,73,74 crystal engineering,75,76 molecular recognition,77 rational drug design,78 and catalysis.79 In these interactions, a part of the halogen acts as the electrophile (σ-hole).80 The σ-hole interactions increase as the size and polarizability of the halogen atoms (I > Br > Cl > F) increase.81 This trend of halogen polarizabilities shows that the I-atom should form stronger halogen bonds with Lewis bases (N-atoms). The same trend of halogen bonding was observed in our studied complexes (vide infra).
The stable conformation of NCl3@C2N resulted in the adsorption energy of −10.85 kcal mol−1 (BSSE = −7.96 kcal mol−1). The optimized geometry of the stable NCl3@C2N complex revealed that one of the Cl atom of NCl3 was projected towards the center of the C2N cavity (site A) with the interaction distance of 1.84 Å, while the other two Cl atoms moved upwards. The Cl atom of NCl3 and N-atoms (site B) of the C2N surface interacted through a longer bond distance as compared to site A (see Table 1). However, halogen bonding between the Cl atom of NCl3 and N-atoms of the C2N produced a stable optimized geometry of the complex.
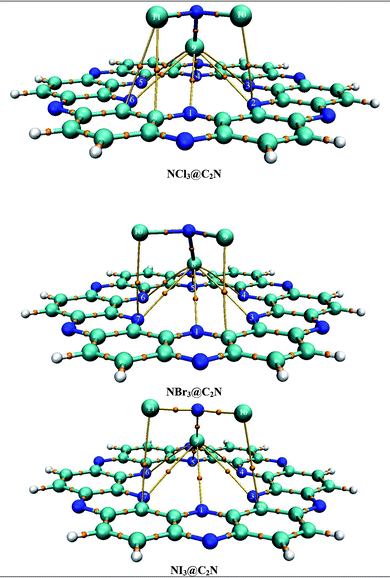
The same strategy was adopted for the NBr3@C2N complex (as with the NCl3@C2N complex) to obtain a stable geometry. The stable NBr3@C2N complex had an interaction energy of −13.78 kcal mol−1 (BSSE = −11.78 kcal mol−1). The interaction energy of NBr3@C2N was greater than that of the NCl3@C2N complex. The orientation of NBr3 over C2N in the stable conformation was similar to that of the NCl3@C2N complex (Fig. 3). The Br-atom of NBr3 interacts at site A of the C2N cavity through an interaction distance of 1.87 Å. The interaction distances were in the range of 3.01 to 3.22 Å, through which the other Br-atoms of NBr3 interact with the N-atoms of the C2N surface.
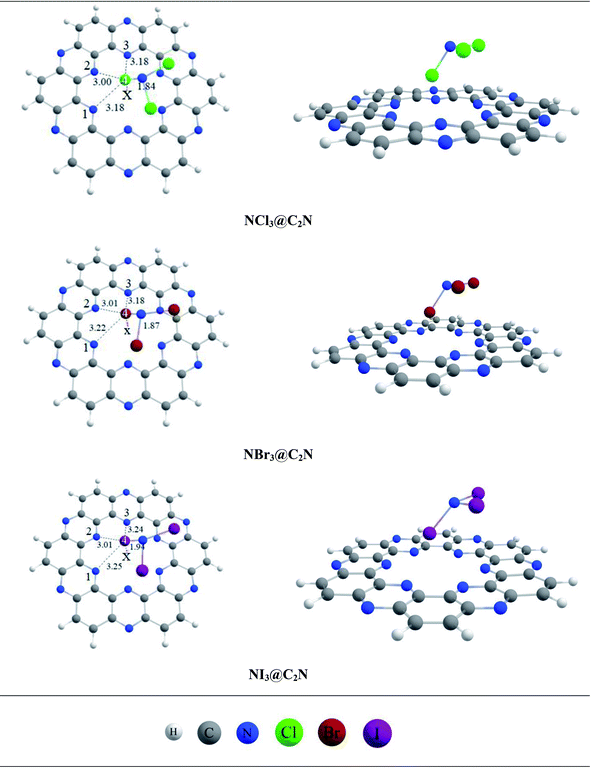 | ||
| Fig. 3 The top and side views of the optimized geometries of analytes@C2N at the M05-2X/LANL2DZ level of theory. | ||
The stable optimized geometry of the NI3@C2N complex (Eint = −16.31 kcal mol−1; BSSE = −14.41 kcal mol−1) had the same orientation as the other two NX3@C2N complexes. The I-atom of NI3 interacted at site A of the C2N cavity at the interaction distance of 1.94 Å. The optimized geometry of the NI3@C2N complex revealed that the I-atom of NI3 interacted with the N-atoms of C2N with interaction distances ranging from 3.01 Å to 3.25 Å.
The results of all complexes showed that the X-atoms (halogens) acted as electrophiles (σ-hole) in non-covalent interactions with the electron-rich nitrogenated cavity of C2N. The interaction energy results of the NX3@C2N complexes supported the existence of the physisorption mechanism. The interaction energy trend observed for the NX3@C2N complexes was NCl3@C2N > NBr3@C2N > NI3@C2N. The interaction energy results indicate that C2N can accommodate NX3 analytes on its surface, but the highest interaction energy was seen for the NI3@C2N complexes (−16.31 kcal mol−1). The I-atoms of NI3 interacted through longer bond distances with the C2N surface as compared to the NBr3 and NCl3. The possible reason for the high interaction energy for the NI3@C2N complex was the stronger halogen bonding between the I-atoms of NI3 and N-atoms of C2N.
3.2 Non-covalent interaction (NCI) analysis
NCI analysis was carried out to understand the nature of the intermolecular interactions. The NCI analysis consists of 3D isosurfaces and 2D reduced density gradient (RDG) graphs of the complexes. The 2D-RDG graph and 3D isosurfaces of the NCI analysis for the NX3@C2N complexes are presented in Fig. 4. The 3D isosurfaces of all the analytes showed the presence of green patches between the surface of C2N and the analytes. Similarly, the red patch projection was also seen in the benzene and pyrazine ring of the C2N cavity. For NCl3@C2N, the 3D isosurface showed the presence of weak dispersive interactions between the Cl atoms of NCl3 and N&C-atoms of the C2N surface; this can be seen in the 2D-RGD graph. The projection of green spikes appeared between 0 to −0.01 a.u. at the (λ2)ρ axis, which confirmed the existence of the non-covalent dispersive interactions in the NCl3@C2N complex. The higher density of green patches was observed in the NBr3@C2N complex as compared to that of the NCl3@C2N complex.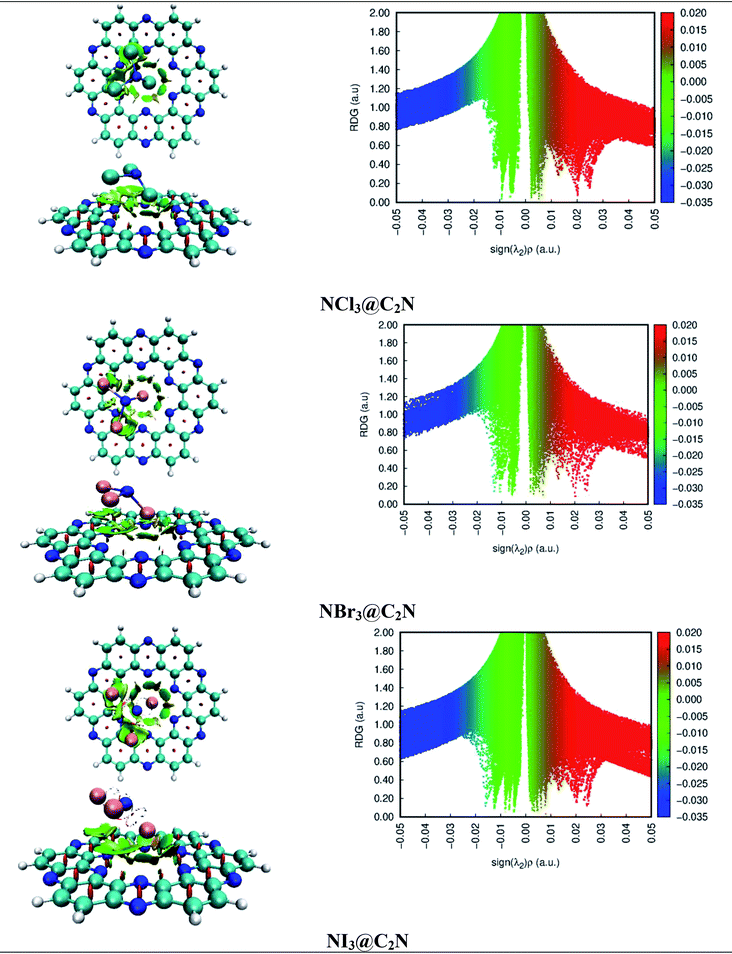 | ||
| Fig. 4 NCI isosurfaces and 2D-RDG graphs of the optimized geometries of stable complexes obtained via the M05-2X method (iso value = 0.05 a.u.). | ||
The shattered spikes of the 2D-RGD graph of the NBr3@C2N complex also appeared at −0.01 a.u. of (λ2)ρ at the X-axis, which illustrated the stronger forces of interactions between the Br-atoms of NBr3 and the N & C-atoms of C2N as compared to that of NCl3@C2N complex (see Fig. 4). Among the NX3@C2N analytes, NI3 exhibited the strongest interaction with the C2N surface, which was confirmed by the thick and wide green patches seen in the 3D isosurface, and the projection of spikes between 0.01 to −0.02 a.u. at the X-axis of (λ2)ρ. The results of NCI analysis are consistent with those of the interaction energy of the NX3@C2N complexes.
3.3 SAPT0 analysis
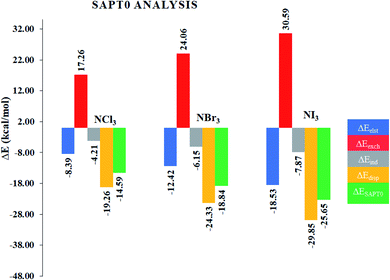
Although NCI analysis indicates the presence of attractive and repulsive interactions between the components of a system, it would be better to understand the quantitative nature of the interactions in the studied complexes. In this regard, SAPT0 analysis was performed using the PSI4 software. The SAPT0 energy was divided into four terms, i.e., Edisp, Eexch, Eelst and Eind. The results of the SAPT0 analysis are given in Table 2, whereas the graphical representation is given in Fig. 5. The SAPT0 values vary in each case, which indicates the different modes of interactions in the NX3@C2N complexes. The SAPT0 values observed for the NX3@C2N analytes were −14.59 kcal mol−1 (NCl3@C2N), −18.84 kcal mol−1 (NBr3@C2N) and −25.65 kcal mol−1 (NI3@C2N), respectively. The results of the SAPT0 energy components are consistent with the interaction energy results. The components of the SAPT0 energy for NCl3@C2N were −8.39 kcal mol−1 (Eelst), −4.21 kcal mol−1 (Eind) and −19.26 kcal mol−1 (Edisp). These results indicate that the dispersion (60.47%) was the major stabilizing factor, whereas electrostatic (26.33%), and induction (13.20%) were less prominent in the total interaction energy.| ΔEelst (%) | ΔEexch | ΔEind (%) | ΔEdisp (%) | ΔESAPT0 | |
|---|---|---|---|---|---|
| NCl3@C2N | −8.39 (26.33) | 17.26 | −4.21 (13.20) | −19.26 (60.47) | −14.59 |
| NBr3@C2N | −12.42 (28.95) | 24.06 | −6.15 (14.34) | −24.33 (56.70) | −18.84 |
| NI3@C2N | −18.53 (32.94) | 30.59 | −7.87 (13.98) | −29.85 (53.08) | −25.65 |
In the case of the NBr3@C2N complex, the contributions of each component of energy towards total SAPT0 were −12.42 kcal mol−1 (Eelst), −6.15 kcal mol−1 (Eind) and −24.33 kcal mol−1 (Edisp). The trend of SAPT0 components (Edisp > Eelest > Eind) of NBr3@C2N is comparable to that of NCl3@C2N, where Edisp (56.70%) is dominant. The Edisp component in NBr3@C2N was less significant as compared to Edisp (60.47%) of the NCl3@C2N complex. Similarly, the increase in the Eind (14.34%) and Eelst (28.95%) terms was noticed in the NBr3@C2N complex. Among the studied NX3@C2N complexes, the highest SAPT0 energy (−25.65 kcal mol−1) was observed for the NI3@C2N complex due to the stronger σ-hole interactions (halogen bonding) between the I-atoms of NI3 and the N-atoms of the C2N surface. The results (Table 2) revealed that the large contribution toward the total SAPT0 for the NI3@C2N complex was from Edisp (53.08%), quite similar to the NCl3@C2N and NBr3@C2N complexes. The contribution from Eelst (23.94%) and Eind (13.98%) remained appreciable.
In the overall interactive components, the largest stabilizing factor remained Edisp (56.75%), whereas a moderate contribution was observed from Eelst (29.41%) and Eind (14.34%), respectively. The trend of SAPT0 energy observed in the case of the NX3@C2N complexes is consistent with Eint, and NCI analysis.
3.4 Quantum theory of atoms in molecules (QTAIM) theory
Quantum theory of the atoms in molecules (QTAIM) analysis is well-known because of its ability to describe various intra- and intermolecular interactions (H-bonding, ionic bonding, van der Waals interactions). Many topological parameters such as electron density (ρ), the Laplacian (∇2ρ), and total electron energy density (H(r)) are used at the bond critical point to quantify and understand the nature of the interactions.The strength of a bond is measured by the electron density ρ value at BCPs, whereas the nature of interactions is characterized by the Laplacian (∇2ρ), potential energy density V(r), kinetic energy density G(r), and total electron energy density H(r). For shared shell interactions (such as covalent bonds), the electron density is greater than 0.1 a.u., while the Laplacian (∇2ρ) remains always large and negative. For closed interactions, (van der Waals, ionic and H-bonding), ρ lies in the range of 0.002–0.034 a.u. and the Laplacian (∇2ρ) is in the range of 0.024–0.139 a.u. Through the Espinosa approach of individual bond interaction energy, non-covalent interactions, particularly H-boding (3 to 10 kcal mol−1), can be better understood through eqn (5).82–86
 | (5) |
BCPs of closed and shared shells can also be explained by the following equations:
 | (6) |
| H(r) = G(r) + V(r) | (7) |
The observed numbers of BCPs in NX3@C2N complexes were 9 (NCl3@C2N), 8 (NBr3@C2N) and 8 (NI3@C2N) through QTAIM analysis. The evaluated ρ(r) and ∇2ρ(r) values of intermolecular BCPs were positive for all NX3@C2N complexes, which indicated the presence of non-covalent interactions (see Table S2†). In addition to this, the −V(r)/G(r) ratio was <1 and it ranged from 0.74 to 0.84, which confirmed the existence of weak non-covalent interactions. The value of ρ(r) and ∇2ρ(r) at BCPs also quantified the nature of the interactions. The ρ(r) of the various intermolecular interactions in the NX3@C2N complexes ranged from 0.005 to 0.013, while ∇2ρ(r) was from 0.009 to 0.057.
The observed ρ(r) and ∇2ρ(r) were the highest for the NI3@C2N complex due to the stronger halogen bonding between the I-atoms of NI3 and the N-atoms of C2N. The smallest values of ρ(r) and ∇2ρ(r) at BCPs were observed for the NCl3@C2N complex due to weak halogen bonding between the Cl-atoms of NCl3 and the N-atoms of C2N. The ρ(r) and ∇2ρ(r) values for the NBr3@C2N complex remained intermediate between NCl3@C2N and NI3@C2N. In addition to X–N (X = Cl, Br, I) interactions between the analyte and C2N, other weak interactions among the X-atoms of the analytes and the C-atoms of the C2N surface were also seen (see Fig. 6). The X-atoms of analytes pointing towards the surface acted as electrophiles and developed non-covalent interactions with the highly electronegative N-atoms. The rest of the X-atoms away from the surface acted as nucleophiles and produced weak van der Waals interactions with the C-atoms of the C2N surface (vide infra). Therefore, the trend established in the studied analytes@C2N complexes according to the topological parameters was NI3@C2N > NBr3@C2N and NCl3@C2N complexes.
The results of the individual bond interactions of the NX3@C2N complexes were between −0.59 and −3.19 kcal mol−1. The highest individual bond interactions were seen for the NI3@C2N complex. The other parameters (H(r), −V(r)/G(r)) were also in accordance with the ρ(r) and ∇2ρ(r) of the studied BCPs. This was due to the low individual bond interaction energy and longer interaction distance (1.8 Å) between interacting systems. The trend of individual bond interactions was also comparable to the rest of the topological parameters and consistent with the interaction energy results, NCI and SAPT0 analysis.
4. Electronic properties
4.1 Electron density differences analysis
We calculated the three-dimensional electron density differences and evaluated the charge transfer between analytes (NX3) and the C2N surface. The isosurfaces obtained by electron density differences are given in Fig. 7. The isosurface of NX3@C2N consists of green and purple shades to represent the depletion and accumulation of charge densities, respectively. It is worth mentioning that the accumulation of charge density takes place where the atoms of analytes interact with the C2N surface of C2N (see Fig. 7), this shows the existence of van der Waals interactions between the atoms of NX3 and the C2N surface.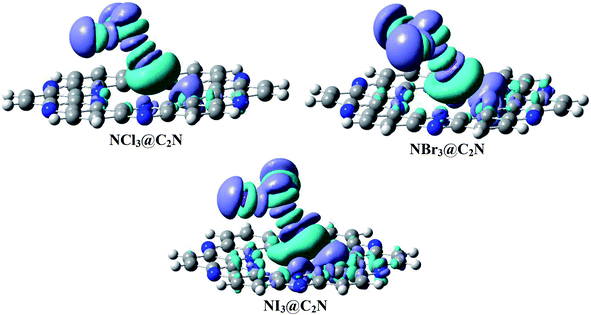 | ||
| Fig. 7 Electron density difference plots of analytes@C2N (iso value = 0.004 a.u.). Purple represents the accumulation of electron density, while green surfaces show the depletion of electron density. | ||
The electron density differences (Fig. 7) clearly indicate that the flow of electron was from the C2N surface to analytes, as revealed by the appearance of green surfaces on the X-atoms (Cl, Br and I) of analytes and the purple surfaces on the N-atoms of C2N. The charge transfer from C2N to the X-atoms of analytes is due to halogen bonding. The EDD results in Fig. 7 also indicate that the X-atom of NX3 oriented toward the C2N surface shows the electrophilic character (σ-hole) due to the formation of green surfaces. The X-atoms of analytes projected away from the C2N surface show nucleophilic character due to the formation of purple surfaces. The maximum accumulation of densities was seen between the Br-atoms of NBr3 and the N-atoms of C2N, which is consistent with the results of NBO analysis.
4.2 Natural bond orbital analysis
Charge analysis provides valuable information about the amount of charge transfer between the studied systems. During the interaction of NX3 with the C2N surface, the analytes take the negative charge and deliver positive charge to the C2N surface (Table 3). The charges transferred from the C2N surface to the analytes were −0.001e− (NCl3), −0.006e− (NBr3) and −0.004e− (NI3). Surprisingly, the charge analysis results show that NBr3 extracted a relatively higher amount of charge (−0.006e−) from the C2N surface as compared to NCl3 (−0.001e−) and NI3 (−0.004e−). This finding of charge analysis in the case of the NBr3@C2N complex is somewhat contradictory to the interaction energy results. In the case of the NI3@C2N complex, the higher interaction energy resulted from the strong halogen bonding of highly polarizable I-atoms of NI3 with the N and C atoms of the C2N surface (vide supra). The charge extracted by NI3 from C2N was slightly lower than NBr3 due to the greater interaction distance in the former (from the C2N surface). The lowest charge transfer was observed in the case of NCl3 (−0.001e−) due to its weak halogen bonding. The halogen bonding increased in the order of F < Cl < Br < I due to σ-hole character. The NBO charge analysis values of NCl3 were consistent with their low interaction energy results.| Analytes | HOMO (eV) | LUMO (eV) | EH–L gap (eV) | NBO (e−) on analytes |
|---|---|---|---|---|
| C2N | −8.06 | −2.35 | 5.71 | — |
| NCl3@C2N | −8.12 | −2.54 | 5.58 | −0.001 |
| NBr3@C2N | −7.98 | −2.69 | 5.29 | −0.006 |
| NI3@C2N | −6.86 | −2.71 | 4.15 | −0.004 |
4.3 Frontier molecular orbital (FMO) analysis
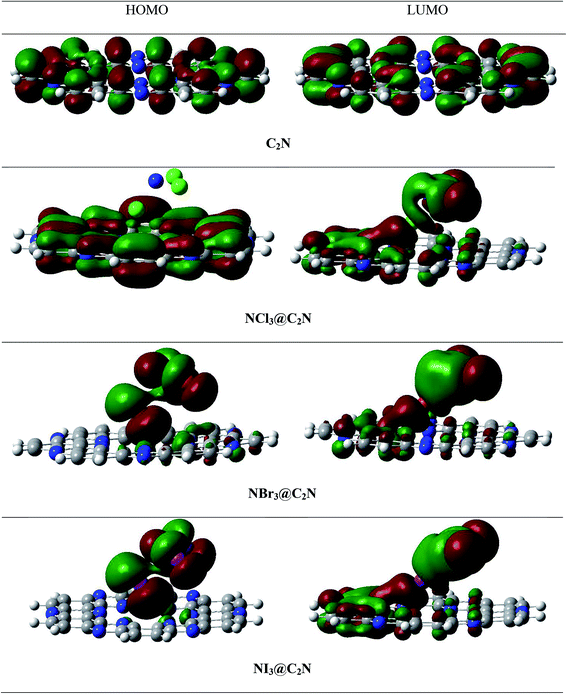
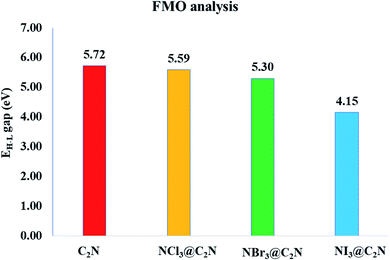
To better understand electronic changes caused by the interaction of analytes on the C2N surface, FMOs were analyzed before and after the complexation of analytes (NX3) over the C2N surface. Energies of the highest occupied molecular orbitals (EHOMO), lowest unoccupied molecular orbital (ELUMO) and EH–L gap for NX3@C2N complexes are given in Table 3, and their orbital densities are given in Fig. 8. The EHOMO and ELUMO of the bare C2N surface were −8.06 eV and −2.35 eV, which resulted in a 5.71 eV EH–L gap. The orbital density in the HOMO was distributed on the entire C2N surface, while the density of LUMO was located mostly on the nitrogen atoms of the C2N surface.The interaction of analytes (NX3) over the C2N surface not only causes changes in the EHOMO and ELUMO but also in their orbital densities. The EH–L gaps observed upon the interaction of the analytes@C2N surfaces were 5.58 eV (NCl3@C2N), 5.29 eV (NBr3@C2N) and 4.15 eV (NI3@C2N). For NCl3@C2N, EHOMO and ELUMO were −8.12 eV and −2.54 eV, respectively, which showed that the energies of both HOMO and LUMO were affected by complexation. The energies of the HOMO and LUMO slightly decreased with the adsorption of NCl3 on the C2N surface. However, the effect was more pronounced on the LUMO, which resulted in the decrease in the EH–L gap to 5.58 eV.
A significant decrease in the EH–L gap (5.29 eV) was observed in the NBr3@C2N complex. Table 3 shows that the adsorption of NBr3 on C2N caused the energy of the HOMO to increase from (−8.06 eV to −7.98 eV) but the energy of the LUMO decreased from −2.35 to −2.69 eV), which resulted in a relatively small EH–L gap (5.29 eV). Among the studied NX3@C2N complexes, the highest decrease in the EH–L gap (4.15 eV) was observed for the NI3@C2N complex. The substantial increase in the energy of the HOMO (−6.86 eV) and the decrease in the energy of the LUMO (−2.71 eV) resulted in the lowering of the EH–L gap. The results of the FMO analysis revealed that the complexation of NI3 over the C2N surface increased the conductivity of C2N due to the highest decreases in the EH–L gap of C2N (4.15 eV) as compared to other analytes. These results also showed the strong sensitivity and selectivity of the C2N surface towards NI3 as compared to the rest of the analytes. FMO analysis revealed that the adsorption of analytes produced a more pronounced effect on the HOMO energies as compared to the LUMO, which led to the greatest decrease in the EH–L gap.
The orbital plots showed significant changes in the HOMO and LUMO densities with the adsorption of analytes over the C2N surface. The HOMO–LUMO density analysis of the NCl3@C2N complex showed that the HOMO density was completely concentrated over the C2N surface, while the LUMO density was distributed on NCl3 as well as on half of the C2N. In the case of the NBr3@C2N complex, the distribution pattern of the HOMO densities was different from the NCl3@C2N complex, however, the LUMO distribution pattern was similar to the NCl3@C2N complex. The HOMO density was mainly contributed by NBr3 with a small contribution from the N-atoms of the C2N surface. In the NI3@C2N complex, the pattern of orbital density distribution is comparable to the NBr3@C2N complex, where the HOMO density is located on the analytes, whereas LUMO was distributed between the analytes and the C2N surface (see Fig. 8). The EH–L gap is presented in graphical form in Fig. 9.
FMO analysis revealed that the decrease in the EH–L gap was observed when the electronic transition occurred from the analyte to the C2N surface, which was evident in the case of the NI3@C2N complex. These findings clearly indicate that the shift in the electronic density is very important for the electrochemical identification of analytes over the C2N surface. These results indicate that the C2N sensor response is more toward NI3 as compared to the rest of the studied analytes. The FMO results are in strong agreement with the NCI and SAPT0, QTAIM and interaction energy results.
5. Conclusion
The adsorption of the NX3 analytes (NCl3, NBr3 and NI3) over the C2N surface was investigated by using DFT calculations at the M05-2X/LANL2DZ level of theory. For a thorough understanding of the NX3@C2N complexes, adsorption energy, NCI, QTAIM, SAPT0, NBO, EDD and FMO analyses were performed. The interaction energies of the NX3@C2N complexes were in the range of −10.85 to −16.31 kcal mol−1. These results demonstrate that the physisorption phenomena were represented for the adsorption of analytes on the C2N surface. The interaction energy trends observed for NX3@C2N complexes are NCl3@C2N > NBr3@C2N > NI3@C2N, respectively. The stable geometries of the analytes@C2N complexes were mainly obtained by the interaction of the X-atoms (Cl, Br, I) of the analytes with the C2N surface.The 3D isosurfaces and 2D-RGD graph of the NCI analysis also confirmed the existence of halogen bonding interactions among the studied systems. The halogen bonding was also quantified by SAPT0 component energy analysis. The SAPT0 results revealed that dispersion was the most prominent contributor to SAPT0 energy, whereas lower contributions were observed from ΔEelst (29.41%) and ΔEind (14.34%). The topological parameters ((ρ(r) and ∇2ρ(r)) of QTAIM analysis also confirmed the presence of halogen bonding between the X-atoms of NX3 and C2N. NBO analysis showed that in all cases, the transfer of charge happened from C2N to the analytes. A significant amount of charge was received by NBr3 (−0.006e−) and NI3 (0.004e−). EDD analysis also validated the NCI, QTAIM and NBO analyses. FMO analysis revealed that the adsorption of NI3 on the C2N surface caused significant changes in the EHOMO–LUMO gap (from 5.71 to 4.15 eV) as compared to bare C2N units, which showed the strong sensitivity and selectivity of the C2N surface towards NI3 as compared to the rest of the analytes. The complexes of NCl3@C2N (5.58 eV) and NBr3@C2N (5.25 eV) failed to bring significant changes in the EHOMO–LUMO energy gaps and were less selective by the C2N surface. It is worth mentioning that in all complexes, a significant difference in the EHOMO–LUMO gap was seen when charge transfer happened from the analyte to the C2N surface.
Conflicts of interest
The authors declare that they have no known competing financial interests or personal relationships that could have appeared to influence the work reported in this paper.References
- R. Matyáš and J. Pachman, Nitrogen Halides, in Prim. Explos., Springer Berlin Heidelberg, Berlin, Heidelberg, 2013, pp. 289–302, DOI:10.1007/978-3-642-28436-6_11.
- I. Tornieporth-Oetting and T. Klapötke, Nitrogen Triiodide, Angew. Chem., Int. Ed. Engl., 1990, 29, 677–679, DOI:10.1002/anie.199006771.
- W. A. Noyes, The interaction between nitrogen trichloride and nitric oxide. reactions of compounds with odd electrons 1, J. Am. Chem. Soc., 1928, 50, 2902–2910, DOI:10.1021/ja01398a007.
- H. Galal-Gorchev and J. C. Morris, Formation and Stability of Bromamide, Bromimide, and Nitrogen Tribromide in Aqueous Solution, Inorg. Chem., 1965, 4, 899–905, DOI:10.1021/ic50028a029.
- K. Maka and G. W. Norval, Optimising chlorine compression design with vapour phase nitrogen trichloride destruction, Can. J. Chem. Eng., 2013, 91, 718–724, DOI:10.1002/cjce.21755.
- F. Gérardin, A. Cloteaux, M. Guillemot, M. Faure and J. C. André, Photocatalytic Conversion of Gaseous Nitrogen Trichloride into Available Chlorine—Experimental and Modeling Study, Environ. Sci. Technol., 2013, 47, 4628–4635, DOI:10.1021/es400588m.
- K. Okada, M. Akiyoshi, K. Ishizaki, H. Sato and T. Matsunaga, Analysis of an explosion accident of nitrogen trichloride in a waste liquid containing ammonium ion and platinum black, J. Hazard. Mater., 2014, 278, 75–81, DOI:10.1016/j.jhazmat.2014.05.077.
- T.-H. Nguyen, E. Chevallier, J. Garcia, T.-D. Nguyen, A.-M. Laurent, C. Beaubestre, P. Karpe and T.-H. Tran-Thi, Innovative colorimetric sensors for the detection of nitrogen trichloride at ppb level in swimming pools, Sens. Actuators, B, 2013, 187, 622–629, DOI:10.1016/j.snb.2013.07.041.
- M. D. Ganji, M. Tajbakhsh and M. Laffafchy, Nerve agents interacting with single wall carbon nanotubes: Density functional calculations, Solid State Sci., 2010, 12, 1547–1553, DOI:10.1016/j.solidstatesciences.2010.06.019.
- M. C. Horrillo, J. Martí, D. Matatagui, J. P. Santos, I. Sayago, J. Gutiérrez, I. Martin-Fernandez, P. Ivanov, I. Gràcia and C. Cané, Single-walled carbon nanotube microsensors for nerve agent simulant detection, Sens. Actuators, B, 2011, 157, 253–259, DOI:10.1016/j.snb.2011.03.059.
- J. Sherma and G. Zweig, Pesticides, Anal. Chem., 1985, 57, 1–15, DOI:10.1021/ac00282a001.
- X. Ji, J. Zheng, J. Xu, V. K. Rastogi, T.-C. Cheng, J. J. DeFrank and R. M. Leblanc, (CdSe)ZnS Quantum Dots and Organophosphorus Hydrolase Bioconjugate as Biosensors for Detection of Paraoxon, J. Phys. Chem. B, 2005, 109, 3793–3799, DOI:10.1021/jp044928f.
- R. A. Potyrailo, Polymeric Sensor Materials: Toward an Alliance of Combinatorial and Rational Design Tools, Angew. Chem., Int. Ed., 2006, 45, 702–723, DOI:10.1002/anie.200500828.
- G. Korotcenkov, Metal oxides for solid-state gas sensors: what determines our choice, Mater. Sci. Eng., B, 2007, 139, 1–23, DOI:10.1016/j.mseb.2007.01.044.
- H. R. Sahoo, J. G. Kralj and K. F. Jensen, Multistep Continuous-Flow Microchemical Synthesis Involving Multiple Reactions and Separations, Angew. Chem., Int. Ed., 2007, 46, 5704–5708, DOI:10.1002/anie.200701434.
- G. Lu and J. T. Hupp, Metal–Organic Frameworks as Sensors: A ZIF-8 Based Fabry–Pérot Device as a Selective Sensor for Chemical Vapors and Gases, J. Am. Chem. Soc., 2010, 132, 7832–7833, DOI:10.1021/ja101415b.
- X. Zhou, Z. Su, H. Chen, X. Xiao, Y. Qin, L. Yang, Z. Yan and W. Sun, Capture of pure toxic gases through porous materials from molecular simulations, Mol. Phys., 2018, 116, 2095–2107, DOI:10.1080/00268976.2018.1440019.
- J.-R. Li, R. J. Kuppler and H.-C. Zhou, Selective gas adsorption and separation in metal–organic frameworks, Chem. Soc. Rev., 2009, 38, 1477, 10.1039/b802426j.
- J. Yuan, G. Li, B. Yang, J. Zhang, Z. Li and H. Chen, Selective adsorption of ethylene on bimetallic CuVn+/0 (n = 1-5) clusters: a theoretical study, Comput. Mater. Sci., 2016, 111, 489–496, DOI:10.1016/j.commatsci.2015.09.064.
- V. A. Online, Long range corrected-wPBE based analysis of the H2O adsorption on magnetic BC 3 nanosheets, RSC Adv., 2016, 20409–20421, 10.1039/C5RA27231A.
- D. G. Sangiovanni, G. K. Gueorguiev and A. Kakanakova-Georgieva, Ab initio molecular dynamics of atomic-scale surface reactions: Insights into metal organic chemical vapor deposition of AlN on graphene, Phys. Chem. Chem. Phys., 2018, 20, 17751–17761, 10.1039/c8cp02786b.
- E. C. Anota, A. R. Juárez, M. Castro and H. H. Cocoletzi, A density functional theory analysis for the adsorption of the amine group on graphene and boron nitride nanosheets, J. Mol. Model., 2013, 321–328, DOI:10.1007/s00894-012-1539-4.
- P. Limon, A. Miralrio and M. Castro, Adsorption and dissociation of carbon monoxide on iron and iron-carbon clusters: Fen + 2CO and FenC + 2CO, n = 4 and 7. A theoretical study, Comput. Theor. Chem., 2018, 1129, 37–47, DOI:10.1016/j.comptc.2018.02.018.
- R. H. Baughman, Carbon Nanotubes–the Route Toward Applications, Science, 2002, 297, 787–792, DOI:10.1126/science.1060928.
- E. Broitman, G. K. Gueorguiev, A. Furlan, N. T. Son, A. J. Gellman, S. Stafström and L. Hultman, Water adsorption on fullerene-like carbon nitride overcoats, Thin Solid Films, 2008, 517, 1106–1110, DOI:10.1016/j.tsf.2008.07.022.
- Z.-Y. Deng, J.-M. Zhang and K.-W. Xu, Adsorption of SO2 molecule on doped (8, 0) boron nitride nanotube: a first-principles study, Physica E Low Dimens. Syst. Nanostruct., 2016, 76, 47–51, DOI:10.1016/j.physe.2015.09.031.
- Z. Rostami and H. Soleymanabadi, Investigation of phosgene adsorption behavior on aluminum nitride nanocones: density functional study, J. Mol. Liq., 2017, 248, 473–478, DOI:10.1016/j.molliq.2017.09.126.
- E. Broitman, A. Furlan, G. K. Gueorguiev, Z. Czigány, A. M. Tarditi, A. J. Gellman, S. Stafström and L. Hultman, Water adsorption on phosphorous-carbide thin films, Surf. Coat. Technol., 2009, 204, 1035–1039, DOI:10.1016/j.surfcoat.2009.06.003.
- C. Goyenola, S. Stafström, S. Schmidt, L. Hultman and G. K. Gueorguiev, Carbon Fluoride, CFx: Structural Diversity as Predicted by First Principles, J. Phys. Chem. C, 2014, 118, 6514–6521, DOI:10.1021/jp500653c.
- R. B. dos Santos, R. Rivelino, F. de B. Mota and G. K. Gueorguiev, Exploring Hydrogenation and Fluorination in Curved 2D Carbon Systems: A Density Functional Theory Study on Corannulene, J. Phys. Chem. A, 2012, 116, 9080–9087, DOI:10.1021/jp3049636.
- J. Mahmood, E. K. Lee, M. Jung, D. Shin, I.-Y. Jeon, S.-M. Jung, H.-J. Choi, J.-M. Seo, S.-Y. Bae, S.-D. Sohn, N. Park, J. H. Oh, H.-J. Shin and J.-B. Baek, Nitrogenated holey two-dimensional structures, Nat. Commun., 2015, 6, 6486, DOI:10.1038/ncomms7486.
- T. Hussain, D. J. Searles and M. Hankel, Insights into the trapping mechanism of light metals on C2N-h2D: utilisation as an anode material for metal ion batteries, Carbon, 2020, 160, 125–132, DOI:10.1016/j.carbon.2019.12.063.
- J. Xu, J. Mahmood, Y. Dou, S. Dou, F. Li, L. Dai and J.-B. Baek, 2D Frameworks of C2N and C3N as New Anode Materials for Lithium-Ion Batteries, Adv. Mater., 2017, 29, 1702007, DOI:10.1002/adma.201702007.
- Q. Zhang, Y. Wang, Z. W. Seh, Z. Fu, R. Zhang and Y. Cui, Understanding the Anchoring Effect of Two-Dimensional Layered Materials for Lithium–Sulfur Batteries, Nano Lett., 2015, 15, 3780–3786, DOI:10.1021/acs.nanolett.5b00367.
- Z. Guan, C.-S. Lian, S. Hu, S. Ni, J. Li and W. Duan, Tunable Structural, Electronic Properties of Layered Two-Dimensional C2N and MoS2 van der Waals Heterostructure as Photovoltaic Material, J. Phys. Chem. C, 2017, 121, 3654–3660, DOI:10.1021/acs.jpcc.6b12681.
- X. Li, W. Zhong, P. Cui, J. Li and J. Jiang, Design of Efficient Catalysts with Double Transition Metal Atoms on C2N Layer, J. Phys. Chem. Lett., 2016, 7, 1750–1755, DOI:10.1021/acs.jpclett.6b00096.
- S. E. Tsoeu, F. Opoku and P. P. Govender, Tuning the electronic, optical and structural properties of GaS/C2N van der Waals heterostructure for photovoltaic application: first-principle calculations, SN Appl. Sci., 2020, 2, 341, DOI:10.1007/s42452-020-2091-y.
- K. Bhattacharyya, S. M. Pratik and A. Datta, Controlled Pore Sizes in Monolayer C N act as Ultrasensitive Probes for Detection of Gaseous Pollutants ( HF, HCN and H S) Controlled Pore Sizes in Monolayer C2N act as Ultrasensitive Probes for Detection of Gaseous Pollutants (HF, HCN and H2S)K, J. Phys. Chem. C, 2018, 122, 2248–2258, DOI:10.1021/acs.jpcc.7b11963.
- Y. Su, Z. Ao, Y. Ji, G. Li and T. An, Adsorption mechanisms of different volatile organic compounds onto pristine C2N and Al-doped C2N monolayer: a DFT investigation, Appl. Surf. Sci., 2018, 450, 484–491, DOI:10.1016/j.apsusc.2018.04.157.
- C. Li, Y. Xu, W. Sheng, W.-J. Yin, G.-Z. Nie and Z. Ao, A promising blue phosphorene/C2N van der Waals type-II heterojunction as a solar photocatalyst: a first-principles study, Phys. Chem. Chem. Phys., 2020, 22, 615–623, 10.1039/C9CP05667J.
- B. Xu, H. Xiang, Q. Wei, J. Q. Liu, Y. D. Xia, J. Yin and Z. G. Liu, Two-dimensional graphene-like C2N: an experimentally available porous membrane for hydrogen purification, Phys. Chem. Chem. Phys., 2015, 17, 15115–15118, 10.1039/C5CP01789K.
- M. Yar, M. A. Hashmi and K. Ayub, Nitrogenated holey graphene (C2N) surface as highly selective electrochemical sensor for ammonia, J. Mol. Liq., 2019, 111929, DOI:10.1016/j.molliq.2019.111929.
- K. Bhattacharyya, S. M. Pratik and A. Datta, Controlled Pore Sizes in Monolayer C2N Act as Ultrasensitive Probes for Detection of Gaseous Pollutants (HF, HCN, and H2S), J. Phys. Chem. C, 2018, 122, 2248–2258, DOI:10.1021/acs.jpcc.7b11963.
- M. Yar and K. Ayub, Expanding the horizons of covalent organic frameworks to electrochemical sensors; a case study of CTF-FUM, Microporous Mesoporous Mater., 2020, 300, 110146, DOI:10.1016/j.micromeso.2020.110146.
- H. Sajid, K. Ayub and T. Mahmood, Exceptionally high NLO response and deep ultraviolet transparency of superalkali doped macrocyclic oligofuran rings, New J. Chem., 2020, 44, 2609–2618, 10.1039/c9nj05065e.
- F. Wasim, T. Mahmood and K. Ayub, An accurate cost effective DFT approach to study the sensing behaviour of polypyrrole towards nitrate ions in gas and aqueous phases, Phys. Chem. Chem. Phys., 2016, 18, 19236–19247, 10.1039/c6cp02271e.
- H. Sajid, T. Mahmood and K. Ayub, An accurate comparative theoretical study of the interaction of furan, pyrrole, and thiophene with various gaseous analytes, J. Mol. Model., 2017, 23, 1–18, DOI:10.1007/s00894-017-3458-x.
- K. Ayub, Transportation of hydrogen atom and molecule through X12Y12 nano-cages, Int. J. Hydrogen Energy, 2017, 42, 11439–11451, DOI:10.1016/j.ijhydene.2017.02.202.
- S. Munsif and K. Ayub, Permeability and storage ability of inorganic X12Y12 fullerenes for lithium atom and ion, Chem. Phys. Lett., 2018, 698, 51–59, DOI:10.1016/j.cplett.2018.02.065.
- H. Sajid, K. Ayub, M. Arshad and T. Mahmood, Highly selective acridinium based cyanine dyes for the detection of DNA base pairs (adenine, cytosine, guanine and thymine), Comput. Theor. Chem., 2019, 1163, 112509, DOI:10.1016/j.comptc.2019.112509.
- H. Sajid, T. Mahmood and K. Ayub, High sensitivity of polypyrrole sensor for uric acid over urea, acetamide and sulfonamide: a density functional theory study, Synth. Met., 2018, 235, 49–60, DOI:10.1016/j.synthmet.2017.11.008.
- H. Sajid, T. Mahmood and K. Ayub, High sensitivity of polypyrrole sensor for uric acid over urea, acetamide and sulfonamide: a density functional theory study, Synth. Met., 2018, 235, 49–60, DOI:10.1016/j.synthmet.2017.11.008.
- G. He and H. He, DFT studies on the heterogeneous oxidation of SO2 by oxygen functional groups on graphene, Phys. Chem. Chem. Phys., 2016, 18, 31691–31697, 10.1039/c6cp06665h.
- C. Goyenola, S. Stafström, L. Hultman and G. K. Gueorguiev, Structural Patterns Arising during Synthetic Growth of Fullerene-Like Sulfocarbide, J. Phys. Chem. C, 2012, 116, 21124–21131, DOI:10.1021/jp307347t.
- J. M. Pacheco, G. K. Gueorguiev and J. L. Martins, First-principles study of the possibility of condensed phases of endohedral silicon cage clusters, Phys. Rev. B: Condens. Matter Mater. Phys., 2002, 66, 033401, DOI:10.1103/PhysRevB.66.033401.
- H. Sajid, T. Mahmood, M. H. R. Mahmood and K. Ayub, Comparative investigation of sensor application of polypyrrole for gaseous analytes, J. Phys. Org. Chem., 2019, 32(8) DOI:10.1002/poc.3960.
- H. Sajid, T. Mahmood and K. Ayub, High sensitivity of polypyrrole sensor for uric acid over urea, acetamide and sulfonamide: a density functional theory study, Synth. Met., 2018, 235, 49–60, DOI:10.1016/j.synthmet.2017.11.008.
- H. Sajid, T. Mahmood, M. H. R. Mahmood and K. Ayub, Comparative investigation of sensor application of polypyrrole for gaseous analytes, J. Phys. Org. Chem., 2019, 1–19, DOI:10.1002/poc.3960.
- I. Gaussview, Viewing Gaussian Structures with GaussView, pp. 1–25 Search PubMed.
- S. Sajjad, Maria, T. Mahmood and K. Ayub, Benchmark study of structural and vibrational properties of scandium clusters, J. Mol. Struct., 2017, 1142, 139–147, DOI:10.1016/j.molstruc.2017.04.046.
- M. Yar, M. A. Hashmi, A. Khan and K. Ayub, Carbon nitride 2-D surface as a highly selective electrochemical sensor for V-series nerve agents, Elsevier B.V., 2020, DOI:10.1016/j.molliq.2020.113357.
- T. Lu and F. Chen, Multiwfn: a multifunctional wavefunction analyzer, J. Comput. Chem., 2012, 33, 580–592, DOI:10.1002/jcc.22885.
- I. Cukrowski, J. H. De Lange, A. S. Adeyinka and P. Mangondo, Evaluating common QTAIM and NCI interpretations of the electron density concentration through IQA interaction energies and 1D cross-sections of the electron and deformation density distributions, Comput. Theor. Chem., 2015, 1–52 Search PubMed.
- N. Trendafilova, G. Bauer and T. Mihaylov, DFT and AIM studies of intramolecular hydrogen bonds in dicoumarols, Chem. Phys., 2004, 302, 95–104, DOI:10.1016/j.chemphys.2004.03.021.
- J. N. Ghogomu and N. K. Nkungli, DFT Studies and Topological Analyses of Electron Density on Acetophenone and Propiophenone Thiosemicarbazone Derivatives as Covalent Inhibitors of Falcipain-2, a Major Plasmodium Falciparum Cysteine Protease, Phys. Chem. Res., 2017, 5, 795–817, DOI:10.22036/pcr.2017.83153.1370.
- S. A. Bhadane, D. N. Lande and S. P. Gejji, Understanding Binding of Cyano-Adamantyl Derivatives to Pillar[6]arene Macrocycle from Density Functional Theory, J. Phys. Chem. A, 2016, 120, 8738–8749, DOI:10.1021/acs.jpca.6b08512.
- N. L. Marana, S. M. Casassa and J. R. Sambrano, Adsorption of NH3 with Different Coverages on Single-Walled ZnO Nanotube: DFT and QTAIM Study, J. Phys. Chem. C, 2017, 121, 8109–8119, DOI:10.1021/acs.jpcc.6b10396.
- N. S. Venkataramanan, A. Suvitha and Y. Kawazoe, Unravelling the nature of binding of cubane and substituted cubanes within cucurbiturils: a DFT and NCI study, J. Mol. Liq., 2018, 260, 18–29, DOI:10.1016/j.molliq.2018.03.071.
- Z. Wang, M. Chen, Y. Huang, X. Shi, Y. Zhang and T. Huang, Self-Assembly Synthesis of Boron-Doped Graphitic Carbon Nitride Hollow Tubes for Enhanced Photocatalytic NOx Removal under Visible Light Applied Catalysis B : Environmental Self-Assembly Synthesis of Boron-Doped Graphitic Carbon Nitride Hollow Tubes for e, Appl. Catal. B Environ., 2018, 239, 352–361, DOI:10.1016/j.apcatb.2018.08.030.
- M. Hussain, X. Song, S. Shah and C. Hao, Spectrochim. Acta, Part A, 2019, 117432, DOI:10.1016/j.saa.2019.117432.
- M. D. Esra and B. Nejadebrahimi, Applied Surface Science Theoretical insights into hydrogenation of CO2 to formic acid over a single Co atom incorporated nitrogen-doped graphene, a DFT study, Appl. Surf. Sci., 2019, 475, 363–371, DOI:10.1016/j.apsusc.2018.12.302.
- S. Sarr, J. Graton, G. Montavon, J. Pilmé and N. Galland, On the Interplay between Charge-Shift Bonding and Halogen Bonding, ChemPhysChem, 2020, 21, 240–250, DOI:10.1002/cphc.201901023.
- P. Metrangolo, F. Meyer, T. Pilati, G. Resnati and G. Terraneo, Halogen Bonding in Supramolecular Chemistry, Angew. Chem,. Int. Ed., 2008, 47, 6114–6127, DOI:10.1002/anie.200800128.
- K. Ayub and T. Mahmood, DFT studies of halogen bonding abilities of nitrobenzene with halogens and chlorofluorocarbons, J. Chem. Soc. Pak., 2013, 35, 617–620 Search PubMed.
- F. Meyer and P. Dubois, Halogen bonding at work: recent applications in synthetic chemistry and materials science, CrystEngComm, 2013, 15, 3058–3071, 10.1039/C2CE26150B.
- A. Mukherjee, S. Tothadi and G. R. Desiraju, Halogen Bonds in Crystal Engineering: Like Hydrogen Bonds yet Different, Acc. Chem. Res., 2014, 47, 2514–2524, DOI:10.1021/ar5001555.
- Z. Han, G. Czap, C. Chiang, C. Xu, P. J. Wagner, X. Wei, Y. Zhang, R. Wu and W. Ho, Imaging the halogen bond in self-assembled halogenbenzenes on silver, Science, 2017, 358, 206–210, DOI:10.1126/science.aai8625.
- E. Margiotta, S. C. C. van der Lubbe, L. de Azevedo Santos, G. Paragi, S. Moro, F. M. Bickelhaupt and C. Fonseca Guerra, Halogen Bonds in Ligand–Protein Systems: Molecular Orbital Theory for Drug Design, J. Chem. Inf. Model., 2020, 60, 1317–1328, DOI:10.1021/acs.jcim.9b00946.
- R. L. Sutar, E. Engelage, R. Stoll and S. M. Huber, Bidentate chiral bis(imidazolium)-based halogen bond donors: synthesis and first applications in enantioselective recognition and catalysis, Angew. Chem., Int. Ed., 2020, 59, 6806–6810, DOI:10.1002/anie.201915931.
- P. Politzer, J. S. Murray and T. Clark, Halogen bonding and other σ-hole interactions: a perspective, Phys. Chem. Chem. Phys., 2013, 15, 11178, 10.1039/c3cp00054k.
- M. C. Ford and P. S. Ho, Computational Tools to Model Halogen Bonds in Medicinal Chemistry, J. Med. Chem., 2016, 59, 1655–1670, DOI:10.1021/acs.jmedchem.5b00997.
- H. Su, Q. Wu, H. Wang and H. Wang, Ab initio calculations, structure, NBO and NCI analyses of X–H⋯π interactions, Chem. Phys. Lett., 2018, 693, 202–209, DOI:10.1016/j.cplett.2018.01.015.
- A. Y. Fedorov, T. N. Drebushchak and C. Tantardini, Seeking the best model for non-covalent interactions within the crystal structure of meloxicam, Comput. Theor. Chem., 2019, 1157, 47–53, DOI:10.1016/j.comptc.2019.04.012.
- H. Benaissi, M. Drissi, S. Yahiaoui, Y. Megrouss, A. Chouaih and F. Hamzaoui, Hirshfeld surface analysis, topological features and nonlinear optical properties of phthalonitrile derivative , low temperature experimental charge density and quantum chemistry studies, J. Optoelectron. Biomed. Mater., 2018, 10, 73–82 Search PubMed.
- E. Espinosa, E. Molins and C. Lecomte, Hydrogen bond strengths revealed by topological analyses of experimentally observed electron densities, Chem. Phys. Lett., 1998, 285, 170–173, DOI:10.1016/S0009-2614(98)00036-0.
- T. Steiner, The Hydrogen Bond in the Solid State, Angew. Chem., Int. Ed., 2002, 41, 48–76, DOI:10.1002/1521-3773(20020104)41.
Footnote |
| † Electronic supplementary information (ESI) available. See DOI: 10.1039/d0ra04930a |
| This journal is © The Royal Society of Chemistry 2020 |

