
 Open Access Article
 This Open Access Article is licensed under a
 Creative Commons Attribution 3.0 Unported Licence
Influence of Al2O3 nanoparticle doping on depolarization temperature, and electrical and energy harvesting properties of lead-free 0.94(Bi0.5Na0.5)TiO3–0.06BaTiO3 ceramics
Pharatree Jaitaabcd,
Supalak Manothama and
Gobwute Rujijanagul *abcd
*abcd
aDepartment of Physics and Materials Science, Faculty of Science, Chiang Mai University, Chiang Mai 50200, Thailand. E-mail: rujijanagul@yahoo.com
bScience and Technology Research Institute, Chiang Mai University, Chiang Mai 50200, Thailand
cResearch Center in Physics and Astronomy, Faculty of Science, Chiang Mai University, Chiang Mai 50200, Thailand
dMaterials Science Research Center, Faculty of Science, Chiang Mai University, Chiang Mai 50200, Thailand
First published on 28th August 2020
Abstract
In this research article, the effects of Al2O3 nanoparticles (0–1.0 mol%) on the phase formation, microstructure, dielectric, ferroelectric, piezoelectric, electric field-induced strain and energy harvesting properties of the 0.94(Bi0.5Na0.5)TiO3–0.06BaTiO3 (BNT–6BT) ceramic were investigated. All ceramics have been synthesized by a conventional mixed oxide method. The XRD and Raman spectra showed coexisting rhombohedral and tetragonal phases throughout the entire compositional range. An increase of the grain size, TF–R, Tm, εmax and δA values was noticeable when Al2O3 was added. Depolarization temperature (Td), which was determined by the thermally stimulated depolarization current (TSDC), tended to increase with Al2O3 content. The good ferroelectric properties (Pr = 32.64 μC cm−2, Ec = 30.59 kV cm−1) and large low-field d33 (205 pC N−1) values were observed for the 0.1 mol% Al2O3 ceramic. The small Al2O3 additive improved the electric field-induced strain (Smax and  ). The 1.0 mol% Al2O3 ceramic had a large piezoelectric voltage coefficient (g33 = 32.6 × 10⁻³ Vm N−1) and good dielectric properties (εr,max = 6542, Td = 93 °C, TF–R = 108 °C, Tm = 324 °C and δA = 164 K). The highest off-resonance figure of merit (FoM) for energy harvesting of 6.36 pm2 N−1 was also observed for the 1.0 mol% Al2O3 ceramic, which is suggesting that this ceramic has potential to be one of the promising lead-free piezoelectric candidates for further use in energy harvesting applications.
Introduction
Piezoelectric ceramics currently in large-scale applications are still lead-based ceramic systems, which have outstanding piezoelectric properties.1 However, the high lead content (near 60%) in PZT electronic ceramic devices is harmful to our environment and the human body during the production and usage processes of these devices.2 The search for lead-free piezoelectric ceramic systems, such as Ba0.5Na0.5TiO3 (BNT),1,3, BaTiO3 (BT)4 and BiFeO3 (BF),5 has therefore attracted more efforts.Among the candidates for lead-free systems, the Bi-based ceramic like bismuth sodium titanate Bi0.5Na0.5TiO3 (BNT) is regarded as the most promising system comparable to lead-based materials, and it has been extensively studied.1,2 BNT is one of the comprehensively studied lead-free perovskite ferroelectric materials, which exhibits a relatively high Curie temperature (TC = 320 °C) as well as a high remanent polarization (Pr ∼ 38 μC cm−2).6 BNT has a rhombohedral perovskite structure (R3c) with Na1+ and Bi3+ distributed sequentially in A-site.7 However, high value of the coercive electric field (Ec > 60 kV cm−1) and high conductivity are two drawbacks for BNT to become an alternative replacement for PZT.7 A recent research by Nagata et al.8 using secondary ion mass spectrometry revealed that the difficulty in the poling treatment of the BNT ceramic is attributed to the pinning of domain movement due to Bi vaporization at high sintering temperatures above 1130 °C. This difficulty is causing limitations in the applications of the BNT. One of the possible solutions to overcome the drawbacks in the BNT ceramic, is to use a solid solution by substituting of either A or B-sites.7 Furthermore, researchers found that establishing the binary system of BNT–BT is an effective way to improve the electrical performances of this system.9,10 The (1 − x)(Bi0.5Na0.5)TiO3–xBaTiO3 or (1 − x)BNT–xBT system has been firstly studied by Takenaka et al.9 for its dielectric and piezoelectric properties. This BNT–BT system is studied from the viewpoint of a new group of lead-free piezoelectric ceramics with the morphotropic phase boundary or MPB.9 The MPB can be obtained from the compositional boundary between two different perovskite phases which can be achieved by controlling the ratio of each perovskite component. The origin of the high piezoelectric response in the MPB can be explained by a high of degree freedom of the polarization within the boundary which can be easily oriented by an electric field.11 In their work, the MPB between rhombohedral BNT and tetragonal BT phases was found at x = 0.06 − 0.07 with highly enhanced piezoelectric (d33 = 125 pC N−1, k33 = 55%) and dielectric properties (εr = 580, TC = 288 °C), with the depolarization temperature (Td) between 100–130 °C. The binary system of BNT–BT with its MPB composition has superior piezoelectric properties, which means that this composition has a potential to be one of the promising lead-free piezoelectric candidates for actuator applications.9
Although the Bi0.5Na0.5TiO3-based solid solution is one of the most promising lead-free piezoelectric candidates, the depolarization temperature (Td) of these solid solutions is an obstacle for their practical applications,12,13 i.e. the BNT–BT ceramic started to loss piezoelectric properties around Td of 100 °C, the BNT–BKT ceramic has a similar polarization and started to lose those properties at 150 °C, and K0.5Na0.5NbO3 (KNN) ceramic shows a polymorphic phase transition (PPT) between orthorhombic and tetragonal structure at ∼200 °C, above which the piezoelectric properties degrade.14 Thus, many authors have tried to increase the Td value of BNT-based ceramics so that these ceramics would also achieve high piezoelectric properties.12,13,15 Zhang et al.12 prepared the semiconductor/relaxor 0–3-type composites of 0.94Bi0.5Na0.5TiO3–0.06BaTiO3![[thin space (1/6-em)]](https://www.rsc.org/images/entities/char_2009.gif) :xZnO (or BNT–6BT:xZnO). They found that the Td increased from 98 °C for the x = 0 sample to ∼150 °C for the x = 0.2 sample, indicating a delay of thermal depolarization. As the ZnO concentration further increased to x = 0.3 and x = 0.4, the first anomaly of dielectric constant and the sharp decrease of dielectric loss disappeared, indicating the complete elimination of thermal depolarization. Mahajan et al.15 studied the thermal depoling behavior of the BNTBT–ZnO composites. This work clearly showed the shift in depolarization temperature (Td) to a higher temperature, which was explained to be due to the intrinsic contribution of Zn ions in the BNTBT lattice. In this work, the thermal depoling behavior of BNTBT-based materials was also directly related to the transition temperature from the rhombohedral phase to the tetragonal phase in this phase transition model, which was consistent with four current peaks in their ferroelectric loops close to the depoling temperature. Takagi et al.16 also found that the quenching was an effective increase of the Td value for the lead-free (Bi0.5Na0.5)TiO3–(Bi0.5Li0.5)TiO3–(Bi0.5K0.5)TiO3 system without the deterioration of its piezoelectric properties. The increase in Td was strongly correlated with the lattice distortion. Verma et al.17 also found that the addition of vanadium (V5+) increased the Td of the 0.94(Na0.50Bi0.50)TiO3–0.06BaTiO3 or BNT–BT ceramics. The Td was found to increase significantly in poled samples from 104 °C for the undoped sample to 150 °C for the sample with 1% vanadium substitution.
:xZnO (or BNT–6BT:xZnO). They found that the Td increased from 98 °C for the x = 0 sample to ∼150 °C for the x = 0.2 sample, indicating a delay of thermal depolarization. As the ZnO concentration further increased to x = 0.3 and x = 0.4, the first anomaly of dielectric constant and the sharp decrease of dielectric loss disappeared, indicating the complete elimination of thermal depolarization. Mahajan et al.15 studied the thermal depoling behavior of the BNTBT–ZnO composites. This work clearly showed the shift in depolarization temperature (Td) to a higher temperature, which was explained to be due to the intrinsic contribution of Zn ions in the BNTBT lattice. In this work, the thermal depoling behavior of BNTBT-based materials was also directly related to the transition temperature from the rhombohedral phase to the tetragonal phase in this phase transition model, which was consistent with four current peaks in their ferroelectric loops close to the depoling temperature. Takagi et al.16 also found that the quenching was an effective increase of the Td value for the lead-free (Bi0.5Na0.5)TiO3–(Bi0.5Li0.5)TiO3–(Bi0.5K0.5)TiO3 system without the deterioration of its piezoelectric properties. The increase in Td was strongly correlated with the lattice distortion. Verma et al.17 also found that the addition of vanadium (V5+) increased the Td of the 0.94(Na0.50Bi0.50)TiO3–0.06BaTiO3 or BNT–BT ceramics. The Td was found to increase significantly in poled samples from 104 °C for the undoped sample to 150 °C for the sample with 1% vanadium substitution.
Besides these additives, some other alternative metal oxide additives should be introduced to shift up the Td as well as to improve the electrical properties of the BNT-based ceramics. It is suggested form the work done by Yin et al.13 that Al2O3 can significantly shift up the Td in the BNKT-based materials (Bi0.5(Na0.8K0.2)0.5TiO3:Al2O3 or BNKT:Al2O3 composites). This is evidenced by the temperature dependence of the dielectric constant, ferroelectric and piezoelectric properties. In addition, the piezoelectricity of the BNKT:0.15Al2O3 ceramic remained stable at a high temperature (∼210 °C).13 However, the effects of the Al2O3 on the Td for the BNT–BT ceramic have not been researched, to our knowledge. Furthermore, the effects of the Al2O3 additive on electrical properties such as the energy harvesting properties of the BNT–6BT ceramics are scarcely known. In the present work, the lead-free 0.94(Bi0.5Na0.5)TiO3–0.06BaTiO3 (BNT–6BT, at the MPB composition) was selected due to its showing higher piezoelectric and ferroelectric properties. The Al2O3 nanoparticle powder was selected as the additive because it is expected that when some Al3+ ions enter into the perovskite lattice to replace the Ti4+ ions at Bi-site, the imbalance in ion valence can lead to the creation of oxygen vacancies, which, in turn, enhances the transfer of mass and energy between reactants, with the end result of an increases in grain size.18,19 It is well known for ferroelectric ceramics that have larger grains, domain motion is easier which results in an increase in its ferroelectric performance.20 Moreover, when Al3+ occupies the Bi-site of Ti4+, it will create oxygen vacancy and produce lattice deformation. This may make the ferroelectric domains reorientation easier during the electrical poling, and then lead to the enhancement of piezoelectric properties.19 It was also reported that some nanoparticle additive produced a significant difference on microstructure over the micro size additive.21 For example in the KNN ceramics, the nanoparticle of the ZnO additive improved their grain growth, along with decreasing the porosity, and then resulted in the enhancements of piezoelectric and dielectric properties as compared to the microparticle ZnO additive. This evidence was explained by the better modification of microstructure after the ceramics were added by the nanoparticle additive.21 Furthermore, our previous work indicated that the addition of Al2O3 nanoparticles in lead-based ceramics such as Pb0.88Sr0.12Zr0.54Ti0.44Sb0.02O3 (PSZST) ceramics also improved their densification and electrical properties such as dielectric constant and polarization value.22 Thus, this research article aimed to fabricate the binary system of BNT–6BT/xAl2O3. The role of Al2O3 nanoparticle concentration on densification, phase evolution, microstructure, electrical properties (dielectric, ferroelectric, piezoelectric, electric field-induced strain behavior), depolarization temperature and energy harvesting properties of the BNT–6BT ceramic were investigated and discussed in details.
Experimental
The conventional mixed oxide technique was applied to synthesize the powder of 0.94(Bi0.5Na0.5)TiO3–0.06BaTiO3/xAl2O3 nanoparticles, referred to as BNT–6BT/xAl2O3 ceramics. Reagent-grade powders of Bi2O3, Na2CO3, BaCO3, TiO2, Al2O3 nanoparticles were used as the starting raw materials. All carbonate powders were first dried at 120 °C for 24 h in order to remove any moisture. The raw materials of BNBT were stoichiometrically weighed and mixed by ball milling in 99.9% ethanol for 24 h and the slurry was dried using an oven. Dried BNBT powders were separately calcined in a closed Al2O3 crucible at 900 °C for 2 h. After that, the Al2O3 nanoparticles were added to calcined BNT–6BT powder in different ratios (0, 0.1, 0.5 and 1.0 mol%) and then milled for 24 h in ethanol. After drying and sieving the powders, they were granulated by adding a few drops of 4 wt% PVA as a binder and then pressed into disks 10 mm in diameter and about 1.2 mm in thickness. Finally, the pellets were placed in a sealed alumina crucible and covered with a powder of the same composition before being sintered at 1125 °C for 2 h dwell time with a heating/cooling rate of 5 °C min−1. Bulk density was determined by the Archimedes' method. An X-ray diffractometer ((XRD), PANalytical, X′ Pert Pro MPD) was used to study the phase evolution of all ceramics. Raman spectra were obtained by Raman spectroscopy. A scanning electron microscope (SEM, JEOL JSM-6335F) was used to study microstructural features of the ceramics. The grain size of the ceramics was measured by using the linear intercept method. Before electrical measurements were performed, all samples were polished into a parallel surface with 1 mm thickness. Silver paste was painted onto both sides of the sample. Then the samples were heated at 700 °C for 15 min to form electrodes. Dielectric properties as a function of temperature (25–500 °C) were determined using an LCR-meter (HP model 4192A) at frequencies ranging from 1 to 1000 kHz. The ferroelectric properties were investigated by a Radiant Precision ferroelectric tester both at room temperature (RT) and high temperatures (HT) of 25–150 °C. An AC electric field of 50 kV cm−1 at a frequency of 1 Hz was utilized in the hysteresis measurement. Remanent polarization (Pr), maximum polarization (Pmax), and coercive field (Ec) values were determined from the hysteresis loops. Strain–electric field (S–E) data at RT were obtained by using an optical displacement sensor (Fotonic Sensor model MTI-2100) injunction with a Radiant ferroelectric test system. A maximum electric field of 50 kV cm−1 and a frequency of 0.1 Hz were used to measure the bipolar strain curve. The maximum strain (Smax) and the negative strain (Sneg) values were calculated from the bipolar curve. The normalized strain coefficient was also determined following:
  . For piezoelectric characterization, the ceramics were poled in silicone oil under a DC electric field of 3 kV mm−1 for 15 min. The low-field piezoelectric coefficient (d33) was recorded from the 1 day aged samples using a d33 meter (KCF technologies, S5865) at a frequency of 50 Hz. The piezoelectric voltage constant (g33) and the off-resonance figure of merit (FoM) for energy harvesting were also calculated.
Results and discussion
Densification, phase formation and microstructure
After sintering the pellet-shaped samples at various temperatures (1100–1175 °C), it was found that the optimum sintering temperature of the BNT–6BT/xAl2O3 ceramics was 1125 °C at which all samples had densities ranging between 5.77 and 5.86 g cm−3. Based on the density data at the optimum sintering temperature of 1125 °C, the data clearly showed that the variation of composition had a significant influence on the sample density. The addition of Al2O3 nanoparticles into the BNT–6BT ceramic caused a slight decrease in the sample's density. The reason for this slight decrease in the samples' density was probably due to the fact that Al2O3 had a lower density (∼3.59 g cm−3)23 than the BNT–6BT ceramic (∼5.841 g cm−3).24XRD patterns of the BNT–6BT/xAl2O3 ceramics at room temperature (RT) are shown in Fig. 1(a), where 2θ = 20–70°. It was found that the pure BNT–6BT ceramic had a single perovskite structure with a mix of rhombohedral and tetragonal phases. This was evidenced by a slight splitting of (111)R/(1![[1 with combining macron]](https://www.rsc.org/images/entities/char_0031_0304.gif) 1)R rhombohedral peaks at 2θ = 39–41° and (002)T/(200)T tetragonal peaks at 2θ = 45–48°, as seen in Fig. 1(b) and (c), respectively. This result is consistent with the previous work reported by Takenaka et al.9 who found a relatively broad morphotropic phase boundary (MPB) region between rhombohedral BNT and tetragonal BT phases in the range of x = 0.06–0.07. Chen et al.25 also found that the BNT–6BT ceramic at MPB region had a mixture of rhombohedral and tetragonal phases with the splitting of (111)R/(11)R around 40° and (002)T/(200)T peak around 46°, respectively. For the modified-samples, the coexistence of the mixed rhombohedral and tetragonal phases was also obtained. This can be evidenced by, the existence of the splitting (002)T/(200)T tetragonal peaks, and (111)R/(11)R rhombohedral peak, thus indicating that all ceramics showed coexisting rhombohedral and tetragonal phases throughout the entire compositional range. Based on Table 1, the tetragonality (c/a) value decreased from 1.0121 for the pure BNT–6BT ceramic to 1.0115 for the 1.0 mol% Al2O3 ceramic. These results may be due to apart of Al ions from the additive having replaced Ti ions (ionic radius of Ti4+ = 0.605 Å and Al3+ = 0.535 Å).26 This produced a slight distortion of the lattice and clearly indicated that the addition of Al2O3 increased the lattice anisotropy of the BNT–6BT systems. However, a secondary phase of aluminum bismuth oxide, Al2Bi24O39 (ICDD file no. 00-042-0184) was observed at 2θ ∼ 64.8° with an increase of Al2O3 content. A similar result was observed in the BNKT–Al2O3 system, of which the secondary phase of Al2Bi24O39 exhibited more with an increase in the additive.13
1)R rhombohedral peaks at 2θ = 39–41° and (002)T/(200)T tetragonal peaks at 2θ = 45–48°, as seen in Fig. 1(b) and (c), respectively. This result is consistent with the previous work reported by Takenaka et al.9 who found a relatively broad morphotropic phase boundary (MPB) region between rhombohedral BNT and tetragonal BT phases in the range of x = 0.06–0.07. Chen et al.25 also found that the BNT–6BT ceramic at MPB region had a mixture of rhombohedral and tetragonal phases with the splitting of (111)R/(11)R around 40° and (002)T/(200)T peak around 46°, respectively. For the modified-samples, the coexistence of the mixed rhombohedral and tetragonal phases was also obtained. This can be evidenced by, the existence of the splitting (002)T/(200)T tetragonal peaks, and (111)R/(11)R rhombohedral peak, thus indicating that all ceramics showed coexisting rhombohedral and tetragonal phases throughout the entire compositional range. Based on Table 1, the tetragonality (c/a) value decreased from 1.0121 for the pure BNT–6BT ceramic to 1.0115 for the 1.0 mol% Al2O3 ceramic. These results may be due to apart of Al ions from the additive having replaced Ti ions (ionic radius of Ti4+ = 0.605 Å and Al3+ = 0.535 Å).26 This produced a slight distortion of the lattice and clearly indicated that the addition of Al2O3 increased the lattice anisotropy of the BNT–6BT systems. However, a secondary phase of aluminum bismuth oxide, Al2Bi24O39 (ICDD file no. 00-042-0184) was observed at 2θ ∼ 64.8° with an increase of Al2O3 content. A similar result was observed in the BNKT–Al2O3 system, of which the secondary phase of Al2Bi24O39 exhibited more with an increase in the additive.13
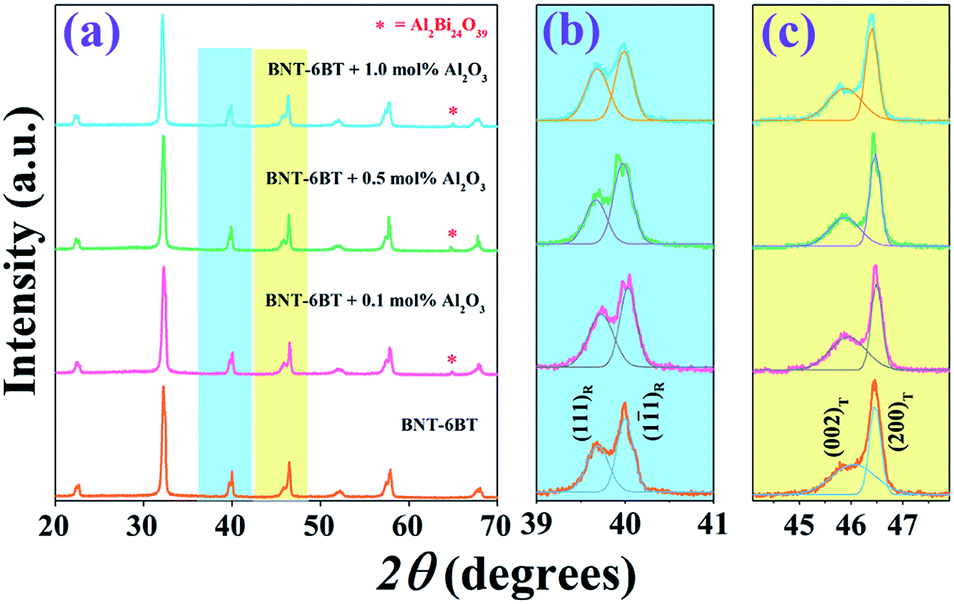 | ||
| Fig. 1 X-ray diffraction patterns of the BNT–6BT/xAl2O3 ceramics where (a) 2θ = 20–80°, (b) 2θ = 39–41°, and (c) 2θ = 45–47.5°. | ||
| x | Density (g cm−3) | Grain size (μm) | c/a | Td (°C) | TF–R (°C) | Tm (°C) | εmax | tanδ |
δA (K) |
|---|---|---|---|---|---|---|---|---|---|
| 0 | 5.86 | 1.81 | 1.0121 | 86 | 93 | 293 | 5848 | 0.0563 | 89 |
| 0.1 | 5.79 | 1.92 | 1.0119 | 87 | 96 | 294 | 5768 | 0.0795 | 107 |
| 0.5 | 5.79 | 2.29 | 1.0117 | 91 | 99 | 295 | 6064 | 0.1014 | 126 |
| 1.0 | 5.77 | 3.12 | 1.0115 | 93 | 108 | 324 | 6542 | 0.2048 | 164 |
Raman spectroscopy is an effective tool for identifying the structural modification and lattice vibrations of the crystals. In order to identify the functional groups in the present ceramics, we carried room temperature Raman measurements on the smooth surface of the BNT–6BT/xAl2O3 ceramics in 100–1200 cm−1. Raman modes mainly occur due to the internal vibrations of lattice point in octahedral/tetrahedral sites. Here, the Raman spectra of the BNT–6BT/xAl2O3 ceramics at RT are presented in Fig. 2. The obtained modes of Raman spectra are similar to these connected to the BNT-based ceramics that were reported in the literature earlier.1,27,28 Four main regions were detected in the Raman spectra: (1) the mode below 200 cm−1 related to A-site vibrations,29 including Bi3+, Na+ and Ba2+; (2) the peak at 260 cm−1 associated with the Ti–O bond which is in agreement with the peak of 267–270 cm−1 previously reported by Baskar et al.;30,31 (3) the high-frequency region from 450 to 700 cm−1 related to TiO6 vibrations, namely the breathing and stretching modes of the oxygen octahedral,27 and (4) the fourth region where a vibration range higher than 700 cm−1 was associated with the superposition of vibration A1 (longitudinal optical) and E (longitudinal optical) overlapping bands.27,29 It is obvious that a special splitting of two bands was observed in between 450 and 700 cm−1 for all compositions, which indicates the coexistence of a dual phase between rhombohedral and tetragonal, thus this confirms the existence of MPB in the present ceramics.18 Therefore, this Raman result in the present work agrees with the XRD result, which confirms the coexistence of the rhombohedral and tetragonal phases in the entire composition range.18
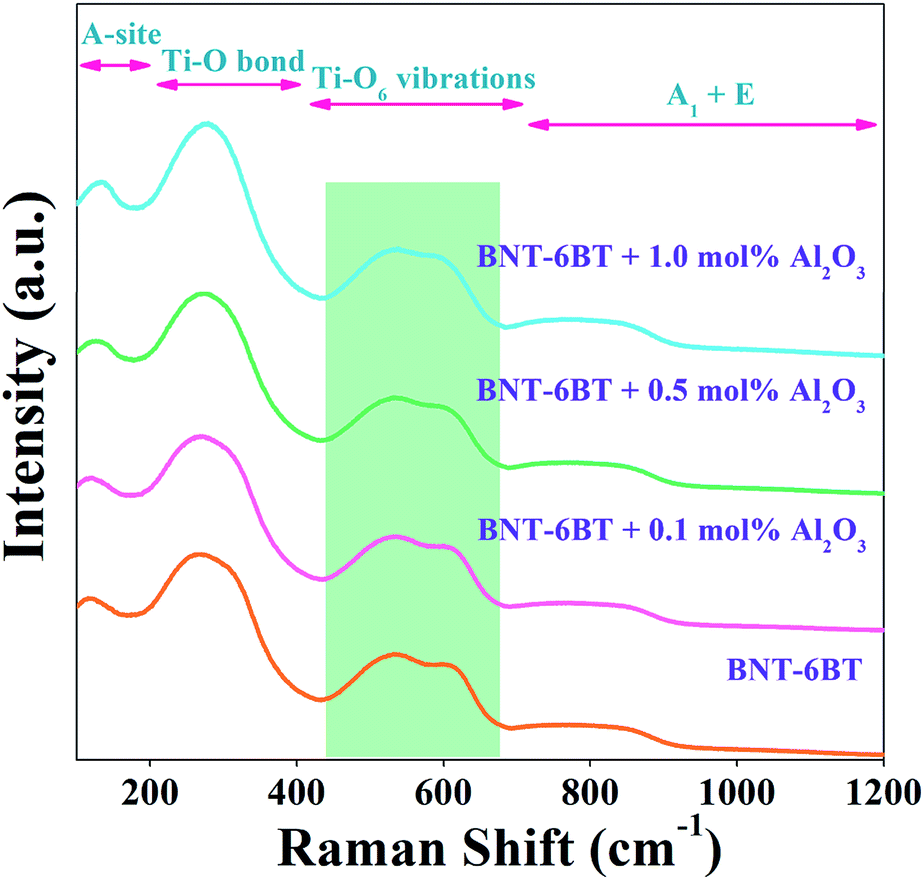 | ||
| Fig. 2 Raman spectra of the BNT–6BT/xAl2O3 ceramics at RT. | ||
The microstructures of the BNT–6BT/xAl2O3 ceramics are exhibited in Fig. 3. The average grain size was calculated by the linear intercept method. SEM observation confirmed that all ceramic samples displayed a highly dense and compact microstructure without a trace of porosity. Sharp grain boundaries were observed from the SEM images. The pure BNT–6BT ceramic showed a dense and homogeneous microstructure with regular cubic-like grains. The addition of Al2O3 allowed a more equiaxed grain shape. The average grain size increased slightly from 1.81 μm for the pure BNT–6BT ceramic by approximately 2 times to 3.12 μm for the 1.0 mol% Al2O3 ceramic, as listed in Table 1. This implies that Al2O3 can promote grain growth for the BNT–6BT ceramic. The Al ions, mostly with +3 valence, enter the perovskite lattice to replace the Ti4+ site. Therefore, the imbalance in ion valence leads to the creation of oxygen vacancies,18 which enhance the transfer of mass and energy between reactants, thus improving sintering behaviour and inducing an increase in grain size.18 A similar observation was made in the BNKSTT–100xLi system when the introduction of Li+ ions into the A-site of Bi0.5(Na0.4K0.1)0.96Sr0.04Ti0.975Ta0.025O3 and Li+ enhance mass transfer and promoted grain growth in the BNKSTT ceramics.32 Lee et al.19 also found that the ZnO promoted grain growth within the BNT ceramic. They found that the possible reasons for the grain growth was the fact that Zn2+ entered into the B-site of the perovskite structure to substitute for Ti4+ due to their matching radii. To maintain overall electrical neutrality, oxygen vacancies are created. As is generally recognized, the presence of oxygen vacancies is beneficial to mass transport during sintering. This is assumed to be responsible for the promoted grain growth as the content of ZnO increases in their mixture.19
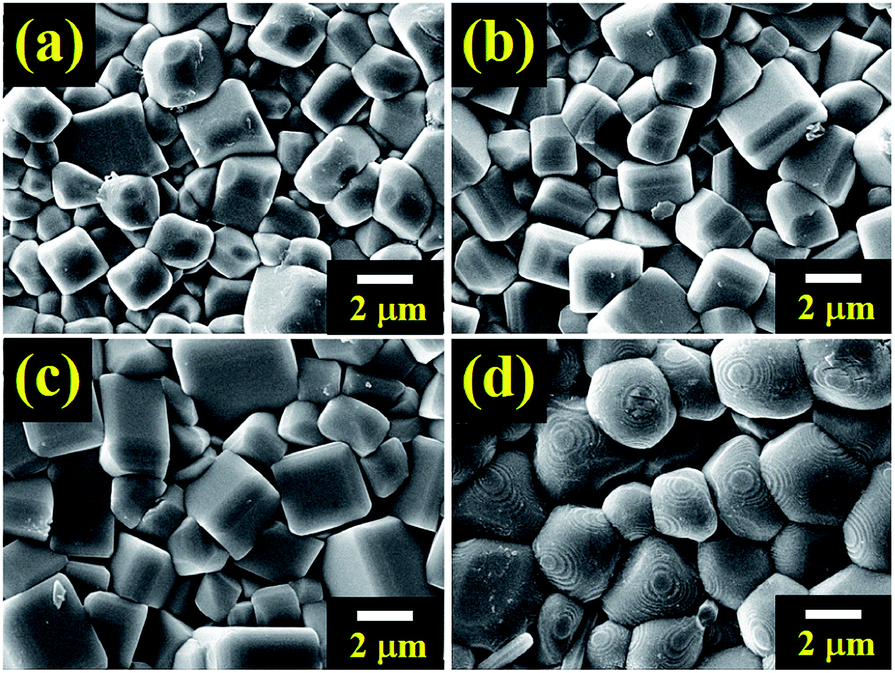 | ||
| Fig. 3 FE-SEM micrographs of as sintered surfaces of the BNT–6BT/xAl2O3 ceramics where (a) x = 0, (b) x = 0.1, (c) x = 0.5, and (d) x = 1.0 mol%. | ||
Dielectric properties and phase transition
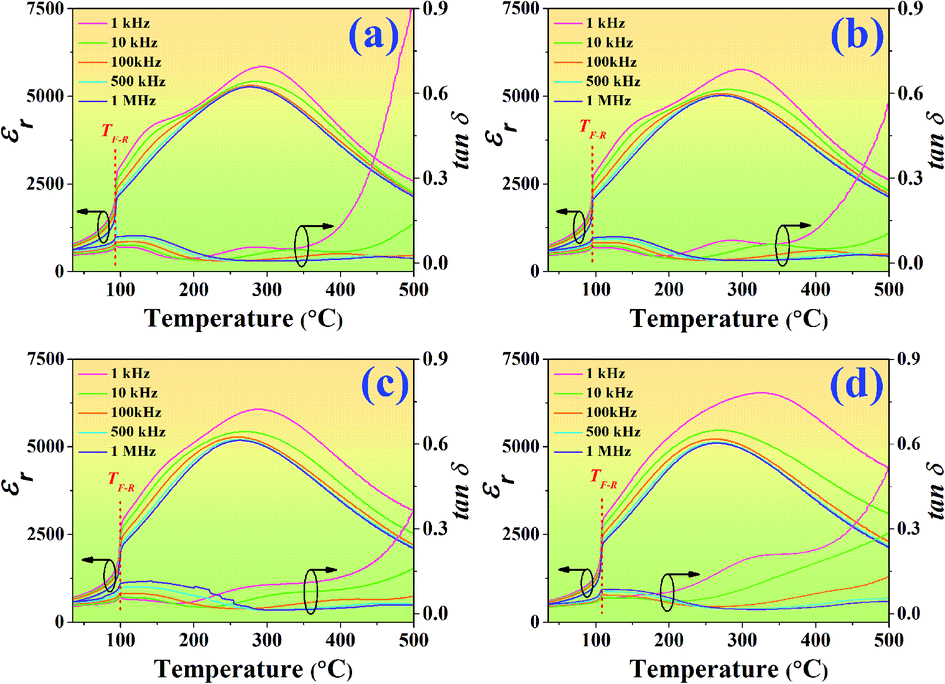
Temperature dependence on dielectric constant (εr) and dielectric loss (tanδ) of the poled BNT–6BT/xAl2O3 ceramics measured at various frequencies from 1–1000 kHz are presented in Fig. 4, and the related dielectric values are listed in Table 1. The dielectric permittivity curves of all compositions present two anomalous dielectric peaks. These two peak anomalies intrinsically come from pure BNT in which the coexistence of R3c and P4bm polar nanoregions (PNRs) has been reported, which can be reversibly transformed into each other over a wide temperature range.33 The peak position around higher temperature is defined as Tm, where the dielectric constant reaches the maximum value (εmax).32 The peaks of lower temperatures are called ferroelectric to relaxor transition point (TF–R), which denotes the transformation from the long-range ferroelectric state (FE) to the relaxor state.1,3,34,35 Such phenomena have also been reported in other BNT-based ceramics.1,3,6,34–36 Sharp TF–R peaks can be clearly seen in the pure BNT–6BT and the doped-ceramics. In this work, the TF–R for the pure BNT–6BT ceramic was 93 °C which was close to 86 °C the value observed earlier by Gong et al.6 The TF–R was obviously composition-dependent and was found to increase with increasing Al2O3 content. This value reached the maximum value of 108 °C for the 1.0 mol% Al2O3 ceramic (enhanced from the based composition by 15 °C). The pure BNT–6BT ceramic had Tm and εmax value of 293 °C and 5848, respectively. The Tm value in this work was close to Tm = 300 °C of 0.94(Bi0.5Na0.5)TiO3–0.06BaTiO3 ceramic which was observed previously by Yan et al.1 The Tm and εmax values also increased with increasing Al2O3 content. A reason for the increase in εmax may be due to the Al3+ ions that can be replaced by Ti4+ ions on the B-site of the perovskite ABO3 structure within the BNT–6BT ceramic. This leads to a rise in the local deformation of the unit cell and a significant increase in its permittivity performance.19 The tanδ value also follows a similar trend to that of the εmax value. The tanδ increased with increasing Al2O3 content. Besides, the dielectric peaks at Tm were suppressed and gradually broadened with increasing Al2O3 content, suggesting an enhanced diffuse phase transition behaviour of this system.37,38
 | ||
| Fig. 4 Temperature dependence on dielectric constant (εr) and dielectric loss (tanδ) of the poled BNT–6BT/xAl2O3 ceramics and measured at various frequencies from 1–1000 kHz. | ||
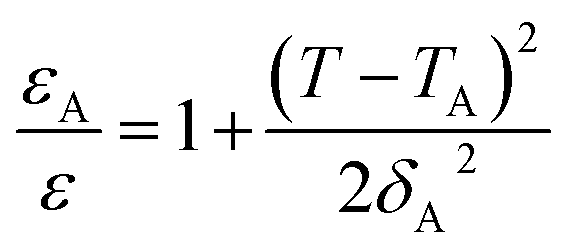
To quantify the degree of diffuseness at the phase transition at Tm, a diffuseness parameter (δA) was calculated by using the modified Curie–Weiss law, as the following equation.39,40
 | (1) |
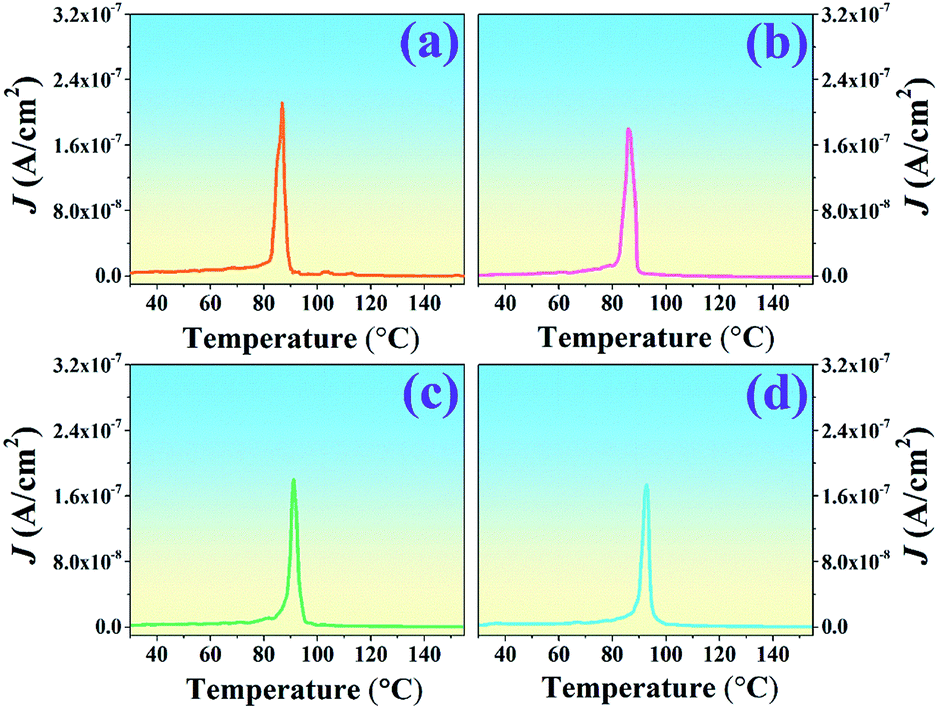
Several methods to determine the thermal depolarization temperature (Td) can be found in the literatures14,41–44 including the thermally stimulated depolarization current (TSDC), temperature dependent in situ d33, dielectric permittivity and dielectric loss, piezoelectric resonance measurements, and high-temperature in situ XRD.14 However, the TSDC method is one of the most popular techniques. Thus, the TSDC technique was employed in this work. The current density–temperature (J–T) curves from the TSDC technique for all studied ceramics are displayed in Fig. 5. It should be noted that Td tended to be gradually deferred with increasing Al2O3 content. As further seen in Table 1, the Td increased from 86 °C for the pure BNT–6BT ceramic to the maximum value of 93 °C for the 1.0 mol% Al2O3 ceramic. To explain the increase of the Td value, many models have been proposed.13,15,44 In the case of the Bi0.5(Na0.8K0.2)0.5TiO3:Al2O3 (BNKT:Al2O3) composites which was reported by Yin et al.,13 they found that the Td is deferred to the higher temperatures (from 116 °C to 227 °C) with increasing Al2O3 contents, as evidenced by the temperature dependence of dielectric, ferroelectric and piezoelectric properties. In addition, the piezoelectricity of their sample (BNKT:0.15Al2O3) remained stable at a high temperature (∼210 °C). It can be seen that Al2O3 significantly enhanced the thermal depolarization temperature. This was proposed to be due to the thermal deviatoric stress from the coefficients of thermal expansion (CTE) discrepancies between Al2O3 and BNKT matrix, which provides a stronger stabilization force than the ions diffusion-induced destabilization force, resulting in the ultimate deferred thermal depolarization and the significantly increased Td values.13 Mahajan et al.15 also studied thermal depoling behavior of the BNTBT–ZnO composites. They also suggested that the shift up of Td in their samples is due to Zn ions being diffused into the BNTBT lattices and occupying the B-sites, thereby stabilizing ferroelectric ordering. Li et al.44 reported that the doping of Zn2+ into Bi0.5Na0.5TiO3–6BaTiO3 (BNT–6BT) delayed the crossover from nonergodic to ergodic states, and the thermal depolarization temperature Td was delayed from 85 °C for the pure sample to 120 °C for the BNT–6BT + 6% Zn2+ sample, as confirmed by temperature-dependent dielectric and ferroelectric measurements. They suggested that the variation of the Td could be ascribed to the reformation of the long-range ferroelectric order due to the large ionic polarizability of Zn2+. The high ionic polarizability of Zn2+ can result in a large dipole moment of BO6 octahedra, thus strengthening the coherence of neighboring dipoles and suppressing the ferroelectric–relaxor transition. These results improve our understanding on the thermal depolarization of Bi0.5Na0.5TiO3-based ferroelectrics.44 In the present work for BNT–6BT/xAl2O3 ceramics, it is believed that the shift in the depolarization temperature is due to the intrinsic contribution of the Al ion in the BNT–6BT lattices, which is the reason for the increasing of Td value, as already suggested by many authors.
 | ||
| Fig. 5 Plots of current density–temperature (J–T) from the TSDC technique of the BNT–6BT/xAl2O3 ceramics. | ||
Ferroelectric and electric field induced strain properties
In this work, the polarization–electric field (P–E) hysteresis loop of the BNT–6BT/xAl2O3 ceramics is measured at RT under an electric field of 50 kV cm−1 and a frequency of 1 Hz where x = 0–1.0 mol% are plotted in Fig. 6. The corresponding values of remanent polarization (Pr), maximum polarization (Pmax), and coercive field (Ec) as a function of Al2O3 content are listed in Table 2. The pure BNT–6BT ceramic displayed a typical ferroelectric behavior with square-shaped P–E loops having a large maximum polarization, Pmax = 32.27 μC cm−2, remanent polarization, Pr = 28.25 μC cm−2 and a relatively large coercive field, Ec = 29.95 kV cm−1. It should be noted that Pr and Ec values of pure BNT–6BT ceramic in this work are close to Pr (30 μC cm−2) and Ec (30 kV cm−1) values of 0.94(Bi0.5Na0.5)TiO3–0.06BaTiO3 as observed previously by Yan et al.1 Current vs. electric field (I–E) data are also shown in Fig. 6. Two current density peaks gradually shift to the higher field, accompanied by the slightly increased Ec value. However, the addition of Al2O3 into BNBT ceramic slightly affects the shape of the P–E loop and other ferroelectric properties. The Pmax and Pr values increased with increasing Al2O3 content and reached the maximum values of 36.58 and 32.64 μC cm−2, respectively for the 0.1 mol% Al2O3 ceramic, then slightly decreased with further increase in the additive. The increase in grain size may be a reason for an improvement of the ferroelectric properties with an increasing Pr value. As it is known, the ferroelectric ceramics that have larger grains, domain motion is easier which results in larger Pr value.20 Many reports have suggested that larger grained piezoceramics have higher ferroelectric and piezoelectric properties.45,46 In addition, the large grains have a stronger “binding force”, which will create more irreversible electric dipole after the cancellation of the external electric field, thus leading to a greater Pr value.47 This result is consistent with the previous work reported by Lee et al.48 who studied the effects of Al2O3 on the ferroelectric properties of the (Na0.5K0.5)0.925Li0.075NbO3, NKLN lead-free piezoceramics. They found that the ferroelectric properties of this composition system mainly depend on density and grain size. With increasing Al2O3 content up to 0.5 wt%, the density and grain size increased, accompanied by an increased ferroelectric performance i.e. increasing of Pr value.48 Furthermore, the Al2O3 nanoparticles were also found to improve the densification and the electrical properties of the Pb0.88Sr0.12Zr0.54Ti0.44Sb0.02O3 (PSZST) ceramics, such as dielectric constant and polarization.22 Moreover for the present work, the Ec value slightly increased with increasing Al2O3 content, i.e. it increased from 29.95 kV cm−1 for the pure BNT–6BT ceramic to around 34.36 kV cm−1 for the 1.0 mol% Al2O3 ceramic (see Table 2). The increase in the Ec value is consistent with the previous work reported by Yin et al.13 who found that the four current density peaks of the BNKT–Al2O3 system merge into two peaks and then gradually shift to the higher field with increasing Al2O3 content, accompanied by a slightly increased coercive field Ec value.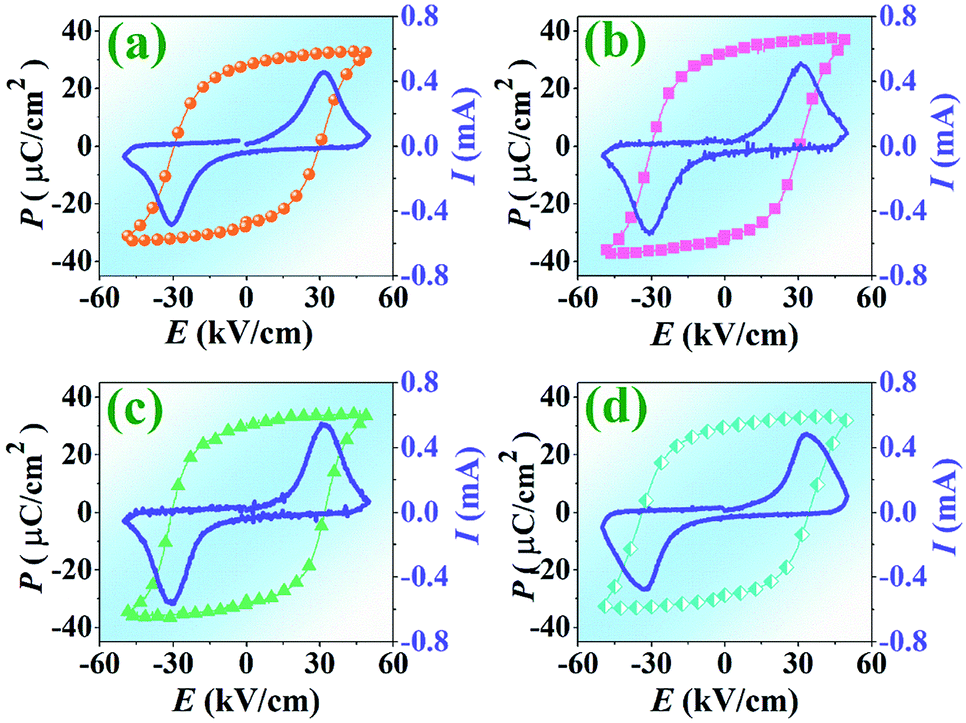 | ||
| Fig. 6 Polarization–electric field (P–E) hysteresis loop and current–electric field (I–E) of the BNT–6BT/xAl2O3 ceramics, measured at RT under an electric field of 50 kV cm−1 a frequency of 1 Hz where (a) x = 0, (b) x = 0.1, (c) x = 0.5, and (d) x = 1.0 mol%. | ||
| x | Pmax (μC cm−2) | Pr (μC cm−2) | Ec (kV cm−1) | Smax (%) | Sneg (%) |
|
d33 (pC N−1) | g33 (×10−3 Vm N−1) | FoM (pm2 N−1) |
|---|---|---|---|---|---|---|---|---|---|
| 0 | 32.27 | 28.25 | 29.95 | 0.21 | −0.22 | 412 | 178 | 25.4 | 4.52 |
| 0.1 | 36.58 | 32.64 | 30.59 | 0.23 | −0.22 | 466 | 205 | 31.0 | 6.36 |
| 0.5 | 33.65 | 30.17 | 31.89 | 0.20 | −0.17 | 401 | 181 | 30.0 | 5.43 |
| 1.0 | 31.72 | 29.71 | 34.36 | 0.19 | −0.16 | 372 | 175 | 32.6 | 5.71 |
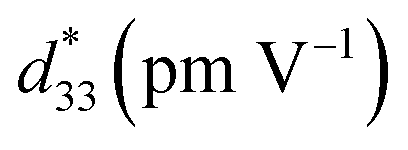
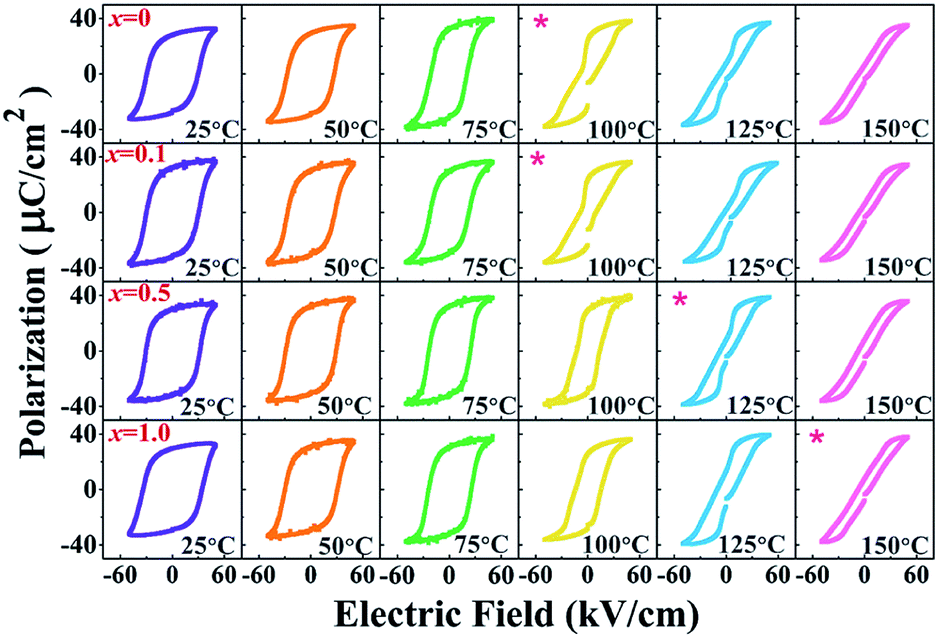
To investigate the effect of temperature on the ferroelectric properties of the BNT–6BT/xAl2O3 ceramics and to confirm the deferred thermal depolarization, the temperature-dependent P–E data were measured under an electric field of 50 kV cm−1 at 1 Hz over the temperature range of 25–150 °C, as displayed in Fig. 7. All samples exhibited well-saturated P–E loops at RT (25 °C). With increasing temperature up to 100 °C, the Pr and Ec values decreased and the hysteresis loops started to deform and showed constricted loops for the 0–0.1 mol% Al2O3 samples. This indicates the onset temperature for ergodic behavior (see marked as “*”). However, the behavior of the constricted loops was not evident even at ∼100 °C for the 0.5–1.0 mol% Al2O3 samples. It is clearly suggested that the onset temperature for ergodic behavior was pushed to higher temperatures as Al2O3 content increased.49,50 While at a higher temperature of 150 °C, the Pr and Ec values rapidly decreased close to zero and the hysteresis loops for all compositions appeared with a characteristic double pinched shape. This observation supports our observation for the shift of the depolarization temperature to a higher temperature. This trend is apparently well correlated with the higher depolarization temperature as shown in Fig. 5, which was determined by the thermally stimulated depolarization current (TSDC). In addition, the decrease of Pr and Ec values with increasing temperature in Fig. 8(a) and (b) is consistent with that reported by Malik et al.50 in the 0.96[Bi0.5(Na0.84K0.16)0.5Ti1−xTaxO3]–0.04SrTiO3 lead-free ceramics. Their result also showed that the Pr and Ec values decreased at high temperatures due to the chemical substitution and temperature effects. Both factors can cause lattice distortion and disrupt the FE long-range order leading to the decrease in the stability of the polarization.50 Gupta et al.33 also found that there was a sudden decrease in Pr and Ec values around the TF–R (∼100 °C) for the binary system of (1 − x)BNKT–xSHZ, resulting in the observation of a pinched P–E loop, which is typical for ergodic relaxors (ER). In the work done by Patterson et al.,51 they investigated the solid solutions of BNT and Bi(Zn0.5Ti0.5)O3 (BZT) and they found that with 2 mol% of BZT, the double loops appeared at around 150 °C. Temperature-dependent hysteresis measurements also showed that the Pr and Ec values decreased significantly and the data showed double-loop characteristics on heating.
 | ||
| Fig. 7 Temperature dependence on polarization–electric field (P–E) hysteresis loops of the BNT–6BT/xAl2O3 ceramics where x = 0 1.0 mol%, measured under an electric field of 50 kV cm−1 and a frequency of 1 Hz. | ||
 | ||
| Fig. 8 Plots of (a) Pr as a function of temperature and (b) Ec as a function of temperature of the BNT–6BT/xAl2O3 ceramics. | ||
Fig. 9 presents the bipolar strain–electric field (S–E) loops of the BNT–6BT/xAl2O3 ceramics measured at room temperature (RT). The measurement was performed under an electric field of 50 kV cm−1 and a frequency of 0.1 Hz. For more details, the maximum strain (Smax), the negative strain (Sneg, i.e. denotes the difference between zero-field strain and the lowest strain and is only visible in the bipolar cycle),52 and the normalized strain coefficient  3,52 are also summarized in Table 2. The pure BNT–6BT ceramic exhibited a typical butterfly-shaped strain loop with Smax of 0.21% and
  of 412 pm V−1 where the largest Sneg of −0.22% was observed.6 The Smax and
  value of this composition in this work is higher than the Smax (0.18%) and
  values of the 0.94(Bi0.5Na0.5)TiO3–0.06BaTiO3 ceramic, observed in previous works.3 With increasing Al2O3 content in the BNT–6BT ceramic, the Smax and
  values slightly increased to 0.23% and 466 pm V−1, respectively for the 0.1 mol% Al2O3 ceramic. With a further increase in the Al2O3 content, the Smax and
  values slightly decreased.
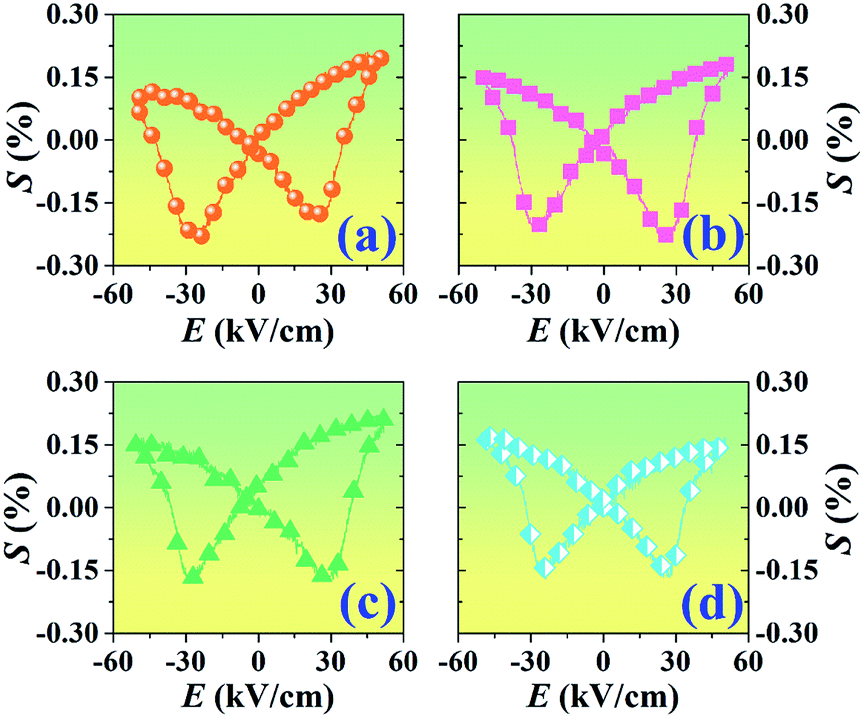 | ||
| Fig. 9 Bipolar strain–electric field (S–E) loops of the BNT–6BT/xAl2O3 ceramics where x = 0–1.0 mol%, measured under an electric field of 50 kV cm−1 and a frequency of 0.1 Hz. | ||
Piezoelectric and energy harvesting properties
Plots of low-field piezoelectric coefficient (d33) as a function of Al2O3 nanoparticle content of the BNT–6BT/xAl2O3 ceramics are shown in Fig. 10 and their values are also summarized in Table 2. The pure BNBT ceramic had a low-field d33 of 178 pC N−1. The low-field d33 value increased with increasing Al2O3 content and reached a maximum value of 205 pC N−1 for the 0.1 mol% Al2O3 ceramic. This value was close to that presented by Yoo et al.53 in an earlier study, where the low-field d33 value of 205 pC N−1 for the BNT-based system was obtained. With a further increase in the Al2O3 content, the low-field d33 slightly decreased. The improvement of low-field d33 for the modified samples confirms the improvement of ferroelectric properties. This can be explained by the thermodynamic theory of ferroelectrics. According to this theory, d33 can be expressed as d33 = 2ε33TQ11Pr, where ε33T represents the dielectric constant of material, Q11 represents the electrostrictive coefficient, which is constant for perovskite materials, and Pr is the remnant polarization.54 This equation suggests that the d33 value is proportional to the Pr value. Therefore, the increase of the d33 value can be due to the improvement of the Pr value. Furthermore, the radius of Al3+ (0.535 Å) is closer to the radius of Ti4+ (0.605 Å). When Al3+ occupies the Bi-site of Ti4+ as an acceptor within the perovskite ABO3 structure,48 has an effective negative charge, which can be compensated by a positively charged oxygen vacancy55 in order to maintain the overall charge neutrality.15 The oxygen vacancy can produce lattice deformation. This can make the ferroelectric domain reorientation easier during electrical poling, and then lead to the enhancement of piezoelectric properties.19 Moreover, the increase in low-field d33 can be linked to an increase in the grain size as it is known that the larger gain gives the larger domain size with smaller domain wall width, thus enabling domain movement (under an applied electric field).20,56,57
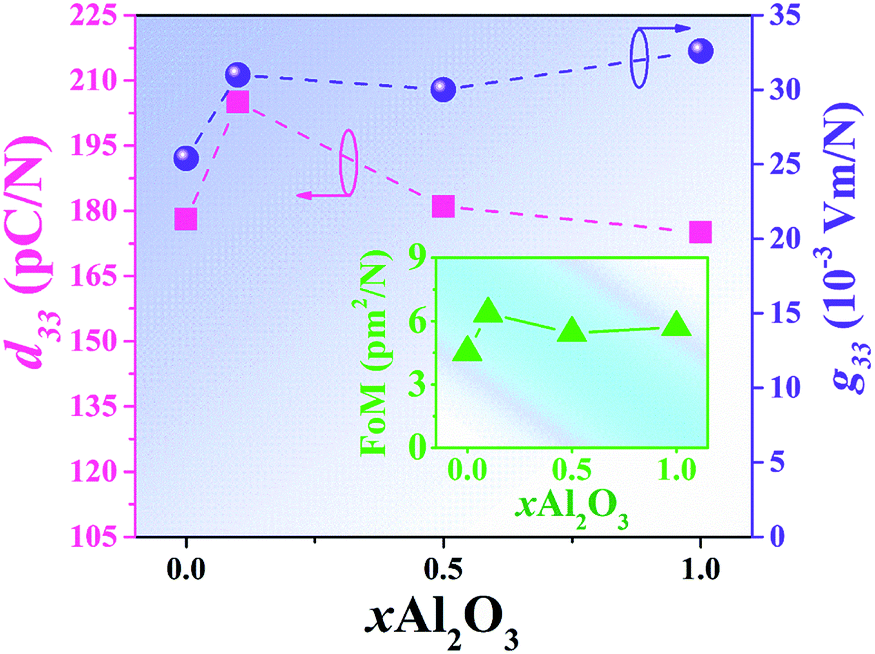 | ||
| Fig. 10 Plots of low-field piezoelectric coefficients (d33) and piezoelectric voltage coefficient (g33) as a function of Al2O3 content of the BNT–6BT/xAl2O3 ceramics (the inset shows: FoM as a function of Al2O3 content). | ||
The piezoelectric voltage coefficient (g33) value is a key factor when evaluating piezoelectric energy harvester. It is a parameter that indicates the amount of electrical energy generated by the applied pressure.58 Normally, it is difficult to obtain high g33 for an increase in d33 usually accompanied by an even larger increase in εr value.59 The g33 value can be explained by the following relation:58–62
| g33 = d33/εrε0 | (2) |
The off-resonance figure of merit (FoM) for energy harvesting can be expressed as follows:58,62,63
| FoM (pm2 N−1) = d33 × g33 | (3) |
Conclusions
To sum it all up, the lead-free 0.94(Bi0.5Na0.5)TiO3–0.06BaTiO3/xAl2O3 or BNT–6BT/xAl2O3 ceramics (with x = 0, 0.1, 0.5, and 1.0 mol%) were successfully synthesized by a solid-state mixed oxide method. Phase, microstructure and electrical properties of the ceramics as a function of Al2O3 nanoparticle-added content were examined. The XRD and Raman spectra showed coexisting rhombohedral and tetragonal phases throughout the entire compositional range. The additive promoted grain growth and improved the electrical properties of the ceramics. The Td, TF–R and εmax values tended to increase with Al2O3 concentration. The 0.1 mol% Al2O3 ceramic showed good ferroelectric properties and relatively high piezoelectric coefficients. The off-resonance figure of merit (FoM) for energy harvesting was also improved by the Al2O3 additive. It is believed that these results can provide a simple and effective way to defer the thermal depolarization to a higher temperature and to improve the electrical properties and thermal stability of conventional (BNT–BT)-based and other (BNT–BT)-based ceramics, which may pave the way for further use for wide temperature applications.Conflicts of interest
There are no conflicts to declare.Acknowledgements
This research work was supported by Thailand Science Research and Innovation (TSRI), National Research Council of Thailand and partially supported by Chiang Mai University. Research Center in Physics and Astronomy, Materials Science Research Center, Basic Research Fund, Global Partnership Project, Department of Physics and Materials Science, Science and Technology Research Institute, Chiang Mai University is also acknowledged.References
- B. Yan, H. Fan, C. Wang, M. Zhang, A. K. Yadav, X. Zheng, H. Wang and Z. Du, Ceram. Int., 2020, 46, 281–288 CrossRef CAS.
- Q. Li, L. Ning, B. Hu, H. Peng, N. Zhao and H. Fan, Ceram. Int., 2019, 45, 1676–1682 CrossRef CAS.
- L. Wu, B. Shen, Q. Hu, J. Chen, Y. Wang, Y. Xia, J. Yin and Z. Liu, J. Am. Ceram. Soc., 2017, 100, 4670–4679 CrossRef CAS.
- W. Bai, L. Wang, X. Zhao, P. Zheng, F. Wen, L. Li and J. Zhai, Ceram. Int., 2019, 45, 18623–18631 CrossRef CAS.
- N. Zhao, H. Fan, X. Ren, J. Ma, J. Bao, Y. Guo and Y. Zhou, J. Eur. Ceram. Soc., 2019, 39, 4096–4102 CrossRef CAS.
- Y. Gong, X. He, C. Chen and Z. Yi, Ceram. Int., 2019, 45, 7173–7179 CrossRef CAS.
- N. B. Mohamad and E. K. A. Shakarchi, J. Adv. Dielectr., 2017, 7, 1750019 CrossRef.
- H. Nagata, T. Shinya, Y. Hiruma, T. Takenaka, I. Sakaguchis and H. Haneda, Ceram. Trans., 2005, 167, 213–222 CAS.
- T. Takenaka, K. Maruyama and K. Sakata, Jpn. J. Appl. Phys., 1991, 30, 2236–2239 CrossRef CAS.
- Q. Li, M. Li, C. Wang, M. Zhang and H. Fan, Ceram. Int., 2019, 45, 19822–19828 CrossRef CAS.
- B. Jaffe, W. R. Cook and H. Jaffe, Piezoelectric Ceramics, Academic Press, London, 1971 Search PubMed.
- J. Zhang, Z. Pan, F. F. Guo, W. C. Liu, H. Ning, Y. B. Chen, M. H. Lu, B. Yang, J. Chen, S. T. Zhang, X. Xin, J. Rodel, W. Cao and Y. F. Chen, Nat. Commun., 2015, 10, 6615 CrossRef PubMed.
- J. Yin, Y. Wang, Y. Zhang, B. Wu and J. Wu, Acta Mater., 2018, 158, 269–277 CrossRef CAS.
- E. M. Anton, W. Jo, D. Damjanovic and J. Rödel, J. Appl. Phys., 2011, 110, 094108 CrossRef.
- A. Mahajan, H. Zhang, J. Wu, E. V. Ramana, M. J. Reece and H. Yan, J. Phys. Chem. C, 2017, 121, 5709–5718 CrossRef CAS.
- Y. Takagi, T. Miura, H. Nagata and T. Takenaka, Jpn. J. Appl. Phys., 2019, 58, SLLD02 CrossRef CAS.
- A. Verma, A. K. Yadav, S. Kumar, V. Srihari, P. Rajput, V. R. Reddy, R. Jangir, H. K. Poshwal, S. W. Liu, S. Biring and S. Sen, J. Appl. Phys., 2018, 123, 224101 CrossRef.
- L. Li, D. Fang, R. X. Wang, J. Hao, Z. B. Gu and S. T. Zhang, Ceram. Int., 2020, 46, 7947–7953 CrossRef CAS.
- Y. C. Lee, T. K. Lee and J. H. Jan, J. Eur. Ceram. Soc., 2011, 31, 3145–3152 CrossRef CAS.
- I. Coondoo, S. K. Agarwal and A. K. Jha, Mater. Res. Bull., 2009, 44, 1288–1292 CrossRef CAS.
- R. Hayati and A. Barzegar, Mater. Sci. Eng., B, 2010, 172, 121–126 CrossRef CAS.
- P. Jaita, C. Kruea-In and G. Rujijanagul, Nanomater. Nanotechnol., 2016, 6, 1–7 CrossRef.
- J. A. Kohn, G. Katz and J. D. Broder, Am. Mineral., 1957, 42, 398–407 CAS.
- R. Cheng, Z. Xu, R. Chu, J. Hao, J. Du, W. Ji and G. Li, Ceram. Int., 2015, 41, 8119–8127 CrossRef CAS.
- J. Chen, Y. Wang, L. Wu, Q. Hu and Y. Yang, J. Alloys Compd., 2019, 775, 865–871 CrossRef CAS.
- R. D. Shannon, Acta Crystallogr., 1976, A32, 751–767 CrossRef CAS.
- C. Wang, Q. Li, A. K. Yadav, H. Peng and H. Fan, J. Alloys Compd., 2019, 803, 1082–1089 CrossRef CAS.
- K. Raju, K. R. Kandula, S. Asthana and T. Patri, Phase Transitions, 2019, 92, 1–12 CrossRef.
- A. K. Yadav, H. Fan, B. Yan, C. Wang, M. Zhang, J. Ma, W. Wang, W. Dong and S. Wang, Ceram. Int., 2020, 46, 5681–5688 CrossRef CAS.
- S. Baskar, D. Meyricka, R. K. Selvan and M. Minakshi, Chem. Eng. J., 2014, 253, 502–507 CrossRef CAS.
- S. Baskar, R. K. Selvan, L. Vasylechko and M. Minakshi, Solid State Sci., 2014, 35, 18–27 CrossRef.
- C. Wang, Q. Li, W. Zhang, B. Yan, A. K. Yadav, H. Peng and H. Fan, Ceram. Int., 2020, 46, 715–721 CrossRef CAS.
- S. K. Gupta, R. M. Quade, B. Gibbons, P. Mardilovich and D. P. Cann, J. Appl. Phys., 2020, 127, 074104 CrossRef.
- X. Zhou, Z. Yana, H. Qi, L. Wang, S. Wang, Y. Wang, C. Jiang, H. Luo and D. Zhang, J. Eur. Ceram. Soc., 2019, 39, 2310–2317 CrossRef CAS.
- N. U. Basar, M. I. Khan, A. Ullah, N. Ullah, I. W. Kim, N. U. Rehman and J. Khan, Mater. Res. Express, 2019, 6, 095804 CrossRef CAS.
- W. Bai, L. Wang, X. Zhao, P. Zheng, F. Wen, L. Li, J. Zhai and Z. Ji, Dalton Trans., 2019, 48, 10160 RSC.
- G. Dong, H. Fan, J. Shi and Q. Li, J. Am. Ceram. Soc., 2018, 101, 3947–3955 CrossRef CAS.
- A. Hussain, J. U. Rahman, A. Zaman, R. A. Malik, J. S. Kim, T. K. Song, W. J. Kim and M. H. Kim, Mater. Chem. Phys., 2014, 143, 1282–1288 CrossRef CAS.
- S. Ke, H. Fan, H. Huang and H. L. W. Chan, Appl. Phys. Lett., 2008, 93, 112906 CrossRef.
- A. A. Bokov and Z. G. Ye, Solid State Commun., 2000, 116, 105–108 CrossRef CAS.
- T. Wang, X. M. Chen and Y. Z. Qiu, Ferroelectrics, 2017, 510, 161–169 CrossRef CAS.
- N. Lei, M. Zhu, L. Wang, P. Yang and Y. Hou, Phys. Status Solidi A, 2011, 208, 186–190 CrossRef CAS.
- H. Hu, M. Zhu, F. Xie, N. Lei, J. Chen, Y. Hou and H. Yan, J. Am. Ceram. Soc., 2009, 92, 2039–2045 CrossRef CAS.
- L. Li, M. Zhu, K. Zhou, Q. Wei, M. Zheng and Y. Hou, J. Appl. Phys., 2017, 122, 204104 CrossRef.
- V. R. Mudinepalli, L. Feng, W. C. Lin and B. S. Murty, J. Adv. Ceram., 2015, 4, 46–53 CrossRef CAS.
- C. A. Randall, N. Kim, J. P. Kucera, W. Cao and T. R. Shrout, J. Am. Ceram. Soc., 1998, 81, 677–688 CrossRef CAS.
- Q. Li, J. Wang, Y. Ma, L. Ma, G. Dong and H. Fan, J. Alloys Compd., 2016, 663, 701–707 CrossRef CAS.
- I. H. Lee, H. S. Lee, Y. H. Kim, S. K. Gil and D. H. Kang, Ceram. Int., 2013, 39, S709–S713 CrossRef CAS.
- P. Jaita, A. Watcharapasorn, N. Kumar, D. P. Cann and S. Jiansirisomboon, Electron. Mater. Lett., 2015, 11, 828–835 CrossRef CAS.
- R. A. Malik, A. Hussain, A. Maqbool, A. Zaman, T. K. Song, W. J. Kim and M. H. Kim, J. Alloys Compd., 2016, 682, 302–310 CrossRef CAS.
- E. A. Patterson and D. P. Cann, J. Am. Ceram. Soc., 2012, 95, 3509–3513 CrossRef CAS.
- R. A. Malik, A. Hussain, A. Maqbool, A. Zaman, C. W. Ahn, J. U. Rahman, T. K. Song, W. J. Kim and M. H. Kim, J. Am. Ceram. Soc., 2015, 98, 3842–3848 CrossRef CAS.
- J. Yoo, J. Hong, H. Lee, Y. Jeong, B. Lee, H. Song and J. Kwon, Sens. Actuators, A, 2006, 126, 41–47 CrossRef CAS.
- A. Ullah, C. W. Ahn, A. Hussain, I. W. Kim, H. I. Hwang and N. K. Cho, Solid State Commun., 2010, 150, 1145–1149 CrossRef CAS.
- A. J. Moulson and J. M. Herbert, Electroceramics: Materials, Properties, Applications, John Wiley & Sons Ltd., Chichester, 2003 Search PubMed.
- L. A. Ramajo, J. Taub and M. S. Castro, Mater. Res., 2014, 17, 728–733 CrossRef CAS.
- S. Manotham, P. Butnoi, P. Jaita, D. Tantraviwat, N. Boothrawong and G. Rujijanagul, Mater. Res. Bull., 2020, 128, 110859 CrossRef CAS.
- D. J. Shin, J. Kim and J. H. Koh, J. Eur. Ceram. Soc., 2018, 38, 4395–4403 CrossRef CAS.
- B. Liu, P. Li, B. Shen, J. Zhai, Y. Zhang, F. Li and X. Liu, J. Am. Ceram. Soc., 2018, 101, 265–273 CrossRef CAS.
- D. J. Shin and J. H. Koh, J. Nanosci. Nanotechnol., 2016, 13, 6321–6325 CrossRef PubMed.
- P. Gowdhaman, V. Annamalai and O. P. Thakur, Ferroelectrics, 2016, 493, 120–129 CrossRef CAS.
- Y. J. Choi, M. J. Yoo, H. W. Kang, H. G. Lee, S. H. Han and S. Nahm, J. Electroceram., 2013, 30, 30–35 CrossRef CAS.
- D. J. Shin, W. S. Kang, J. H. Koh, K. H. Cho, C. E. Seo and S. K. Lee, Phys. Status Solidi A, 2014, 211, 1812–1817 CrossRef CAS.
| This journal is © The Royal Society of Chemistry 2020 |