
 Open Access Article
 This Open Access Article is licensed under a Creative Commons Attribution-Non Commercial 3.0 Unported Licence
Blackbody emission from CaF2 and ZrO2 nanosized dielectric particles doped with Er3+ ions
P. A. Ryabochkina *a,
S. A. Khrushchalinaa,
I. A. Yurlova,
A. V. Egoryshevab,
A. V. Atanovac,
V. O. Veselovac and
V. M. Kyashkina
*a,
S. A. Khrushchalinaa,
I. A. Yurlova,
A. V. Egoryshevab,
A. V. Atanovac,
V. O. Veselovac and
V. M. Kyashkina
aOgarev Mordovia State University, Saransk 430005, Republic of Mordovia, Russia. E-mail: ryabochkina@freemail.mrsu.ru
bKurnakov Institute of General and Inorganic Chemistry, Russian Academy of Sciences, Leninskii pr. 31, Moscow, 119991, Russia
cFSRC “Crystallography and Photonics” RAS, Moscow, Russia
First published on 13th July 2020
Abstract
We studied the features of the appearance of broadband “white” emission in CaF2-x mol% ErF3 and ZrO2-x mol% Er2O3 (x = 0–25) nanosized dielectric particles upon their excitation by intense laser radiation with λexc = 1550 nm. Comparison of the results of this study with the results obtained previously for other materials doped with Er3+ ions confirmed the thermal nature of the observed emission and made it possible to identify the main factors affecting its occurrence. These include the band gap of the material and the presence of defects in its structure. A method of applying the effect in dermatology is proposed.
1. Introduction
Nanoscale materials have long attracted the interest of researchers due to their unique properties, which often differ from the properties of bulk compounds of similar compositions. A vivid example is the appearance of broadband “white” emission (BBWE) in nanoscale dielectric materials when they are excited by intense laser radiation.1–14 In most cases, this emission was observed in compounds doped with rare-earth (RE) ions upon excitation into the absorption band of these ions. An analysis of these publications indicates that there are different points of view on the nature of the observed phenomenon and the processes responsible for it. If we generalize the researchers' opinions regarding the physical nature of this emission, we can conditionally divide them into two groups. The first group of researchers believes that the observed emission is inherently thermal (blackbody).1,5,11–14 According to the second group of opinions, it represents luminescence and is not associated with sample heating.2,3 For example, the authors of1,5 attribute the thermal nature to the BBWE observed when the nanosized particles of Y2O3:Yb,Er are excited into the absorption band of Yb3+ ions. At the same time, broadband emission (BBE) in the visible spectral region, which arises upon excitation of the 2F5/2 level of Yb3+ ions of LiYbP4O12:Er nanopowders, is explained by charge transfer luminescence of Yb3+ ions.2,3In our own studies,7 we demonstrated that the BBWE arising in Y1−xErxPO4 (x = 0–1) nanosized dielectric particles under laser excitation with λexc = 970 nm, is thermal. Studies of the features of similar phenomenon in Y(1−x)ErxVO4 and La1−xPrxGa0.5Sb1.5O6 (x = 0–1) nanopowders upon their excitation into the absorption bands of Er3+ and Pr3+ ions8,9 also confirmed its thermal nature. The appearance of BBE in the visible spectral range in the compounds studied by us is a result of their strong heating under the impact of intense laser radiation. In our opinion, such a significant heating of the samples is resulted from the interaction of electrons in the conduction band with phonons of the crystal lattice. The transition of electrons to the conduction band is due to the interaction of excited RE ions with each other and with defects in the crystal structure, a significant amount of which are concentrated in the surface layers of nanoscale particles due to uncompensated bonds in many atoms.
According to the mechanism we proposed, in addition to the excitation power density and the concentration of RE ions, the appearance of BBWE in various matrices7–9,14 should be significantly affected by their band gap (Eg), the RE ion absorption value at the excitation wavelength, as well as the presence of structure defects. To clarify proposed mechanism and to identify which of these parameters is dominant, it is necessary to study the features of the BBWE appearance in various nanoscale dielectric materials with RE ions, in which these parameters differ significantly.
The study of Y1−xErxPO4 and Y(1−x)ErxVO4 nanoparticles (x = 0–1) with a close crystal structure but different band gap (Eg = 8.6–9.2 eV (ref. 15 and 16) and 3.4–3.8 eV(ref. 17 and 18), respectively) revealed differences in conditions necessary for the BBWE appearance in them.8 For this reason, one of the criteria for choosing compounds for the present study was the value of their band gap, which should differ from values for the materials we have already studied. The next criterion was the presence of defects in the structure, which would be confirmed experimentally.
Compounds CaF2-x mol% ErF3 and ZrO2-x mol% Er2O3 (x = 0–25) satisfy the proposed criteria, are characterized by the same type of crystal structure, different band gap and have a number of features. Compounds of the CaF2–ReF3 type belong to the structural type of fluorite with a cubic crystal lattice and are wide-gap dielectrics with Eg = 12 eV.19 A characteristic feature of such materials is their tendency to form clusters of RE ions at their concentrations of 0.1 at% and higher.20,21 At high concentrations of RE ions, the percolation effect is observed for these compounds,22,23 which consists in the interaction of clusters with each other. It should also be noted that in most studies, BBWE was detected in oxide nanosized particles doped with RE under laser excitation.1–9,11,13,14,24–26 To date, we have found only one such study for fluoride nanosized particles (for LiYbF4 compounds).26 However, studies on the occurrence of BBE in CaF2-x mol% ReF3 compounds were not carried out.
ZrO2-M2O3 solid solutions (where M = Y, RE ions) are also cubic and are characterized by Eg = 4.6–5.8 eV (x = 8–9.5 mol%).27–30 The features of these compounds are their low thermal conductivity and the presence of defects in the structure (oxygen vacancies) due to heterovalent substitution of Zr4+ ions with Y3+ or Re3+ ions. BBE in the ZrO2–Y2O3–Yb2O3–Tm2O3 (YSZ:Tm,Yb), ZrO2–Yb2O3 and Y3.93Yb0.07Zr3O12 compounds and the prospects for its practical application in photovoltaics were reported in ref. 11, 12 and 31. However, the physical mechanisms leading to the occurrence of this emission are not presented in the above papers, except that the authors of12,31 attribute its occurrence to multiphonon relaxation. A deeper understanding of the physical processes causing the described phenomenon will expand the scope of its application, and will also be of fundamental importance.
Thus, summarizing the currently available experimental facts about BBWE in nanoscale dielectric particles with RE ions when they are excited by intense laser radiation into the absorption bands of these ions, we can state the ambiguity of views on the nature of its occurrence and the expediency of further studies in this direction.
In accordance with this, the aim of this work was to study the BBWE regularities in CaF2-x mol% ErF3 and ZrO2-x mol% Er2O3 nanoparticles upon their excitation by laser radiation with λexc = 1550 nm. It was also interesting to conduct a comparative analysis of the obtained results with results for Y1−xErxPO4 and Y1−xErxVO4 (x = 0–1) to clarify the appearance mechanism of the BBWE in nanoscale dielectric particles with RE ions and to identify the most important factors affecting its occurrence.
2. Experimental section
Nanosized CaF2-x mol% ErF3 (x = 5, 10, 15, 25) crystalline powders of fluorite structure were obtained by chemical coprecipitation according to the reaction:| 1 − xCaCl2 + xErCl3 + 2 + xNH4F. |
As starting compounds for the preparation of samples, we used CaCl2 (Aldrich, 99.9% purity), ErCl3·6H2O (Aldrich, 99.9% purity), NH4F (Vecton, 99.9% purity) and deionized water. The mass of reagents was determined to the third decimal place. 25 ml of an initial aqueous solution with a concentration of 0.02 M containing calcium chloride ions and an alloying impurity were slowly added dropwise to 25 ml of 0.045 M aqueous solution of ammonium fluoride. The resulted mother solution was aged on a magnetic stirrer for 60 minutes. After that, the particles were centrifuged and washed three times with deionized water. After the reaction and washing, the product had a pink color, the intensity of which increased with increasing concentration of the dopant. After synthesis annealing was carried out in quartz crucibles in air in a SNOL 6/12-B muffle furnace for 1 hour at a temperature of 650 °C. The choice of the maximum ErF3 concentration in these types of compounds was limited by the formation of the single-phase solid solution, since when the ReF3 content is more than 25 mol%, the probability of the formation of an impurity monoclinic phase along with the cubic one is high.32,33
Nanosized crystals of ZrO2-x mol% Er2O3 (x = 5, 10, 15, 25) were synthesized under hydrothermal conditions according to the procedure.34 As starting reactants were used ZrO(NO3)2·xH2O (Sigma Aldrich, 99.99%) and Er(NO3)3·5H2O (Acros Organic, 99.9%). All the reactants were analyzed to determine the amount of crystallohydrate water molecules and weighted up to the fourth decimal place. 27 ml of initial water solution with concentration of 0.06 M containing ions of zirconia and the dopant was precipitated with 23 ml of ammonia solution. The resulting suspension was subjected to hydrothermal treatment for 24 hours at a temperature of 200 °C. After the synthesis was complete the mother solution was titrated to prove that no metal ions were left. Absence of impurity phases in the samples proves that the expected amount of dopant has indeed entered the lattice. Yield of the reaction is quantities and the product is white in color. In order to increase the size of the obtained nanoparticles, they were additionally annealed in a muffle furnace at the first stage for 6 hours at a temperature of 800 °C and at the second stage for 6 hours at a temperature of 1200 °C.
The morphology of the synthesized CaF2-x mol% ErF3 and ZrO2-x mol% Er2O3 particles was studied by scanning electron microscopy (SEM) on a three-beam Carl Zeiss NVision 40 workstation with the function of local energy dispersive X-ray analysis (EDX) and a transmission electron microscope (TEM) (Carl Zeiss Libra 200 MC).
X-ray diffraction was used for the phase analysis of the samples. It was carried out using an Empyrean PANalytical B.V. diffractometer (CuKα radiation, λ = 1.5414 Å) with a vertical goniometer and a PIXcel 3D detector (for CaF2-x mol% ErF3) and a Bruker D8 Advance diffractometer (CuKα radiation, Ni-filter and LYNXEYE detector, for ZrO2-x mol% Er2O3). Phases were identified using database of International Centre for Diffraction Data (ICDD). Coherent scattering domain size was calculated with the help of Sherrer formula. The lattice parameters were calculated using Topas R software (Bruker AXS, Karlsruhe, Germany) and HighScore Plus (PANalytical).
To record the diffuse reflectance spectra, suspensions consisting of nanopowders and silicate glue were applied to one side of the glass slides, the second side of the glass was covered with several layers of white paper. Diffuse reflectance spectra were measured with a 150 mm integrating sphere, which is an accessory to the Lambda 950 PerkinElmer spectrophotometer.
Spectral-luminescent studies were performed using an automated setup based on the MDR-23 monochromator. An Er-6.0 fiber erbium laser with λexc = 1550 nm was used as an excitation source. An FEU-79 photomultiplier was used as a radiation detector.
Images showing the color dynamics of the emission from the samples were obtained by extracting frames from a video (25 frames per second) recorded using a Sony Nex F3K digital camera.
All measurements were carried out at room temperature.
3. Results and discussion
X-ray phase analysis of the CaF2-x mol% ErF3 and ZrO2-x mol% Er2O3 (x = 5–25) concentration series confirmed (Fig. 1) that both types of synthesized nanoparticles are single-phase and correspond to the structural type of cubic fluorite (sp. gr. Fm3m) with the exception of the ZrO2-x mol% Er2O3 x = 5, 10 which had tetragonal structure (sp. gr. P42/nmc).10 Structural analysis of ZrO2-x mol% Er2O3 showed that lattice parameter monotonously increases as concentration of erbium grows (Table 1). The nonlinearity of the concentration–parameter relation is caused by the heterovalent nature of the substitution and vacancies formation induced by the presence of dopant ions. | ||
| Fig. 1 XRD patterns of ZrO2-x mol% Er2O3 (PDF-01-072-2742 – cubic phase;55 PDF-01-088-1007 – tetragonal phase56) (a) and CaF2-x mol% ErF3 (PDF-01-071-4110 – cubic phase57) (b) (x = 5–25) concentration series. | ||
| x, mol% | ZrO2-x mol% Er2O3 | CaF2-x mol% ErF3 | |||
|---|---|---|---|---|---|
| a, Å | c, Å | V, Å3 | a, Å | V, Å3 | |
| 5 | 3.609 | 5.171 | 67.35 | 5.464 | 163.13 |
| 10 | 3.617 | 5.167 | 67.61 | 5.47 | 163.67 |
| 15 | 5.13 | 135.01 | 5.485 | 165.02 | |
| 25 | 5.14 | 135.79 | 5.493 | 165.7 | |
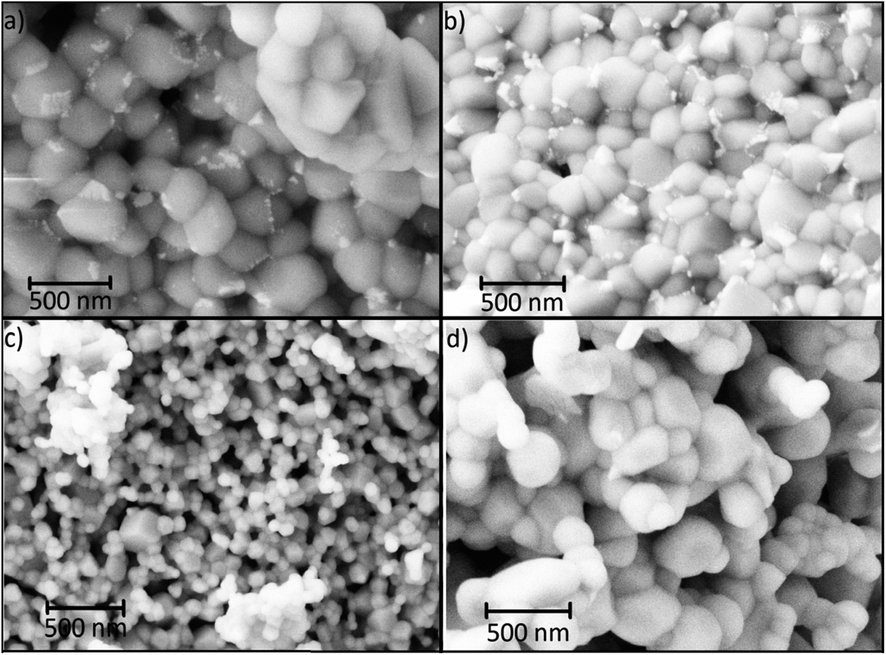
The coherent scattering domain size (CSD) for all ZrO2-x mol% Er2O3 samples was estimated before annealing with the help of Sherrer formula. It can be noted that the CSD slowly decreases from 9 nm at 5 mol% to 5 nm at 25 mol% with dopant concentration increasing. This data is in agreement with the particle size distribution that is based on TEM photos (Fig. 2). SEM data (Fig. 3) shows that after the annealing the average particle size for ZrO2-x mol% Er2O3 (x = 5, 10, 25) corresponds to the range 100–200 nm and practically does not change in the selected range of Er2O3 concentrations. Particles with x = 15 have large sizes (∼300 nm), which, apparently, is associated with annealing conditions. The particles consist of separate blocks average size of which was evaluated based on the CSD and turned out to be around 60–70 nm independently of erbium concentration. The microstrain values (ε) ranged from 2 to 6 × 10⁻⁴.
 | ||
| Fig. 2 Particle size distribution for samples of ZrO2-x mol% Er2O3 (a) x = 5; (b) x = 25 pre-annealing. TEM-images of ZrO2-x mol% Er2O3 (x = 5) before (c) and after (d) annealing at a temperature of 1200 °C. | ||
 | ||
| Fig. 3 SEM images of ZrO2-x mol% Er2O3 (a) x = 5; (b) x = 10 (c) x = 15; (d) x = 25. | ||
Structural analysis of CaF2-x mol% ErF3 also showed lattice parameter increasing with rise of erbium content (Table 1). Average CSD size was around 90 nm and the microstrain values (ε) ranged from 1 to 5 × 10⁻⁴ independently of erbium concentration. Analysis of the SEM-images of CaF2-x mol% ErF3 samples (x = 5, 10, 15, 25) showed that the average nanoparticle size is about 200 nm and does not depend on the value of x (Fig. 4) with the exception of sample with x = 15 which average particle size is smaller and equal to about 100 nm. Since in synthesis method the dropping of the chloride solution was carried out manually, a certain deviation of the particle sizes from the average is normal.
 | ||
| Fig. 4 SEM-images of CaF2-x mol% ErF3 (a) x = 5; (b) x = 10; (c) x = 15; (d) x = 25. | ||
Thus, CaF2-x mol% ErF3 and ZrO2-x mol% Er2O3 solid solutions are characterized by close values of the average particle size.
Excitation of CaF2-x mol% ErF3 samples (x = 5–25) to the 4I13/2 level of Er3+ ions by continuous laser radiation with λexc = 1550 nm and power density J = 0.15 kW cm−2 led to upconversion luminescence of Er3+ ions due to transitions from excited levels of 2H11/2, 4S3/2, 4F9/2, 4I9/2 on the ground state 4I15/2 of these ions. A similar luminescence was observed for samples with x = 5–15 with an increase in J to 1.93 kW cm−2 (Fig. 5). In this case, the luminescence intensity ratio for the 2H11/2 → 4I15/2, 4S3/2 → 4I15/2 (500–570 nm) transitions and the 4F9/2 → 4I15/2 transition (630–700 nm) increases with increasing erbium content in the sample (x = 5–10). At x = 15, the relative line intensity decreases in the region of 500–570 nm, and a broad band is observed in the in the region of 600–900 nm, which is not related to the luminescence of Er3+ ions. For the CaF2-25 mol% ErF3 sample, BBE arises against the background of upconversion luminescence of Er3+ ions, and its relative intensity is lower than the intensity of the luminescence band of the 4F9/2 → 4I15/2 transition of Er3+ ions. The corresponding emission spectra of CaF2-x mol% ErF3 samples (x = 5–25) upon laser excitation with J = 1.93 kW cm−2 are presented in Fig. 5. For greater clarity, the spectra are presented without adjusting for the spectral sensitivity of the setup.
 | ||
| Fig. 5 Emission spectra of CaF2-x mol% ErF3 (x = 5–25), λexc = 1550 nm, J = 1.93 kW cm−2. Photo on inset shows the trace of sample melting (x = 5) after arising BBE, scale bar corresponds to 2 mm. | ||
Since the morphology and particle sizes of CaF2-x mol% ErF3 with x = 25, 10, and 5 are practically the same (Fig. 4), the main factor determining the differences in the emission spectra of these samples under identical excitation conditions (Fig. 5) is the concentration of RE ions in them. The difference in the particle sizes of the sample with x = 15 did not lead to significant differences in its emission spectra from the spectra of samples with x = 10 and 5. Analysis of emission spectra for samples with x = 5–25 can reveal small changes in the ratio of peak intensity for the main emission band (4F9/2 to 4I15/2). As mentioned in the introduction, the formation of RE ion clusters is characteristic of this type of compounds. In samples with different contents of RE ions, the cluster structure will have some differences, which, in turn, can lead to observed differences in spectra.
It should be noted that the buildup time of BBE in CaF2-x mol% ErF3 (x = 25) to a maximum intensity is more than 9 seconds (Fig. 6), which significantly exceeds the buildup time (0.2 s) for ErPO4 nanoparticles.8 In this case, at the initial stages after switching on the excitation source, a red glow was observed, which is characteristic of the luminescence of Er3+ ions due to the 4F9/2 → 4I15/2 transition. A similar character of buildup was noted earlier in ref. 5 and by us in ref. 7 and 8.
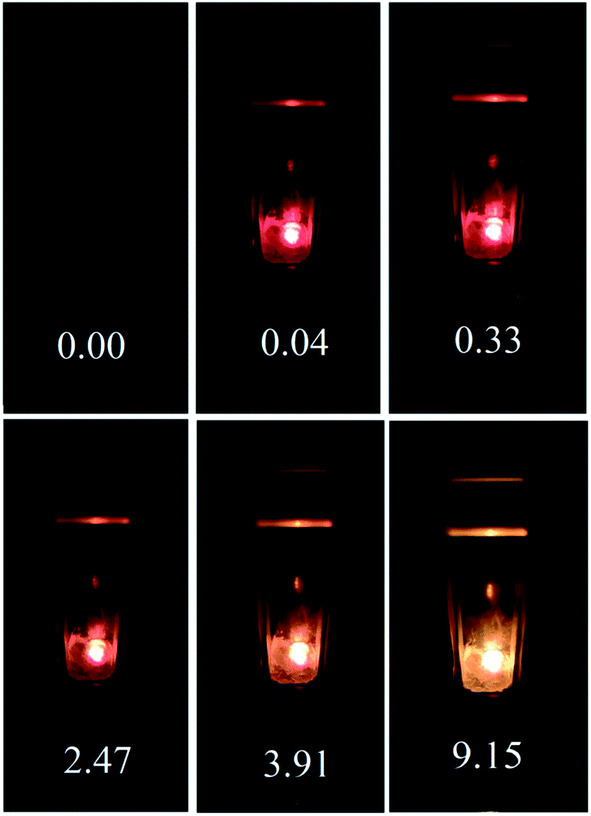 | ||
| Fig. 6 Temporal dynamics of the emission color for a CaF2-25 mol% ErF3 sample, λexc = 1550 nm, J = 1.93 kW cm−2. The numbers in the figure indicate the time (in seconds) after turning on the laser. | ||
After correcting the BBE spectrum of the CaF2-25 mol% ErF3 sample for instrumental response, the color temperature Tc of this emission was estimated using the method described in ref. 35 and was about 1800 K. It should be noted that regions with traces of melting were observed on the surface of the CaF2-25 mol% ErF3 sample after exposure to laser radiation with J = 1.93 kW cm−2. This indicates local heating of CaF2-25 mol% ErF3 particles to the melting temperature (1691 K36). In CaF2-x mol% ErF3 (x = 1–15) samples, no traces of melting were found after a same irradiation.
The study of the spectral and luminescent characteristics of ZrO2-x mol% Er2O3 (x = 5–25) compounds revealed a number differences from the characteristics of CaF2-x mol% ErF3 (x = 1–25) under identical excitation conditions. Fig. 5 shows the emission spectra of ZrO2-x mol% Er2O3 (x = 5–25), recorded upon excitation to the 4I13/2 level of Er3+ ions by laser radiation with λexc = 1550 nm and J = 0.89 kW cm−2.
Fig. 7(a) demonstrates that, at the indicated J, upconversion luminescence of Er3+ ions is observed for samples with x = 5, 10, and intense BBE is observed for samples with x = 15, 25. The dip in the 600–650 nm region of the emission spectra of ZrO2-x mol% Er2O3 (x = 15, 25) is associated with the features of the recording system, and the dips in the ranges of 500–550, 650–700 and 780–820 nm is due to the reabsorption of radiation by Er3+ ions. As J increases to 1.1 kW cm−2, BBE is already detected in all ZrO2-x mol% Er2O3 (x = 5, 10, 15, 25) samples. The I(P) dependence for BBE in all samples is nonlinear and the slope is 5.8–6.2, as for the previously studied ErPO4 powders.8 As an illustration, this dependence is presented for the ZrO2-25 mol% Er2O3 sample in Fig. 7(b). As in the case of fluoride particles, the morphology and particle sizes of ZrO2-x mol% Er2O3 with x = 25, 10, and 5 do not differ significantly (Fig. 3), which allows us to relate the differences in the behavior of the emission spectra of these samples (under identical excitation conditions) with different RE ions content in them. As noted in the manuscript, the particle size of the sample with x = 15 is slightly different from the rest of the samples, however, its spectral-luminescent properties are close to the properties of the sample with x = 25 (Fig. 7).
 | ||
| Fig. 7 Emission spectra of ZrO2-x mol% Er2O3 (x = 5, 10, 15, 25), λexc = 1550 nm, J = 0.89 kW cm−2 (a). Photo on inset shows the trace of sample melting (x = 5) after arising BBE, scale bar corresponds to 2 mm. Intensity of broadband radiation versus the pump power for ZrO2-25 mol% Er2O3 (b). | ||
The buildup character of BBWE in ZrO2-x mol% Er2O3 (x = 5, 10, 15, 25) compounds is also similar to that observed in Y0.95(1−x)Yb0.95xEr0.05PO4, Y0.95(1−x)Yb0.95xEr0.05PO4·0.8H2O nanopowders and is described in ref. 7 and 24. As an illustration, Fig. 8 shows the temporal dynamics of the emission color of the ZrO2-5 mol% Er2O3 sample, the numbers in the figure indicate the time (in seconds) after the laser was turned on.
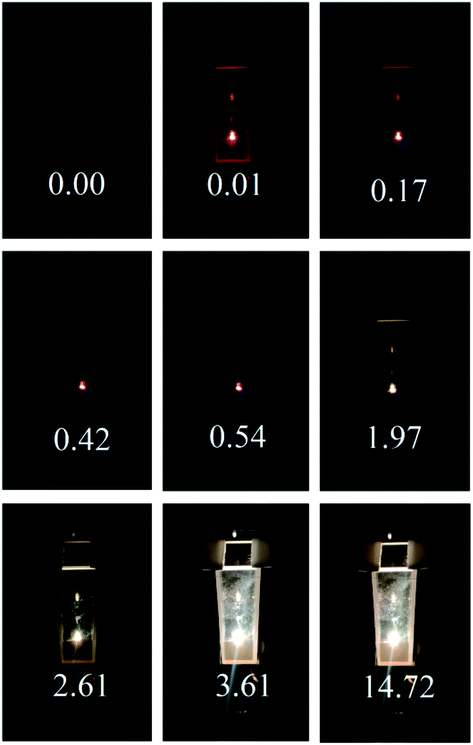 | ||
| Fig. 8 Temporal dynamics of the emission color for a ZrO2-5 mol% Er2O3 sample, λexc = 1550 nm, J = 1.1 kW cm−2. The numbers indicate the time (in seconds) after the laser was turned on. | ||
It can be seen that, at the initial moment after switching on the excitation source with J = 1.1 kW cm−2, up-conversion luminescence of Er3+ ions is observed in nanoscale crystalline powders ZrO2-5 mol% Er2O3. BBE in these compounds appears 0.23 s after switching on the excitation source, and reaches a maximum intensity in 3.6 s, which is almost three times faster than in CaF2-25 mol% ErF3.
After correction the BBE spectra of the ZrO2-x mol% Er2O3 (x = 5, 10, 15, 25) concentration series for J equal to 0.89, 1.45, 1.93 kW cm−2, we estimated the emission color temperatures Tc, which corresponded to the range of 2200–2720 K.
A comparison of BBE spectra of ZrO2-x mol% Er2O3 and the spectrum of the tungsten lamp (color temperature of 2850 K) revealed similarity of their forms. As an illustration, Fig. 9 shows the emission spectra of CaF2-25 mol% ErF3, ZrO2-25 mol% Er2O3 samples and the TRSH-2850 tungsten lamp, as well as the spectra of Y0.75Er0.25PO4 and Y0.75Er0.25VO4 (ref. 8) particles without correction for instrumental response.
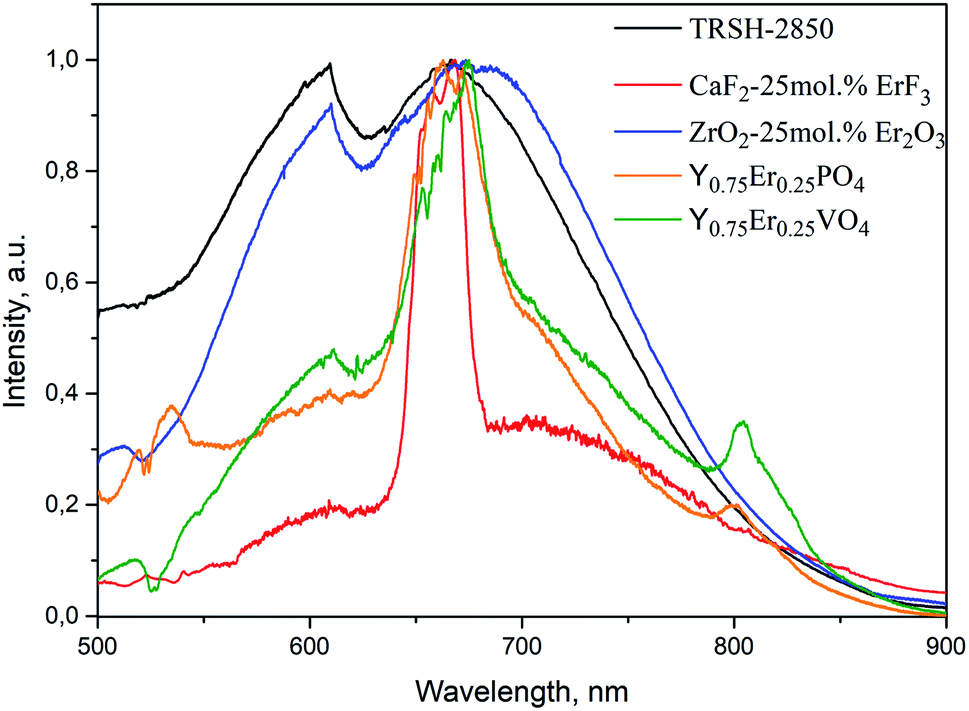 | ||
| Fig. 9 Emission spectra of CaF2-25 mol% ErF3 (J = 1.93 kW cm−2), ZrO2-25 mol% Er2O3 (J = 0.89 kW cm−2), Y0.75Er0.25PO4 (J = 1.39 kW cm−2),8 Y0.75Er0.25VO4 (J = 0.52 kW cm−2)8 (λexc = 1550 nm), and the TRSH-2850 tungsten lamp. | ||
As noted above, in ref. 7 and 8 we presented an occurrence mechanism of blackbody emission in nanoscale orthophosphate and orthovanadate dielectric particles doped with RE ions. This mechanism includes a number of processes (Fig. 10). When nanoparticles are excited by laser radiation with a high power density to the absorption band of the RE ions, nonlinear interaction of these ions occurs and leads to population of their high energy levels (1). Further, ions excited to high energy levels interact with defects in the crystal structure (2), for example, with surface defects. Then, the electrons pass from the energy levels of defects into the conduction band and their interaction with the lattice phonons (3) results to the nanoparticle heating, which, in turn, leads to the BBWE appearance. An analysis of the characteristics of this emission for the ZrO2-x mol% Er2O3 and CaF2-x mol% ErF3 particles studied in this work allows us to conclude that the our proposed mechanism is also applicable to these particles.
 | ||
| Fig. 10 Scheme of the processes leading to the appearance of thermal emission in nanoscale ZrO2-x mol% Er2O3 and CaF2-x mol% ErF3 crystals under laser excitation (λexc = 1550 nm). | ||
Now we analyze the effect of some physical characteristics and geometric factors of CaF2-25 mol% ErF3, ZrO2-25 mol% Er2O3, Y0.75Er0.25PO4,8 Y0.75Er0.25VO4 (ref. 8) nanoparticles on the conditions of the BBE appearance in them and its characteristics.
Since BBWE is observed in dielectric particles doped with RE ions when they are excited by laser radiation of a certain intensity in the absorption bands of these ions, the conditions for its occurrence may depend on the absorption and scattering coefficients of the radiation at an excitation wavelength. However, evaluative studies using diffuse optical spectroscopy revealed that there are no cardinal differences at the excitation wavelength in the absorption spectra of CaF2-25 mol% ErF3, ZrO2-25 mol% Er2O3, Y0.75Er0.25PO4, Y0.75Er0.25VO4 samples. As confirmation, Fig. 11 shows the diffuse reflection spectra of these samples converted using the Kubelka–Munk formula.37
 | ||
| Fig. 11 Diffuse reflection spectra of CaF2-25 mol% ErF3, ZrO2-25 mol% Er2O3, Y0.75Er0.25PO4, Y0.75Er0.25VO4. | ||
The next feature of nanoparticles, which can affect their spectral and luminescent properties, is a high surface to volume ratio.38 This feature leads to an increase in the fraction of near-surface RE ions with an environment different from the environment of ions inside the particle. However, for our studied particle size range, such an effect will be insignificant.39 As noted above, the average particle sizes of CaF2-25 mol% ErF3 are 200 nm, ZrO2-25 mol% Er2O3 are 100–200 nm, and the particle sizes of Y0.75Er0.25PO4 and Y0.75Er0.25VO4 correspond to ranges 20–50 and 40–100 nm.8
In ref. 8, we also suggested that the material band gap (Eg) affects the appearance of thermal emission. The band gap affects the number of transitions that an electron must undergo in order to get into the conduction band. In order to be at the high energy level corresponding to the energy level of the structural defect, the electron will need to overcome a larger number of transitions in a compound with large Eg than in a compound with a smaller Eg. For clarity, Table 2 shows the band gap values (Eg) and melting temperatures (Tm) of the materials, the threshold power density of the exciting radiation (Jthr), as well as BBE color temperatures (Tc). The threshold power density of the exciting radiation (Jthr) was estimated from the I(P) dependence.
| Compound | Eg, eV | Jthr, kW cm−2 | Tc, K | Tm, K | ν, cm−1 |
|---|---|---|---|---|---|
| CaF2-25 mol% ErF3 | 12 (ref. 19) | 1.93 | 1800 | 1691 (ref. 36) | 443 (ref. 40) |
| Y0.75Er0.25PO4 | 8.6–9.2 (ref. 15 and 16) | 1.39 (ref. 8) | 2400 (ref. 8) | 2173 (ref. 41) | 1061 (ref. 42) |
| ZrO2-25 mol% Er2O3 | 4.6–4.7,28,29 5.49–5.8 (ref. 27 and 30) | 0.89 | 2200 | 2973 (ref. 43) | 625 (ref. 44) |
| Y0.75Er0.25VO4 | 3.4–3.8 (ref. 17 and 18) | 0.52 (ref. 8) | 1800 (ref. 8) | 2083 (ref. 45) | 891 (ref. 20) |
The table shows that the smallest Jthr value corresponds to Y0.75Er0.25VO4 with the narrowest band gap. As noted in ref. 8, with a further increase in J, the BBE arising in these materials became unstable. This fact, apparently, is associated with the particle recrystallization as a result of significant heating in the region of BBE occurence. With increasing Eg, the value of J also increases.
Excitation of compounds with RE ions can lead not only to luminescence of these ions, but also to nonradiative relaxation processes, which will lead to additional heating of the samples. As noted in the introduction, some authors12,31 attribute the occurrence of thermal “white” emission precisely to these processes. In our case, when erbium-containing nanoparticles are excited to the 4I13/2 level of Er3+ ions, the probability of nonradiative relaxation from this level to the 4I15/2 ground state is close to zero, since the energy gap between these levels (6500 cm−1) is several times higher than vibrational quantum ν (Table 2). Excitation of Er3+ ions to the 4I13/2 level also leads to population of higher levels, the probability of nonradiative relaxation from which is nonzero. In ref. 8, we directly excited to one of these levels (2H11/2), but no BBE was observed. This allowed us to conclude that nonradiative relaxation does not play a major role in its appearance. If nonradiative relaxation from excited levels of RE ions played a significant role in increasing the temperature of the samples, then thermal emission would be most pronounced for compounds with a large value of ν and would be less pronounced for materials with small ν. However, as follows from Table 2, despite the fact that ν values for ZrO2-25 mol% Er2O3 and Y0.75Er0.25PO4 are two times different, the BBWE color temperatures in these compounds are close. Apparently, the presence of defects in the crystal structure, in particular, oxygen vacancies, is a more important factor affecting the conditions for the appearance of BBE in ZrO2-x mol% Er2O3 nanopowders.
The influence of defects on the conditions for the appearance of thermal emission is clearly seen in the analysis of its features in ZrO2-25 mol% Er2O3 nanoparticles. Fig. 7 shows that the BBWE in ZrO2-25 mol% Er2O3 has the highest relative intensity, while in CaF2-25 mol% ErF3, Y1−xErxPO4, Y(1−x)ErxVO4 (x = 0.25) it has a background character. Moreover, the considered emission appeared in ZrO2-x mol% Er2O3 even at low x values (5, 10), which was not observed for other samples in the available range of J. As noted in the introduction, heterovalent substitution of Zr4+ ions by Er3+ ions leads to the appearance of oxygen vacancies in ZrO2–M2O3, structural defects, which are characterized by energy levels near the conduction band.27–30,46,47 According to studies, the energy levels of oxygen vacancy is located at 2.5–2.6 eV (19![[thin space (1/6-em)]](https://www.rsc.org/images/entities/char_2009.gif) 600–20300 cm−1), 3.3–3.8 eV (∼25800–29700 cm−1) and 4–5 eV (∼31200–39000 cm−1).27,28,47 X-ray phase analysis of the ZrO2-x mol% Er2O3 (x = 5–25) concentration series confirmed (Fig. 1) that synthesized nanoparticles are single-phase and correspond to the structural types which are typical for ZrO2–M2O3 compounds with similar RE content. Consequently, the synthesized compound will possess typical features for this structure, in particular, it will be characterized by the presence of defects. The presence of a significant number of such defects ZrO2-25 mol% Er2O3 and their interaction with Er3+ ions excited to high energy levels will greatly contribute to the appearance of electrons in the conduction band.
600–20300 cm−1), 3.3–3.8 eV (∼25800–29700 cm−1) and 4–5 eV (∼31200–39000 cm−1).27,28,47 X-ray phase analysis of the ZrO2-x mol% Er2O3 (x = 5–25) concentration series confirmed (Fig. 1) that synthesized nanoparticles are single-phase and correspond to the structural types which are typical for ZrO2–M2O3 compounds with similar RE content. Consequently, the synthesized compound will possess typical features for this structure, in particular, it will be characterized by the presence of defects. The presence of a significant number of such defects ZrO2-25 mol% Er2O3 and their interaction with Er3+ ions excited to high energy levels will greatly contribute to the appearance of electrons in the conduction band.
It should be noted that an important role in the population of the upper energy levels of Er3+ ions is played by the resonances in the energy level system, as well as the interaction probability of ions with each other. This probability increases with decreasing distance between ions and with increasing their concentration. In addition, the interaction processes will proceed more intensively with an increase in the excitation power density. The effective interaction of Er3+ ions in all samples studied both in this work and earlier8 is evidenced by the presence of upconversion luminescence of these ions. Also, a clear dependence of the BBWE occurrence on the RE ions content is observed for all the studied samples. This is due to the fact that, at low concentrations of these ions, the processes of interaction between them and with defects are not intense enough to transfer a significant number of electrons into the conduction band. In CaF2-x mol% ErF3 compounds, the described interaction will be more effective due to the clustering of RE ions.21,22 Nevertheless, according to the results presented above, the process of the appearance of BBWE in these compounds is less pronounced in comparison with other compounds. This fact is an additional confirmation that the value of Eg is a significant factor.
To summarize, we can list the main factors affecting the conditions for the BBE appearance in dielectric nanoparticles doped with RE ions when they are excited by intense laser radiation. These include the band gap of the material and the presence of defects in its crystal structure. Also, one cannot exclude the effect of the RE ions absorption at the excitation wavelength.
The obtained results are not only of fundamental importance, but can also be used in practice, for example, in dermatology, to remove skin neoplasms. Currently, infrared (IR) lasers are the most common in this area, and their radiation is delivered to the tissue via optical fiber, which allows both contactless and contact effects on biological tissue to be realized.48–54 To increase the thermal effect during contact exposure and increase the efficiency of the procedure, “blackening” of the fiber end face is proposed.51 Such a modification does not provide for the reuse of fiber and increases the cost of the procedure. Coating the biological tissue with ZrO2-x mol% Er2O3 nanoparticles, which are bioinert, can act as an alternative way of enhancing the thermal effect of the contactless IR irradiation. This method will also allow the use of radiation sources with a relatively low power (∼1–2 W), which will positively affect the cost of the procedure.
4. Conclusion
In this work, we studied the features of broadband “white” emission in CaF2-x mol% ErF3 and ZrO2-x mol% Er2O3 nanoparticles upon their excitation by laser radiation with λexc = 1550 nm. In CaF2-x mol% ErF3 nanoparticles, this emission arose at an erbium concentration of 25 mol% and an excitation power density J equal to 1.93 kW cm−2 and had a background character with respect to the luminescence bands of Er3+ ions due to 2H11/2, 4S3/2, 4F9/2, 4I9/2 transitions to the ground state 4I15/2 of these ions. In ZrO2-x mol% Er2O3 nanoparticles (15, 25), the indicated emission was observed at a lower value of J (0.89 kW cm−2), and when J increased to 1.1 kW cm−2, it also appeared in samples with x = 5, 10.Comparison of the results obtained in this study with those obtained earlier for erbium-containing particles of orthophosphates and orthovanadates,8 confirmed the nature and the mechanism of the appearance of “white” emission that we proposed. We have revealed the dependence of the threshold excitation power density necessary for its appearance on the band gap of the material and found that this parameter is one of the dominant ones. Also, by the example of ZrO2-x mol% Er2O3 nanoparticles, it was demonstrated that the presence of crystal structure defects is the next key factor contributing to the appearance of thermal emission.
Conflicts of interest
There are no conflicts to declare.Acknowledgements
This work was supported by the Russian Foundation for Basic Research (grant number 19-32-90135), the Ministry of Science and Higher Education within the State assignment FSRC “Crystallography and Photonics” RAS in part of electron microscopy.References
- S. M. Redmond, S. C. Rand and S. L. Oliveira, Appl. Phys. Lett., 2004, 85, 5517 CrossRef CAS.
- L. Marciniak, W. Strek, D. Hreniak and Y. Guyot, Appl. Phys. Lett., 2014, 105, 173113 CrossRef.
- W. Strek, L. Marciniak, A. Bednarkiewicz, A. Lukowiak, R. Wiglusz and D. Hreniak, Opt. Express, 2011, 19, 14084 CrossRef PubMed.
- J. Wang and P. A. Tanner, J. Am. Chem. Soc., 2010, 132, 947 CrossRef CAS PubMed.
- S. Redmond, S. C. Rand, X. L. Ruan and M. Kaviany, J. Appl. Phys., 2004, 95, 4069 CrossRef CAS.
- J.-F. Bisson, D. Kouznetsov, K.-I. Ueda, S. T. Fredrich-Thornton, K. Petermann and G. Huber, Appl. Phys. Lett., 2007, 90, 201901 CrossRef.
- S. A. Khrushchalina, P. A. Ryabochkina, V. M. Kyashkin, A. S. Vanetsev, O. M. Gaytko and N. Yu Tabachkova, JETP Lett., 2016, 103, 302–308 CrossRef CAS.
- S. A. Khrushchalina, P. A. Ryabochkina, M. N. Zharkov, V. M. Kyashkin, N. Y. Tabachkova and I. A. Yurlov, J. Lumin., 2019, 205, 560–567 CrossRef CAS.
- A. V. Egorysheva, O. M. Gajtko, S. V. Golodukhina, S. A. Khrushchalina, P. A. Ryabochkina, A. D. Taratynova and I. A. Yurlov, Ceram. Int., 2019, 45, 16886–16892 CrossRef CAS.
- Y. Hikichi, T. Sasaki, K. Murayama, T. Nomura and M. Miyamoto, J. Am. Ceram. Soc., 1989, 72, 1073 CrossRef CAS.
- M. R. N. Soares, M. Ferro, F. M. Costa and T. Monteiro, Nanoscale, 2015, 7(47), 19958–19969 RSC.
- J. Wang, T. Ming, Z. Jin, J. Wang, L.-D. Sun and C.-H. Yan, Nat. Commun., 2014, 5(1), 1–8 CAS.
- S. Tabanli, H. Cinkaya Yilmaz, G. Bilir, M. Erdem, G. Eryurek, B. Di Bartolo and J. Collinse, ECS J. Solid State Sci. Technol., 2018, 7(1), 3199–3210 CrossRef.
- C. I. Silva Filho, A. L. Oliveira, S. C. F. Pereira, G. F. de Sá, L. L. da Luz and S. Alves Júnior, Dalton Trans., 2018, 48(8), 2574–2581 RSC.
- W. Da-Wei, H. Shi-Hua, Y. Fang-Tian and T. Ye, Chin. Phys. C, 2009, 33, 1019–1022 CrossRef.
- J. J. Bos, P. Dorenbos, A. Bessière and B. Viana, Radiat. Meas., 2008, 43, 222–226 CrossRef.
- A. H. Krumpel, E. van der Kolk, E. Cavalli, P. Boutinaud, M. Bettinelli and P. Dorenbos, J. Phys.: Condens. Matter, 2009, 21, 115503 CrossRef PubMed.
- Y. Fujimoto, T. Yanagida, Y. Yokota, V. Chani, V. V. Kochurikhin and A. Yoshikawa, Nucl. Instrum. Methods Phys. Res., Sect. A, 2011, 635, 53–56 CrossRef CAS.
- H. Shi, R. I. Eglitis and G. Borstel, Phys. Rev., 2005, 72, 045109 Search PubMed.
- S. A. Miller, H. H. Caspers and H. E. Rast, Phys. Rev., 1968, 168, 964 CrossRef CAS.
- B. P. Sobolev, A. M. Golubev and P. Herrero, Crystallogr. Rep., 2003, 48(1), 141–161 CrossRef CAS.
- S. A. KazanskiÏ, JETP Lett., 1983, 38, 521 Search PubMed.
- N. I. Sorokin and B. P. Sobolev, Phys. Solid State, 2019, 61, 2034 CrossRef CAS.
- P. A. Ryabochkina, S. A. Khrushchalina, V. M. Kyashkin, A. S. Vanetsev, O. M. Gaytko and N. Yu Tabachkova, JETP Lett., 2016, 103, 743–751 CrossRef CAS.
- F. Auzel, Chem. Rev., 2004, 104, 139 CrossRef CAS PubMed.
- L. Marciniak, R. Tomala, M. Stefanski, D. Hreniak and W. Strek, J. Rare Earths, 2016, 34, 227–234 CrossRef CAS.
- N. Nicoloso, A. Löbert and B. Leibold, Sens. Actuators, B, 1992, 8(3), 253–256 CrossRef CAS.
- E. D. Wachsman, N. Jiang, C. W. Frank, D. M. Mason and D. A. Stevenson, Appl. Phys. A: Solids Surf., 1990, 50(6), 545–549 CrossRef.
- V. R. PaiVerneker, A. N. Petelin, F. J. Crowne and D. C. Nagle, Phys. Rev. B: Condens. Matter Mater. Phys., 1989, 40(12), 8555–8557 CrossRef CAS PubMed.
- C. Ricca, A. Ringuedé, M. Cassir, C. Adamoa and F. Labat, RSC Adv., 2015, 5, 13941–13951 RSC.
- F. González, R. Khadka, R. López-Juárez, J. Collins and B. Di Bartolo, J. Lumin., 2018, 198, 320–326 CrossRef.
- B. P. Sobolev, The Rare Earth Trifluorides. Part 1. The High Temperature Chemistry of the Rare Earth Trifluorides, ed. B. P Sobolev, Barcelona: Institut d`Estudis Catalans, 2000, p. 530, ISBN 84-7283-518-9 Search PubMed.
- P. P. Fedorov and B. P. Sobolev, J. Less-Common Met., 1979, 63(1), 31–43 CrossRef CAS.
- V. O. Veselova, I. A. Yurlov, P. A. Ryabochkina and A. V. Egorysheva, Russ. J. Inorg. Chem., 2020, 65 Search PubMed , in press.
- A. N. Magunov, Instrum. Exp. Tech., 2009, 52, 451–472 CrossRef.
- P. A. Popov, P. P. Fedorov and V. V. Osiko, Phys. Solid State, 2010, 52, 504–508 CrossRef CAS.
- G. Kortüm and J. Vogel, Z. Phys. Chem., 1958, 18, 230 CrossRef.
- P. C. S. Filho and O. A. Serra, J. Phys. Chem., 2011, 115, 636 Search PubMed.
- H.-D. Nguyen, S.-i. Mho and I.-H. Yeo, J. Lumin., 2009, 129, 1754–1758 CrossRef CAS.
- K. Tahvildari, M. Esmaeilipour, S. Ghammamy and H. Nabipour, Int. J. Nano Dimens., 2012, 2(4), 269–273 CAS.
- Y. Hikichi and T. Nomura, J. Am. Ceram. Soc., 1987, 70, 252 Search PubMed.
- G. M. Begun, G. W. Beall, L. A. Boatner and W. J. Gregor, J. Raman Spectrosc., 1984, 11, 273–278 CrossRef.
- V. V. Osiko, M. A. Borik and E. E. Lomonova, Technique Springer Handbook of crystal growth, 2010, ch. 14, vol. 353, pp. 432–477 Search PubMed.
- C. M. Phillippi and K. S. Mazdiyasni, J. Am. Ceram. Soc., 1971, 54(5), 254–258 CrossRef CAS.
- E. M. Levin, J. Am. Ceram. Soc., 1967, 50(7), 381–382 CrossRef CAS.
- X. Li, X. Mao, M. Feng, J. Xie, B. Jiang and L. Zhang, J. Eur. Ceram. Soc., 2016, 36(16), 4181–4184 CrossRef CAS.
- A. S. Foster, V. B. Sulimov, F. Lopez Gejo, A. L. Shluger and R. M. Nieminen, Phys. Rev. B: Condens. Matter Mater. Phys., 2001, 64, 224108 CrossRef.
- A. Klein, W. B. Umler, M. Landthaler and P. Babilas, Int. J. Hyperthermia, 2011, 27(8), 762–770 CrossRef PubMed.
- B. Azadgoli and R. Y. Baker, Ann. Transl. Med., 2016, 4(23), 452 CrossRef PubMed.
- J. N. Pozner and B. E. DiBernardo, Clin. Plast. Surg., 2016, 43(3), 515–525 CrossRef PubMed.
- A. V. Belikov, M. L. Gelfond, K. V. Shatilova, S. A. Sosenkova and A. A. Lazareva, Proc. of SPIE-OSA Biomedical Optics, 2015, vol. 9542, p. 95420 Search PubMed.
- W. G. Stebbins, C. W. Hanke and J. Petersen, Dermatol. Ther., 2011, 24, 125–130 CrossRef PubMed.
- A. N. Kassab and A. E. Kharbotly, Eur. Arch. Oto-Rhino-Laryngol., 2012, 269, 419–423 CrossRef PubMed.
- U. Wollina, Indian J. Dermatol., 2016, 61(5), 540–544 CrossRef PubMed.
- G. Katz, J. Am. Ceram. Soc., 1971, 54, 531 CrossRef CAS.
- J. Malek, L. Benes and T. Mitsuhashi, Powder Diffr., 1997, 12, 96 CrossRef CAS.
- H. E. Swanson and E. Tatge, Natl. Bur. Stand. Circ., 1953, 539, 69 Search PubMed.
| This journal is © The Royal Society of Chemistry 2020 |