 Open Access Article
Creative Commons Attribution 3.0 Unported Licence
Two-dimensional graphene–HfS2 van der Waals heterostructure as electrode material for alkali-ion batteries†
Gladys W. King'ori *ab,
Cecil N. M. Ouma
 c,
Abhishek K. Mishrad,
George O. Amolo
 b and
Nicholas W. Makaua
aUniversity of Eldoret, P.O. Box 1125 – 30100, Eldoret, Kenya. E-mail: gking.kingori@gmail.com
bTechnical University of Kenya, Haile Selassie Avenue, P.O. Box 52428 – 00200, Nairobi, Kenya
cHySA-Infrastructure, North-West University, Faculty of Engineering, Private Bag X6001, Potchefstroom, 2520, South Africa
dDepartment of Physics, School of Engineering, University of Petroleum and Energy Studies, Bidholi via Premnagar, Dehradun 248007, India
First published on 17th August 2020
Abstract
Poor electrical conductivity and large volume expansion during repeated charge and discharge is what has characterized many battery electrode materials in current use. This has led to 2D materials, specifically multi-layered 2D systems, being considered as alternatives. Among these 2D multi-layered systems are the graphene-based van der Waals heterostructures with transition metal di-chalcogenides (TMDCs) as one of the layers. Thus in this study, the graphene–hafnium disulphide (Gr–HfS2) system, has been investigated as a prototype Gr–TMDC system for application as a battery electrode. Density functional theory calculations indicate that Gr–HfS2 van der Waals heterostructure formation is energetically favoured. In order to probe its battery electrode application capability, Li, Na and K intercalants were introduced between the layers of the heterostructure. Li and K were found to be good intercalants as they had low diffusion barriers as well as a positive open circuit voltage. A comparison of bilayer graphene and bilayer HfS2 indicates that Gr–HfS2 is a favourable battery electrode system.
1 Introduction
Rechargeable battery electrode materials suffer from poor electrical conductivity and large volume expansion during repeated charge and discharge, which neutralizes their large capacity and impairs their long term electrochemical stability.1 This has led to studies on how electrode materials can be modified either via doping or creation of Gr based two-dimensional (2D) van der Waals heterostructures, notably those based on transition metal di-chalcogenides (TMDCs). 2D van der Waals heterostructures afford an opportunity to develop rechargeable battery storage systems with high rate capacity and storage density as well as cyclic stability.2,3 Due to the challenges facing electrode materials such as low gravimetric and volumetric energy densities, there is need for materials with possible higher gravimetric and volumetric energy densities. However, many of them suffer from limited electrical conductivity, slow lithium transport, large volume expansion, low thermal stability, mechanical brittleness, and dissolution as well as other unsuitable interactions with the battery electrolyte.42D materials offer several favorable properties over their 3D counterparts especially in the design of next generation devices.5,6 Graphene a pioneer 2D material has been widely investigated due to it being very thin, highly transparent, very flexible, having large surface area, outstanding conductivity7 and good stability for chemical agents.8 These properties make it suitable for transparent conducting electrodes applications7 as well as for energy storage.9 However, despite its attractive properties, the lack of finite gap has been its main caveat in nanoelectronic applications.10,11 It also exhibits severe aggregation and restacking which results in a much lower specific surface area. Low specific surface area leads to ions not accessing the surface of the electrode, and this affects an electrodes' cyclic ability.12 Additionally, Gr has low storage capacity for alkali ions.13,14
Two-dimensional transition metal dichalcogenides (2D TMDCs) on the other hand, are a family of materials whose generalized formula is MX2, where M represents transition metal and X represents the chalcogenide elements.15 These materials are almost as thin, transparent and flexible as graphene, however unlike graphene, TMDCs have a diversity of chemical compositions and structural phases that results in a broad range of electronic properties, both from the point of view of the emergence of correlated and topological phases and of the band structure character (metallic or insulating).16,17 Existence of semiconductor TMDCs means that they have the prospects for a wide range of applications.18–21 HfS2 is one such TMDC with an indirect energy band gap of ∼1.30 eV![[thin space (1/6-em)]](https://www.rsc.org/images/entities/char_2009.gif) 22 a good upper limit of mobility (∼1800 cm2 V−1 s−1),23 and bonds that are more ionic than those in MoS2.24 As a result, the charge transfer per S atom in HfS2 is expected to be higher.24
22 a good upper limit of mobility (∼1800 cm2 V−1 s−1),23 and bonds that are more ionic than those in MoS2.24 As a result, the charge transfer per S atom in HfS2 is expected to be higher.24
Monolayer TMDCs often exist in two basic phases; the trigonal prismatic referred to as the 1H and the octahedral phase referred to as the 1T phase. In the 1T phase there is the undistorted 1T phase, where the metal atom is located at the centre of an octahedral unit and distorted 1T phase (called the 1T′ phase), in which pairs of metal atoms move closer to each other perpendicularly, resulting in a quasi-one-dimensional chain-like structure consisting of distorted octahedral units as well as another distorted 1T phase (called the 1T′′ phase), in which four nearby metal atoms move closer to each other to form a new unit cell, producing repeatable diamond-like pattern.25 However, HfS2 is known to crystallize in the 1T type structure, since its other phases are unstable,26,27 thus, in this study 1T phase of HfS2 is considered.
Another important property of TMDCs is that they possess weak van der Waals interaction between the respective TMDCs layers, this makes it possible to stack different TMDCs layers to form heterostructures with new electronic properties. Graphene based heterostructures have been created by using graphene as one of the layers forming the heterostructure. This has already been done in the case of Gr/MoS2,28 Gr/WS2![[thin space (1/6-em)]](https://www.rsc.org/images/entities/char_2009.gif) 29 and Gr/VS2.30
29 and Gr/VS2.30
Studies have also reported the possibility of alkali ions intercalation in these van der Waals heterostructures with binding energies per intercalated ion as well as band gap increasing with increase in the number of intercalated ions.31,32 Alkali ion intercalation has been found to lead to the vertex of the Dirac cone shifting downward due to n-doping of the Gr monolayer by the electrons transferred from intercalated atoms.30 In addition, such heterostructures have the potential to overcome the restacking problem of pure Gr.33
In this study, using dispersion corrected density functional theory (vdW-DFT), alkali ion intercalation in Gr–HfS2 van der Waals heterostructure has been investigated to determine the interlayer binding energy, identify the minimum energy configuration of the Gr–HfS2 heterostructure as well as investigate the influence of intercalants (Li, Na and K) on the properties of the Gr–HfS2 heterostructure, among others.
2 Computational details
In this work, first-principles calculations were performed within the density functional theory (DFT) framework, as implemented in Quantum ESPRESSO code.34 The study used the Perdew–Burke–Ernzerhof (PBE) functional35 to describe the electrons exchange–correlation potentials. Interlayer van der Waals (vdW) interactions of the Gr–HfS2 systems were considered in all the calculations through the van der Waals density functional (vdW-DF2) scheme.36 To include the electron–ion interaction, norm-conserving pseudopotentials37 were used for all the atoms. Monolayers of Gr and HfS2 were obtained from their bulk counterparts whose equilibrium properties were obtained using a converged kinetic energy cut-off of 70 Ry, Gamma-centred k-point mesh of 8 × 8 × 3 for graphite and 7 × 7 × 4 for HfS2. A convergence criteria of 10−6 Ry in calculated total energies was imposed on all the systems investigated. Optimized lattice constants were obtained using the PBE functional with and without the vdW-DF2, for the purpose of illustrating the role of the van der Waals (vdW) interactions in these layered materials.Monolayer unit cells of Gr and HfS2 were then created from the bulk systems and a 15 Å vacuum was added along the direction perpendicular to the atomic planes of the bulk structures of graphite and HfS2, respectively. The vacuum helps to minimize the interaction between the layers along the c-axis. The atomic positions of the monolayer systems were relaxed keeping the volume fixed. The heterostructure was then constructed by placing the Gr monolayer on top of the HfS2 monolayer. However, due to the difference in the equilibrium lattice constants of Gr and HfS2, there was need to reduce the lattice mismatch in the created heterostructure. This was done by creating supercells of different sizes for each of the monolayers. Supercell sizes of 3 × 3 × 1 and 2 × 2 × 1 for Gr and HfS2, respectively, were used in creating the heterostructure (see Fig. 1) as this is what resulted in a small lattice mismatch between the Gr and HfS2 layers. The lattice mismatch was obtained as (eqn (1)),
 | (1) |
First-principles calculations with the climbing image nudged elastic band (CI-NEB)38 method, as implemented in the Quantum ESPRESSO transition state tools was employed to investigate the energy barrier associated with the migration of the Li, Na and K atoms through the heterostructure. For comparison, diffusion through bilayer Gr and bilayer HfS2 was also considered.
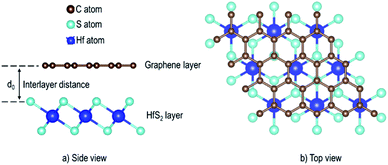 | ||
| Fig. 1 Schematic illustration of the Gr–HfS2 heterostructure with the most energetically stable configuration. | ||
3 Results and discussion
The optimized lattice constants of the bulk structures of graphite and HfS2 calculated using the PBE functional with and without the vdW-DF2 are presented in Table 1. It is observed from Table 1, that the PBE functional describes the covalent bonds inside the graphene and HfS2 fairly well, and this results in very good agreement between the values of the lattice constant ‘a’ obtained using PBE functional with and without the vdW-DF2, as well as with experimental data. It is observed from Table 1, that the calculated interlayer distances from PBE functional with vdW-DF2 scheme, for both graphite and bilayer HfS2 are in good agreement with experimentally observed interlayer distances. However, in comparison to the experimental values, PBE without vdW-DF2 significantly overestimates the interlayer distance by 0.7 Å (20.8%) and 1.08 Å (18.6%) for graphite and HfS2, respectively. This can be attributed to the fact that the covalent interactions are dominant along the plane of the structures in comparison to the weak van der Waals interactions between the layers. Therefore, inclusion or omission of vdW-DF2 scheme when determining lattice parameter ‘a’ has minimal effects, however ignoring it when determining interlayer distances, results in unreliable results.These observations indicate that the PBE functional with vdW-DF2 scheme accounts for the weak interlayer vdW interactions, and hence was adopted for the study.
The binding energy, Eb was obtained as.
 | (2) |
![[thin space (1/6-em)]](https://www.rsc.org/images/entities/char_2009.gif) 42 and graphene/hBN43,44 and 2.37% in HfS2/MoTe2.45
42 and graphene/hBN43,44 and 2.37% in HfS2/MoTe2.45
| Eb | Lattice mismatch | |
|---|---|---|
| Gr as the reference | −0.040 eV | 1.37% |
| HfS2 as a reference | 0.038 eV | 1.35% |
| Gr and HfS2 as reference | −0.017 eV | 0.70% |
Having chosen the configuration with Gr lattice constant as reference, we endeavoured to determine the equilibrium interlayer distance of this configuration. Using eqn (2), where Eb was calculated at different interlayer distances, d, it can also be argued that, a lower Eb value means a more stable heterostructure and vice versa. The calculated value of binding energies per C atom with and without van der Waals corrections at different interlayer distances are presented in Fig. 2. It is evident that the inclusion of van der Waals corrections resulted in a Lennard Jones potential-type46 with a distinct equilibrium interlayer distance. This observation was however absent in the case when van der Waals corrections were not included in the calculations, hence subsequent calculations only considered instances where van der Waals corrections were included. The plot of PBE with van der Waals corrections implies that, when the layers are bought very close, repulsive forces come into play. However, when the layers are pulled further apart, the attractive forces intended to draw the layers closer together are negligible, and hence the importance of including the vdW interactions when considering the Gr–HfS2 heterostructure.
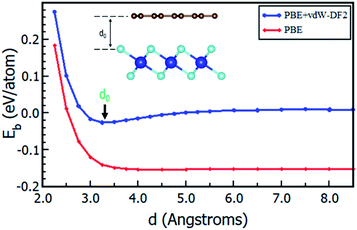 | ||
| Fig. 2 Binding energy of Gr–HfS2 van der Waals heterostructure with and without vdW-DF2 as a function of the interlayer distance, d. Image inset shows the interlayer distance, d. | ||
The calculated equilibrium interlayer distance d0 was 3.30 Å and the corresponding binding energy was −140 meV. Other studies have established that for bilayer graphene, the interlayer binding energy is −11.5 meV![[thin space (1/6-em)]](https://www.rsc.org/images/entities/char_2009.gif) 47 and −10.4 meV.48 In other analogous systems, d0 was found to be 3.33 Å for bilayer Gr,49 3.1 Å for MoS2/Gr systems,49 3.22 Å for hexagonal-Boron Nitride/Gr (h-BN/Gr) hetero-bilayer,50 3.25 Å for graphene/Pt2HgSe3 heterostructure,51 and 3.75 Å for graphene/graphene-like germanium carbide heterostructure.52 On the other hand, Eb has been reported as −78 meV for graphene/Pt2HgSe3 heterostructure,51 −28 meV for graphene/h-BN heterostructure,53 −38 meV for graphene/graphene-like germanium carbide heterostructure52 and 51 meV for Gr/MoS2 heterostructure.49 The negative binding energies of the Gr–HfS2 heterostructure confirm the thermodynamic stability of the heterostructure and the increased binding energy in comparison to that of bilayer Gr could also help overcome the restacking problem common in graphene. All subsequent calculations, were done using the obtained d0.
47 and −10.4 meV.48 In other analogous systems, d0 was found to be 3.33 Å for bilayer Gr,49 3.1 Å for MoS2/Gr systems,49 3.22 Å for hexagonal-Boron Nitride/Gr (h-BN/Gr) hetero-bilayer,50 3.25 Å for graphene/Pt2HgSe3 heterostructure,51 and 3.75 Å for graphene/graphene-like germanium carbide heterostructure.52 On the other hand, Eb has been reported as −78 meV for graphene/Pt2HgSe3 heterostructure,51 −28 meV for graphene/h-BN heterostructure,53 −38 meV for graphene/graphene-like germanium carbide heterostructure52 and 51 meV for Gr/MoS2 heterostructure.49 The negative binding energies of the Gr–HfS2 heterostructure confirm the thermodynamic stability of the heterostructure and the increased binding energy in comparison to that of bilayer Gr could also help overcome the restacking problem common in graphene. All subsequent calculations, were done using the obtained d0.
3.1 Electronic properties
The calculated band structures and their respective DOS and PDOS for Gr, HfS2 and Gr–HfS2 heterostructure are shown in Fig. 3–5. Gr is semi metallic while HfS2 is a semi conductor having a band gap of 1.30 eV.22 The monolayer of HfS2 (Fig. 3b), was found to have a direct electronic band gap of 1.45 eV, which compares well with previous studies that found the band gap to be 1.28 eV![[thin space (1/6-em)]](https://www.rsc.org/images/entities/char_2009.gif) 54 and 1.30 eV.22 As can be seen in Fig. 3, the weak interaction between the two layers in the Gr–HfS2 vdW heterostructure resulted in a vanishingly small bandgap (30.7 meV) opening at gamma point. This observation is also consistent with previous graphene based heterostructures where electronic band gaps of the same order were observed. As examples, Pelotenia et al.50 observed an electronic band gap in hexagonal Boron Nitride/Gr hetero-bilayer of 20 meV, while Yuan et al.55 found a band gap of 11 meV for Gr/WS2. Other studies have also found equally small band gaps such as 0.4 meV for Gr/MoS2.56 As can be seen in Fig. 4, the band gap opens within the region where the electronic gap for HfS2 is found. By further considering the PDOS for the heterostructure (see Fig. 5), it is observed that the electronic band gap originates from an interaction mainly between the C-p and Hf-d orbitals. It is equally important to note that a desirable electrode material ought to be a good conductor in order to facilitate the movement of electrons thus, it should possess a negligible band gap. The calculated band structures (Fig. 3) indicate that the Gr–HfS2 heterostructure has a band gap of 30.7 meV hence can function as a good electrode. This implies that an electron in the valence band of the heterostructure require very little energy (30 meV) to move to the conduction band. Electronic conductivity plays a significant role during the (de)intercalation of charge-carrying ions within an electrode material, since it influences the efficient movement of electrons and ions especially at high current rates.57 In cases when fast acceleration is needed as in electric vehicles, alkali ions and/or electrons should be able to move through the material quickly enough to utilize all stored chemical energy. The negligible electronic band gap of the Gr–HfS2 heterostructure would therefore be expected to lead to efficient movement of electrons in the electrode.
54 and 1.30 eV.22 As can be seen in Fig. 3, the weak interaction between the two layers in the Gr–HfS2 vdW heterostructure resulted in a vanishingly small bandgap (30.7 meV) opening at gamma point. This observation is also consistent with previous graphene based heterostructures where electronic band gaps of the same order were observed. As examples, Pelotenia et al.50 observed an electronic band gap in hexagonal Boron Nitride/Gr hetero-bilayer of 20 meV, while Yuan et al.55 found a band gap of 11 meV for Gr/WS2. Other studies have also found equally small band gaps such as 0.4 meV for Gr/MoS2.56 As can be seen in Fig. 4, the band gap opens within the region where the electronic gap for HfS2 is found. By further considering the PDOS for the heterostructure (see Fig. 5), it is observed that the electronic band gap originates from an interaction mainly between the C-p and Hf-d orbitals. It is equally important to note that a desirable electrode material ought to be a good conductor in order to facilitate the movement of electrons thus, it should possess a negligible band gap. The calculated band structures (Fig. 3) indicate that the Gr–HfS2 heterostructure has a band gap of 30.7 meV hence can function as a good electrode. This implies that an electron in the valence band of the heterostructure require very little energy (30 meV) to move to the conduction band. Electronic conductivity plays a significant role during the (de)intercalation of charge-carrying ions within an electrode material, since it influences the efficient movement of electrons and ions especially at high current rates.57 In cases when fast acceleration is needed as in electric vehicles, alkali ions and/or electrons should be able to move through the material quickly enough to utilize all stored chemical energy. The negligible electronic band gap of the Gr–HfS2 heterostructure would therefore be expected to lead to efficient movement of electrons in the electrode.
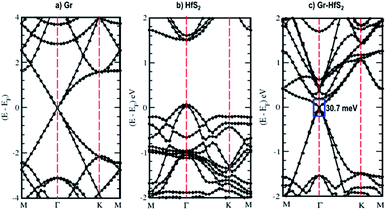 | ||
| Fig. 3 Calculated electronic band structures of 3 × 3 × 1 Gr supercell, 2 × 2 × 1 HfS2 supercell and Gr–HfS2 heterostructure system. | ||
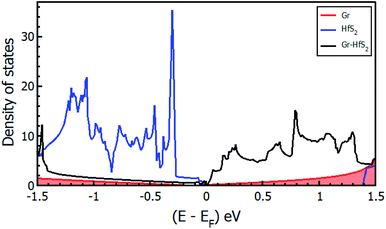 | ||
| Fig. 4 Density of states of the Gr–HfS2 heterostructure system projected on the 3 × 3 × 1 Gr supercell and 2 × 2 × 1 HfS2 supercell. | ||
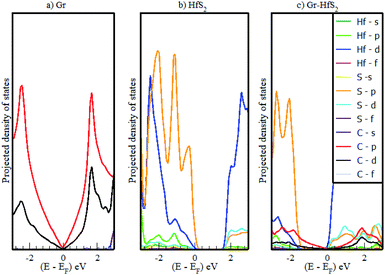 | ||
| Fig. 5 Calculated projected density of states of (a) 3 × 3 × 1 Gr supercell, (b) 2 × 2 × 1 HfS2 supercell and (c) Gr–HfS2 heterostructure system. | ||
Mapping the Gr–HfS2 heterostructure DOS onto that of Gr and HfS2 monolayers (Fig. 4), indicate that the valence band of heterostructure is dominated by the Gr layer while the conduction band is dominated by the HfS2 layer. PDOS plots (Fig. 5), indicate that the p orbital of C in Gr dominate the edges of the Dirac cone in graphene's band structure while, the d orbital of Hf formed the conduction band edge of both HfS2 monolayer as well as Gr–HfS2 heterostructure.
3.2 Work-function of the heterostructure
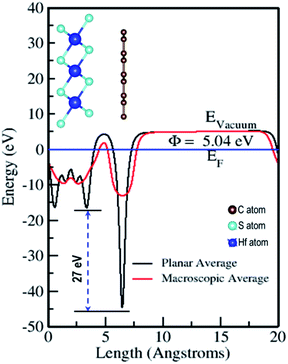
The electrostatic potential of the Gr–HfS2 heterostructure was obtained along the z-direction (Fig. 6), where the vacuum level is the region outside the surface where the potential reaches a constant (flat level). The vacuum level was determined from the calculated macroscopic and planar averages of the electrostatic potential. Using this, the work function was then calculated using the equation,| Φ = Evac − EF | (3) |
3.3 Alkali ion intercalation
Intercalation is the reversible insertion of foreign species into the gap/space of a crystal or layers. Layered materials are good host materials for various intercalant species ranging from small ions, to atoms and even to molecules.63 Layered crystals are particularly suitable for intercalation as they can strongly adsorb guest species in their van der Waals interlayer spacing(s).63 In this study, the alkali ion(s) were inserted between the two layers of the Gr–HfS2 heterostructure. A systematic study of intercalating different alkali ion species namely Li, Na and K in the Gr–HfS2 heterostructure was carried out. This was informed by the fact that alkali ions such as Li have low reduction potentials that make their intercalation in battery materials attractive. Li is also the third lightest element with one of the smallest ionic radius of 2.20 Å.64 The ionic radii of the other two alkali atoms, Na and K, are 2.25 Å and 2.34 Å, respectively.64 It was anticipated that these other alkali ions, that is Na and K, might have similar properties as Li and hence the reason for their inclusion in this study. In addition and more importantly they are considerably more accessible than lithium.65 The most energetically favorable position for the intercalants (with Li used as a test case) was established through the calculation of the binding energy with the intercalant in different positions. The binding energy in these systems was calculated as (eqn (4)),
 | (4) |
Using the configuration presented in Fig. 7, the binding energies for the system when intercalant is adsorbed on top of Gr, above HfS2 and in between the Gr and HfS2 layers of the Gr–HfS2 heterostructure were 0.4 eV, −1.0 eV and −1.6 eV, respectively, indicating that the system with Li between the layers is most stable.
 | ||
| Fig. 7 Side views of adsorption of intercalant, Li, on the Gr–HfS2 vdW heterostructure with intercalant (a) above Gr (b) above HfS2 and (c) in between Gr and HfS2 layers respectively. | ||
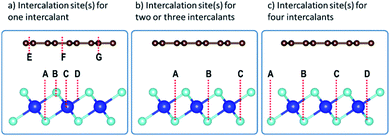
The preferred intercalation site(s) was(were) then identified by inserting the intercalant at different sites between the Gr and HfS2 layers. There are several sites accessible to the intercalant between the Gr and HfS2 layers (Fig. 8a). In determining the lowest energy intercalant site, the binding energy was calculated with the intercalant atoms at positions A, B, C, D, E, F and G as shown in Fig. 8a.
As seen in Table 3, intercalant site A was favored as it was the one with the lowest binding energy. Three other identical sites to A were determined by symmetry and were then considered as sites for adding two, three and four intercalants (Fig. 8b and c) between the layers of the heterostructure. As seen in Fig. 8b there are two distinct configurations we identified (intercalants at sites A and B and intercalant at sites A and C) that could be used to intercalate two intercalant atoms between the layers. The binding energy associated with positions A and B was −0.172 eV while that for positions A and C was −0.171 eV. As a result, intercalation of two atoms was done using a configuration similar to that of positions A and B. Only one configuration was possible for the three and four intercalant atoms intercalation (see Fig. 8b and c). The number of intercalated ions was therefore sequentially increased from 1 to 4.
| Position | Eb (eV) |
|---|---|
| A | −0.091 |
| B | −0.089 |
| C | −0.088 |
| D | −0.079 |
| E | −0.090 |
| F | −0.088 |
| G | −0.089 |
3.4 Effect of intercalant concentration
The intercalation of alkali atoms in the Gr–HfS2 heterostructure had an influence on the workfunction of the heterostructure, and this is a desirable property for energy storage media. As seen in Fig. 9, the workfunction, calculated using eqn (3), dropped with increasing intercalant concentration up to a constant value of 4.58 eV for both the Li and K intercalant species, and 4.59 eV for Na intercalant. Upon reaching this constant value, the workfunction of the heterostructure had reduced by 460 meV in the case of Li and K intercalation and 450 meV for Na intercalation. This observation is consistent with other studies including Kim et al.,66 who observed that hole doping in Gr leads to a difference in the workfunction by as much as 400 meV. When the workfunction attains a constant value, it is an indication that there is no more charge imbalance in the system resulting in no further electron flow.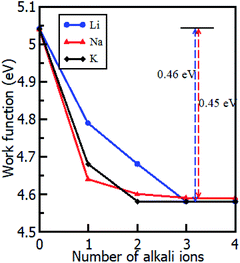 | ||
| Fig. 9 Calculated workfunction of the Gr–HfS2 heterostructure as a function of increasing intercalant concentration. | ||
The study also considered how the binding energy and interlayer distance varied as a function of the number of increasing intercalant atoms (see Fig. 10). The binding energy per atom of the intercalated systems is observed to be highest in Li intercalation and lowest in Na intercalation. Additionally, it was observed that in all instances, the calculated binding energies were negative. This suggests that Li, Na and K intercalation in the Gr–HfS2 heterostructure is indeed stable and no phase separation into individual monolayers or the formation of bulk alkali metals is expected. The binding energies per intercalant atom (Fig. 10b), gradually decrease with increasing concentration of the intercalants. This is in line with the behaviour observed in Fig. 9, where an increase in the number of intercalants resulted in a decrease in workfunction. The decrease in binding energy per intercalant atom, can be attributed to the weak electrostatic interaction between the Gr–HfS2 host and the intercalant atoms, as a result of enhanced alkali–alkali repulsion as the concentration of intercalants is increased. As the number of adatoms increases, the inter-atomic distances between positively charged ions decreases. For the Li atom the binding energy per Li atom decreases from −1.6 eV to −1.4 eV as the number of intercalated atoms increases from 1 to 4. This can be attributed to the enhanced repulsive interaction between the positively charged Li ions. For K intercalation, the binding energy per K atom initially increases from −0.9 eV to −1.3 eV upon introduction of the first and second K atoms and then decreases. This observation is consistent with an observation made by Demiroglu et al.67 for K intercalation in Ti2CO2 Mxene/Gr heterostructure.67 For K and Na intercalation, the binding energy per K/Na atoms is initially very low as compared to that of Li. This can be attributed to their ionic radii increasing the interlayer distance between the Gr–HfS2 heterostructure layers.
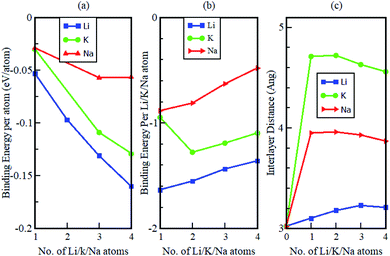 | ||
| Fig. 10 Calculated (a) binding energy per atom, (b) binding energy per intercalant atom and (c) interlayer distance d, as a function of K, Na and Li concentration in Gr–HfS2 heterostructure. | ||
The change in the interlayer distance between the two layers forming the Gr–HfS2 heterostructure increases with increasing number of Li ions peaking at 3 Li ions and decreases at 4 Li ions intercalation. For Na and K ions intercalations, the peak was at two ion intercalations (see Fig. 10c). Additionally, the maximum increase in the interlayer separation was found to be 0.21 Å for Li, 0.94 Å for Na and 1.7 Å for K which corresponded to volumetric expansion in the z-direction in the order of 6%, 31% and 56.3%, respectively. The 6% volumetric expansion in the case of Li intercalation is comparable with that of graphite anodes which is 10%.68 The 31% and 56.3%, for Na and K atoms intercalation is much lower than that for silicon based electrodes which is 280%69 or for alloy-type anodes which is 260% for germanium (Ge) and tin (Sn), and 300% for phosphorus (P).68 These observations indicate that the Gr–HfS2 heterostructure is likely to possess a reversible reaction process in the case of Li, Na and K intercalation, which is another essential property for rechargeable ion batteries. This attribute also implies that Li intercalation in Gr–HfS2 heterostructure effectively overcomes the volume expansion problem faced by electrode materials.
3.5 Alkali atom diffusion through the heterostructure
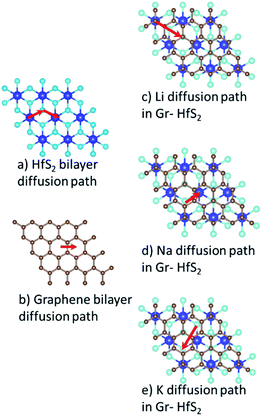
The charge/discharge rates of batteries predominantly depend on the ion diffusion in the electrode materials, which further determines the mobility of the adatoms. A smaller energy barrier facilitates faster ionic diffusion and poor diffusivity leads to significant structural damage with continued cycling, which consequently affect the lifetime of the battery.70 To investigate the migration/diffusion of the Li, Na and K atoms through the heterostructure, we first located the lowest energy site and then studied the pathways between this site and adjacent sites. Based on the length of the pathways, 3–5 images were employed between various distinct paths as shown in Fig. S2 of the ESI.† The minimum energy path between the two adjacent points gave the energy barrier between them. The energy barriers associated with the intercalants during their migration using different paths are presented in Table S1 (in the ESI).† From Table S1† it is evident that both Li and Na preferred PATH 2 while K preferred PATH 3. Bilayer Gr and HfS2 preferred PATH 1. These paths are shown in Fig. 11. From the values of Table S1 (in the ESI),† the minimum diffusion energy barrier associated with the intercalated heterostructure systems for Li, Na and K are, respectively, 0.22 eV, 0.28 eV and 0.05 eV, all these values are lower than for Li ion on graphite (0.42 eV)71 and on commercially used anode materials based on TiO2 (0.32–0.55) eV.72 The lower diffusion energy barriers on the heterostructure systems indicates higher mobility and hence improved battery performance for the heterostructure.Fig. 12 shows the respective diffusion barrier energy profiles associated with respective minimum energy paths in Fig. 11. Of note is that the diffusion energy barriers are lower in the Gr–HfS2 heterostructure compared to both bilayer Gr and HfS2. It is important to note that the diffusion path for Na through the heterostructure (see Fig. 12b) has a minimum slightly above the minimum of the other paths. This is an indication that the Na adsorbs onto a metastable site and not a global minimum at the end of its migration. The diffusion energy barriers in the heterostructure systems are lower for Na and K ions than Li for the respective minimum energy pathways due to the stronger binding of Li intercalation as seen in Fig. 10. Strong binding energies are expected to pin the atoms on the intercalant site. In order to move the intercalant between sites, a certain amount of energy is required to overcome the adsorption interaction at the site. Hence moving Li, which is the most strongly bonded metal, requires a larger energy threshold to be overcome than the equivalent process for Na and K. The increased interlayer distance in the potassium intercalated heterostructure is also expected to enhance the diffusion process, leading to the potassium intercalated heterostructure having the lowest energy barrier.
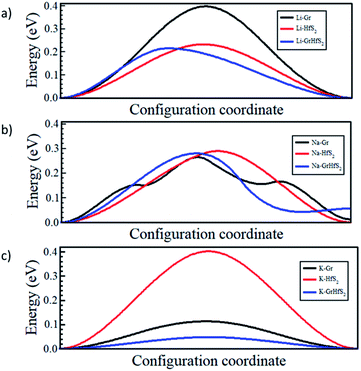 | ||
| Fig. 12 Intercalant diffusion profiles for paths shown in Fig. 11. | ||
3.6 Electrochemical properties
In order to gain insights into the electrochemical properties of the Li, Na and K intercalation process into the Gr–HfS2 heterostructure, the open-circuit-voltage (OCV) was determined. The OCV value gives a measure of the performance of a battery, and was calculated from the energy difference based on the equation:
 | (5) |
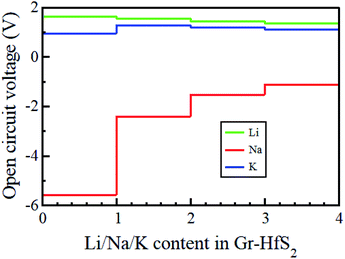 | ||
| Fig. 13 Open circuit voltage profiles of Li, Na, and K intercalation in Gr–HfS2 heterostructures as a function of alkali atom concentration. | ||
3.7 Charge density distribution and population analysis
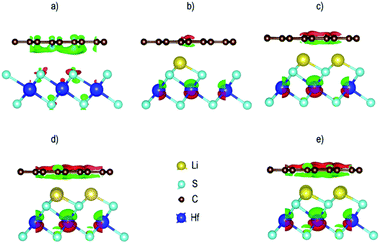
In order to understand the mechanism of the charge distribution and charge transfer between Gr and HfS2 monolayers in the Gr–HfS2 heterostructures, we calculated the charge densities difference (Δρ) using the relation (eqn (6)):| Δρ = ΔρGr/HfS2− ΔρGr − ΔρHfS2 | (6) |
![[thin space (1/6-em)]](https://www.rsc.org/images/entities/char_2009.gif) 76 and tungsten sulfide (Ws2)/Gr,77 heterostructures. It has also been shown that tungsten diselenide (WSe2) is a weak acceptor of electrons upon contact with Gr, in a WSe2/Gr heterostructure.78
76 and tungsten sulfide (Ws2)/Gr,77 heterostructures. It has also been shown that tungsten diselenide (WSe2) is a weak acceptor of electrons upon contact with Gr, in a WSe2/Gr heterostructure.78
In order to get further insight into the charge transfer between the heterostructure and the intercalated adatoms, a Lowdin population analysis was performed, and the results obtained are shown in Tables 4 and 5. It was observed that upon Li/K intercalation, charge was transferred to Li/K adatom from both the Graphene and HfS2 layers leaving them negatively charged. In both cases, the charge was mainly donated by the Gr layer than the HfS2 layer. The amount of charge transferred gradually reduced as the number of intercalants increased. This could be attributed to the increased repulsion due to decreased distance between ions as their number is increased. This in turn reduces the interaction between the ions and the host material.
| Charge difference | ||||
|---|---|---|---|---|
| 1 Li intercalants | 2 Li intercalants | 3 Li intercalants | 4 Li intercalants | |
| HfS2 | −0.273 | −0.277 | −0.310 | −0.313 |
| Gr | −0.895 | −0.886 | −0.876 | −0.779 |
| Li | 3.714 | 3.512 | 3.393 | 0.784 |
| Charge difference | ||||
|---|---|---|---|---|
| 1 K intercalants | 2 K intercalants | 3 K intercalants | 4 K intercalants | |
| HfS2 | −0.248 | −0.281 | −0.303 | −0.304 |
| C | −0.883 | −0.874 | −0.869 | −0.767 |
| k | 9.486 | 9.369 | 9.289 | 8.719 |
4 Conclusions
This study has systematically investigated the prospects of Gr–HfS2 heterostructure, as an electrode material for alkali ion (Li, Na and K) batteries, using first-principles calculations with vdW-DF2 corrections. The stability of the heterostructure upon alkali ion intercalation is confirmed by the negative binding energy values for all the intercalated atoms and also by donation of a significant amount of charge, as confirmed by both the charge density difference and Lowdin population analysis. The volumetric expansion due to the intercalant species was found to be 6%, 31% and 56.3%, for Li, Na and K, respectively, suggesting that the Gr–HfS2 heterostructure possess a reversible reaction ability. Diffusion energy barriers confirm the advantage of Gr–HfS2 heterostructure over graphene and HfS2 bilayer systems. Relatively low diffusion energy barriers ranging between 0.22–0.39 eV for Li, 0.05–0.09 eV for K and 0.28–0.74 eV for Na were determined for the intercalated Gr–HfS2 heterostructure. This implies high charge/discharge rate in battery applications. Li intercalation in Gr–HfS2 is attractive for rechargeable ion battery applications as it overcomes the volume expansion problem faced by many electrode materials. The findings of this study suggest that it is possible to develop next-generation anode materials with ultrafast charging/discharging rates using Gr–TMDC heterostructure.Conflicts of interest
There are no conflicts to declare.Acknowledgements
The authors wish to acknowledge the computer resources, technical expertise, and assistance provided by the Centre for High Performance Computing (CHPC-MATS862), Cape Town, South Africa in carrying out this work. Gladys King'ori also thank the host, Physics Department, School of Engineering, University of Petroleum and Energy Studies, during the initial work funded by the C V Raman International. George O Amolo would like to thank C V Raman International for a Senior Fellowship support to visit this Indian Institution.Notes and references
- Z. Liu, et al., Three-dimensional ordered porous electrode materials for electrochemical energy storage, NPG Asia Mater., 2019, 11, 1–21 CrossRef CAS.
- Q. Cheng, Y. Okamoto, N. Tamura, M. Tsuji, S. Maruyama and Y. Matsuo, Graphene-Like-Graphite as Fast-Chargeable and High-Capacity Anode Materials for Lithium Ion Batteries, Sci. Rep., 2017, 7, 1–14 CrossRef PubMed.
- Y. Yang, et al., The Role of Geometric Sites in 2D Materials for Energy Storage, Joule, 2018, 2, 1075–1094 CrossRef CAS.
- N. Nitta, F. Wu, J. T. Lee and G. Yushin, Li-ion battery materials: present and future, Biochem. Pharmacol., 2015, 18, 252–264 CAS.
- K. S. Kumar, N. Choudhary, Y. Jung and J. Thomas, Recent Advances in Two-Dimensional Nanomaterials for Supercapacitor Electrode Applications, ACS Energy Lett., 2018, 3, 482–495 CrossRef CAS.
- C. N. M. Ouma, K. O. Obodo, M. Braun and G. O. Amolo, Ab initio insights on the effect of embedding lanthanide atoms on nitrogenated holey doped graphene (g-C2N), J. Mater. Chem. C, 2018, 6, 4015–4022 RSC.
- W. Ren and H. M. Cheng, The global growth of graphene, Nat. Nanotechnol., 2014, 9, 726–730 CrossRef CAS PubMed.
- S. Suzuki and M. Yoshimura, Chemical Stability of Graphene Coated Silver Substrates for Surface-Enhanced Raman Scattering, Sci. Rep., 2017, 7, 1–7 CrossRef PubMed.
- Q. Ke and J. Wang, Graphene-based materials for supercapacitor electrodes – A review, J. Mater., 2016, 2, 37–54 Search PubMed.
- N. Maity, R. Ghosh and A. K. Nandi, Optoelectronic Properties of Self-Assembled Nanostructures of Polymer Functionalized Polythiophene and Graphene, Langmuir, 2018, 34, 7585–7597 CrossRef CAS PubMed.
- C. N. M. Ouma, S. Singh, K. O. Obodo, G. O. Amolo and A. H. Romero, Controlling the magnetic and optical responses of a MoS2 monolayer by lanthanide substitutional doping: A first-principles study, Phys. Chem. Chem. Phys., 2017, 19, 25555–25563 RSC.
- Z. Wu, G. Zhou, L. Yin and W. Ren, Graphene/metal oxide composite electrode materials for energy storage, Nano Energy, 2012, 1(1), 107–131 CrossRef CAS.
- X. Liu, C.-Z. Wang, M. Hupalo, H.-Q. Lin, K.-M. Ho and M. Tringides, Metals on Graphene: Interactions, Growth Morphology, and Thermal Stability, Crystals, 2013, 3(1), 79–111 CrossRef CAS.
- Y. Liu, B. V. Merinov and W. A. Goddard, Origin of low sodium capacity in graphite and generally weak substrate binding of Na and Mg among alkali and alkaline earth metals, Proc. Natl. Acad. Sci., 2016, 113(14), 3735–3739 CrossRef CAS PubMed.
- C. N. M. Ouma, K. O. Obodo, M. Braun, G. O. Amolo and D. Bessarabov, Insights on hydrogen evolution reaction in transition metal doped monolayer TcS2 from density functional theory calculations, Appl. Surf. Sci., 2019, 470, 107–113 CrossRef CAS.
- S. Manzeli, D. Ovchinnikov, D. Pasquier, O. V. Yazyev and A. Kis, 2D transition metal dichalcogenides, Nat. Rev. Mater., 2017, 2, 1–15 Search PubMed.
- C. N. M Ouma, K. O. Obodo, M. Braun, M. O. Onani and F. B. Dejene, In Silico Insights into the Tunable Magnetic Properties of Transition Metal Doped Monolayer SnS2, Open Innov. Conf. OI 2018, pp. 120–123 Search PubMed.
- E. Gibney, 2D or not 2D, Nature, 2015, 522, 274–276 CrossRef CAS.
- K. O. Obodo, C. N. M. Ouma, J. T. Obodo and M. Braun, Influence of transition metal doping on the electronic and optical properties of ReS2 and ReSe2 monolayers, Phys. Chem. Chem. Phys., 2017, 19, 19050–19057 RSC.
- K. O. Obodo, C. N. M. Ouma, G. Gebreyesus, J. T. Obodo and M. Braun, Effect of Dipole Corrections and Spin Orbit Coupling on Tungsten Dichalcogenides Monolayer: A In Silico First Principles Study, 2018 Open Innov. Conf. OI 2018, pp. 115–119 Search PubMed.
- C. N. M. Ouma, K. O. Obodo, C. Parlak and G. O. Amolo, Effect of 3d transition metal substitutional dopants and adatoms on mono layer TcS2 ab initio insights, Phys. E, 2020, 123, 114165 CrossRef CAS.
- K. O. Obodo, G. Gebreyesus and C. N. M. Ouma, Controlling the electronic and optical properties of HfS2 mono-layers via lanthanide substitutional doping: a DFT+U study, RSC Adv., 2020, 10, 15670–15676 RSC.
- T. Kanazawa, et al., Few-layer HfS2 transistors, Sci. Rep., 2016, 6, 22277 CrossRef CAS PubMed.
- J. Kang, H. Sahin and F. M. Peeters, Mechanical properties of monolayer sulphides: A comparative study between MoS2, HfS2 and TiS3, Phys. Chem. Chem. Phys., 2015, 17, 27742–27749 RSC.
- J. Zhou, et al., A library of atomically thin metal chalcogenides, Nature, 2018, 556, 355–359 CrossRef CAS PubMed.
- Y. Xiao, M. Zhou, J. Liu, J. Xu and L. Fu, Phase engineering of two-dimensional transition metal dichalcogenides, Sci. China Mater., 2019, 62, 759–775 CrossRef CAS.
- C. M. O. Bastos, R. Besse, J. L. F. Da Silva and G. M. Sipahi, Ab initio investigation of structural stability and exfoliation energies in transition metal dichalcogenides based on Ti-, V-, and Mo-group elements, Phys. Rev. Mater., 2019, 3, 11 Search PubMed.
- M. Gmitra and J. Fabian, Graphene on transition-metal dichalcogenides: A platform for proximity spin-orbit physics and optospintronics, Phys. Rev. B: Condens. Matter Mater. Phys., 2015, 92, 1–6 CrossRef.
- S.-J. Liang, B. Liu, W. Hu, K. Zhou and L. K. Ang, Thermionic Energy Conversion Based on Graphene van der Waals Heterostructures, Sci. Rep., 2017, 7, 46211 CrossRef CAS PubMed.
- N. S. Mikhaleva, M. A. Visotin, A. A. Kuzubov and Z. I. Popov, VS2/Graphene Heterostructures as Promising Anode Material for Li-Ion Batteries, J. Phys. Chem. C, 2017, 121, 24179–24184 CrossRef CAS.
- X. Shao, K. Wang, R. Pang and X. Shi, Lithium Intercalation in Graphene/MoS Composites: First-Principles Insights, J. Phys. Chem. C, 2015, 119, 25860–25867 CrossRef CAS.
- L. Shi, T. S. Zhao, A. Xu and J. B. Xu, Ab initio prediction of a silicene and graphene heterostructure as an anode material for Li- and Na-ion batteries, J. Mater. Chem. A, 2016, 4, 16377–16382 RSC.
- W. Sun and Y. Wang, Graphene-based nanocomposite anodes for lithium-ion batteries, Nanoscale, 2014, 6, 11528–11552 RSC.
- P. Giannozzi, et al., QUANTUM ESPRESSO: A modular and open-source software project for quantum simulations of materials, J. Phys. Condens. Matter, 2009, 21, 1–19 CrossRef PubMed.
- X. Xu and W. A. Goddard, The extended Perdew–Burke–Ernzerhof functional with improved accuracy for thermodynamic and electronic properties of molecular systems, J. Chem. Phys., 2004, 121, 4068–4082 CrossRef CAS PubMed.
- K. Berland, et al., van der Waals forces in density functional theory: a review of the vdW-DF method, Rep. Prog. Phys., 2015, 78, 1–46 CrossRef PubMed.
- D. R. Hamann, M. Schlüter and C. Chiang, Norm-Conserving Pseudopotentials, Phys. Rev. Lett., 1979, 43, 1494–1497 CrossRef CAS.
- G. Henkelman, B. P. Uberuaga and H. Jónsson, Climbing image nudged elastic band method for finding saddle points and minimum energy paths, J. Chem. Phys., 2000, 113, 9901–9904 CrossRef CAS.
- L. A. Girifalco and R. A. Lad, Energy of cohesion, compressibility, and the potential energy functions of the graphite system, J. Chem. Phys., 1956, 25, 693–697 CrossRef CAS.
- L. X. Benedict, N. G. Chopra, M. L. Cohen, A. Zettl, S. G. Louie and V. H. Crespi, Microscopic determination of the interlayer binding energy in graphite, Chem. Phys. Lett., 1998, 286, 490–496 CrossRef CAS.
- D. T. Hodul and A. M. Stacy, Anomalies in the properties of Hf(S2−xTex)1−y and Hf(Se2−xTex)1−y near the metal-insulator transition, J. Solid State Chem., 1984, 54, 438–446 CrossRef CAS.
- Y. T. Du, X. Kan, F. Yang, L. Y. Gan and U. Schwingenschlögl, MXene/Graphene Heterostructures as High-Performance Electrodes for Li-Ion Batteries, ACS Appl. Mater. Interfaces, 2018, 10, 32867–32873 CrossRef CAS PubMed.
- J. Zhang, W. Xie, X. Xu, S. Zhang and J. Zhao, Structural and Electronic Properties of Interfaces in Graphene and Hexagonal Boron Nitride Lateral Heterostructures, Chem. Mater., 2016, 28, 5022–5028 CrossRef CAS.
- Z. Liu, L. H. G. Tizei, Y. Sato, Y. C. Lin, C. H. Yeh, P. W. Chiu, M. Terauchi, S. Iijima and K. Suenaga, Postsynthesis of h-BN/Graphene Heterostructures Inside a STEM, Small, 2016, 12, 252–259 CrossRef CAS PubMed.
- X. Yang, X. Qin, J. Luo, N. Abbas, J. Tang, Y. Li and K. Gu, HfS2/MoTe2 vdW heterostructure: Band structure and strain engineering based on first-principles calculation, RSC Adv., 2020, 10, 2615–2623 RSC.
- R. A. Laviolette and F. H. Stillinger, Consequences of the balance between the repulsive and attractive forces in dense, non associated liquids, J. Chern. Phys., 1985, 82, 3335–3343 CrossRef CAS.
- E. Mostaani, N. D. Drummond and V. I. Fal’Ko, Quantum Monte Carlo Calculation of the Binding Energy of Bilayer Graphene, Phys. Rev. Lett., 2015, 115, 1–5 CrossRef PubMed.
- I. V. Lebedeva, A. A. Knizhnik, A. M. Popov, Y. E. Lozovik and B. V. Potapkin, Interlayer interaction and relative vibrations of bilayer graphene, Phys. Chem. Chem. Phys., 2011, 13, 5687–5695 RSC.
- A. Ebnonnasir, B. Narayanan, S. Kodambaka and C. V. Ciobanu, Tunable MoS2 bandgap in MoS2-graphene heterostructures, Appl. Phys. Lett., 2014, 105, 031603–031608 CrossRef.
- C. A. Pelotenia, S. Aspera, N. Arboleda, M. David and H. Kasai, Structural and Electronic Properties of Silicene/hexagonal-Boron Nitride/Graphene Hetero-structure, Proc. DLSU Res. Congr., 2015, 3, 1–7 Search PubMed.
- A. Bafekry, M. M. Obeid, C. V. Nguyen, M. Ghergherehchi and M. Bagheri Tagani, Graphene hetero-multilayer on layered platinum mineral jacutingaite (Pt2HgSe3): van der Waals heterostructures with novel optoelectronic and thermoelectric performances, J. Mater. Chem. A, 2020, 1–13 Search PubMed.
- S. Wang, et al., Tunable Schottky barrier in graphene/graphene-like germanium carbide van der Waals heterostructure, Sci. Rep., 2019, 9, 1–7 CrossRef PubMed.
- I. Leven, T. Maaravi, I. Azuri, L. Kronik and O. Hod, Interlayer Potential for Graphene/h-BN Heterostructures, J. Chem. Theory Comput., 2016, 12, 2896–2905 CrossRef CAS PubMed.
- B. Wang, X. Luo, J. Chang, X. Chen, H. Yuan and H. Chen, Efficient charge separation and visible-light response in bilayer HfS2-based van der Waals heterostructures, RSC Adv., 2018, 8, 18889–18895 RSC.
- L. Yuan, et al., Photocarrier generation from interlayer charge-transfer transitions in WS2 -graphene heterostructures, Sci. Adv., 2018, 4, 1–10 Search PubMed.
- S. Singh, C. Espejo and A. H. Romero, Structural, electronic, vibrational, and elastic properties of graphene/MoS2 bilayer heterostructures, Phys. Rev. B, 2018, 98, 155309–155319 CrossRef CAS.
- M. V. Reddy, G. V. Subba Rao and B. V. R. Chowdari, Metal oxides and oxysalts as anode materials for Li ion batteries, Chem. Rev., 2013, 113, 5364–5457 CrossRef CAS PubMed.
- P. Wu, M. Huang, N. Yin and P. Li, The modulation effect of MoS2 monolayers on the nucleation and growth of pd clusters: First-principles study, Nanomaterials, 2019, 9, 1–15 Search PubMed.
- D. Singh, S. K. Gupta, Y. Sonvane, A. Kumar and R. Ahuja, 2D-HfS2 as an efficient photocatalyst for water splitting, Catal. Sci. Technol., 2016, 6, 6605–6614 RSC.
- E. H. James, A. K. Ellen and L. K. Richard Inorganic Chemistry: Principles of Structure and Reactivity, Harper Collins College Publishers, New York, 4th edn, 1993 Search PubMed.
- X.-H. Li, B.-J. Wang, X.-L. Cai, L.-W. Zhang, G.-D. Wang and S.-H. Ke, Tunable electronic properties of arsenene/GaS van der Waals heterostructures, RSC Adv., 2017, 7, 28393–28398 RSC.
- M. Sun, J.-P. Chou, J. Yu and W. Tang, Electronic properties of blue phosphorene/graphene and blue phosphorene/graphene-like gallium nitride heterostructures, Phys. Chem. Chem. Phys., 2017, 19, 17324–17330 RSC.
- Z. Hu, Q. Liu, W. Sun, W. Li, Z. Tao, S. Chou, J. Chen and S. Dou, MoS2 with an intercalation reaction as a long-life anode material for lithium ion batteries, Inorg. Chem. Front., 2016, 3, 532–535 RSC.
- M. Rahm, R. Hoffmann and N. W. Ashcroft, Atomic and Ionic Radii of Elements 1–96, Chem.–Eur. J., 2016, 22, 14625–14632 CrossRef CAS PubMed.
- L. P. Wang, L. Yu, M. Srinivasan, Z. J. Xu and X. Wang, Recent developments in electrode materials for sodium-ion batteries, J. Mater. Chem. A, 2015, 3, 9353–9378 RSC.
- J. H. Kim, J. H. Hwang, J. Suh, S. Tongay, S. Kwon, C. C. Hwang, J. Wu and J. Y. Park, Work function engineering of single layer graphene by irradiation-induced defects, Appl. Phys. Lett., 2013, 103, 171604 CrossRef.
- I. Demiroglu, F. M. Peeters, O. Gulseren, D. Cakir and C. Sevik, Alkali Metal Intercalation in MXene/graphene Heterostructures, a New Platform for Ion Battery Applications, J. Phys. Chem. Lett., 2019, 2, 727–734 CrossRef PubMed.
- Y. Sun, N. Liu and Y. Cui, Promises and challenges of nanomaterials for lithium-based rechargeable batteries, Nat. Energy, 2016, 1, 1–12 Search PubMed.
- X. H. Liu, J. W. Wang, S. Huang, F. Fan, X. Huang, Y. Liu, S. Krvlvuk, J. Yoo, S. A. Dayeh, A. V. Davydov, S. X. Mao, S. T. Picraux, S. Zhang, J. Li, T. Zhu and J. Y. Huang, In situ atomic-scale imaging of electrochemical lithiation in silicon, Nat. Nanotechnol., 2012, 7, 749–756 CrossRef CAS PubMed.
- S. Mukherjee, L. Kavalsky and C. V. Singh, Ultrahigh Storage and Fast Diffusion of Na and K in Blue Phosphorene Anodes, ACS Appl. Mater. Interfaces, 2018, 10, 8630–8639 CrossRef CAS PubMed.
- S. Thinius, M. M. Islam, P. Heitjans and T. Bredow, Theoretical Study of Li Migration in Lithium–Graphite Intercalation Compounds with Dispersion-Corrected DFT Methods, J. Phys. Chem. C, 2014, 118, 2273–2280 CrossRef CAS.
- A. Kordatos, N. Kelaidis and A. Chroneos, Migration of sodium and lithium interstitials in anatase TiO2, Solid State Ionics, 2018, 315, 40–43 CrossRef CAS.
- P. Wu, P. Li and M. Huang, Potential Application of Graphene/Antimonene Herterostructure as an Anode for Li-Ion Batteries: A First-Principles Study, Nanomaterials, 2019, 9, 1–16 Search PubMed.
- S. Wang, B. Yang, H. Chen and E. Ruckenstein, Popgraphene: A new 2D planar carbon allotrope composed of 5-8-5 carbon rings for high-performance lithium-ion battery anodes from bottom-up programming, J. Mater. Chem. A, 2018, 6, 6815–6821 RSC.
- I. Demiroglu and C. Sevik, Alkali Metal Intercalation in MXene/Graphene Heterostructures: New Platform for Ion Battery Applications, J. Phys. Chem. Lett., 2019, 2019(10), 727–734 CrossRef PubMed.
- B. Qiu, X. Zhao, G. Hu, W. Yue, J. Ren and X. Yuan, Optical Properties of Graphene/MoS2 Heterostructure: First Principles Calculations, Nanomaterials, 2018, 8, 1–10 Search PubMed.
- F. Zhang, Tuning the Schottky contacts at the graphene/WS2 interface by electric field, RSC Adv., 2017, 7, 29350–29356 RSC.
- M. Sun, J. Chou, J. Yu and W. Tang, Effects of structural imperfection on the electronic properties of graphene/WSe2 heterostructures, J. Mater. Chem. C, 2017, 42–46 Search PubMed.
Footnote |
| † Electronic supplementary information (ESI) available. See DOI: 10.1039/d0ra04725b |
| This journal is © The Royal Society of Chemistry 2020 |

