 Open Access Article
Non-aqueous solvent extraction of indium from an ethylene glycol feed solution by the ionic liquid Cyphos IL 101: speciation study and continuous counter-current process in mixer–settlers†
Clio Deferm a,
Bieke Onghena
 a,
Viet Tu Nguyen
 a,
Dipanjan Banerjee
 ab,
Jan Fransaer
 c and
Koen Binnemans
 *a
*a
aKU Leuven, Department of Chemistry, Celestijnenlaan 200F, P.O. box 2404, B-3001 Leuven, Belgium. E-mail: Koen.Binnemans@kuleuven.be
bDutch-Belgian Beamline (DUBBLE), ESRF – The European Synchrotron, CS 40220, F-38043 Grenoble Cedex 9, France
cKU Leuven, Department of Materials Engineering, Kasteelpark Arenberg 44, bus 2450, B-3001 Heverlee, Belgium
First published on 29th June 2020
Abstract
A solvometallurgical process for the separation of indium(III) and zinc(II) from ethylene glycol solutions using the ionic liquid extractants Cyphos IL 101 and Aliquat 336 in an aromatic diluent has been investigated. The speciation of indium(III) in the two immiscible organic phases was investigated by Raman spectroscopy, infrared spectroscopy, EXAFS and 115In NMR spectroscopy. At low LiCl concentrations in ethylene glycol, the bridging (InCl3)2(EG)3 or mononuclear (InCl3)(EG)2 complex is proposed. At higher lithium chloride concentrations, the first coordination sphere changes to two oxygen atoms from one bidentate ethylene glycol ligand and four chloride anions ([In(EG)Cl4]−). In the less polar phase, indium(III) is present as a tetrahedral [InCl4]− complex independent of the LiCl concentration. After the number of theoretical stages had been determined using a McCabe–Thiele diagram for extraction by Cyphos IL 101, the extraction and scrubbing processes were performed in lab-scale mixer–settlers to test the feasibility of working in continuous mode. Indium(III) was extracted quantitatively in four stages, with 19% co-extraction of zinc(II). The co-extracted zinc(II) was scrubbed selectively in six stages using an indium(III) scrub solution. Indium(III) was recovered from the loaded less polar organic phase as indium(III) hydroxide (98.5%) by precipitation stripping with an aqueous NaOH solution.
Introduction
Indium is a rare metal that is labeled as a critical raw material by the European Commission, due to its high supply risk. It is produced mainly as a side product of the zinc industry.1,2 Small amounts of indium are produced by processing of copper, tin and lead ores. Indium can also be recycled from secondary indium sources such as production scrap and end-of-life consumer goods.1–3 It is mainly used in high-tech applications such as indium tin oxide (ITO) for transparent conductive coating on glass substrates of liquid-crystal display (LCD) screens, as the semiconductor compounds InGaN and InGaP in light-emitting diodes (LEDs), and as the semiconductor copper indium gallium selenide (CIGS) in photovoltaic cells. For all these applications, very pure indium metal is required, often with a purity of 99.9999% (6N) or higher. Conventional indium refining routes comprise more than 20 process steps, involving multiple dissolution and precipitation stages.1,3 For this reason, there is a strong interest from industry in the development of more efficient indium refining processes.Indium refining via solvent extraction (SX) is a very promising approach because it can be operated in a continuous process and allows one to obtain a very pure end product.4,5 Difficult to remove impurities are zinc, iron and tin. Solvent extraction is typically performed from sulfate or chloride feed solutions. The conventional extractant for indium refining by solvent extraction is bis(2-ethylhexyl)phosphoric acid (D2EHPA).6–12 Other studies on acidic extractants investigated the dialkylphosphonic acid PC88A,13 the dialkylphosphinic acid Cyanex 272,6,14,15 and the dialkyl-dithiophosphinic acid Cyanex 301.16,17 Solvating extractants tested for indium extraction include tri-n-butylphosphate (TBP),6,18 and the commercial mixtures of trialkylphosphine oxides Cyanex 923.19,20 A current trend is the use of ionic liquids, either as extractants, diluents or both, for the refining of indium by solvent extraction.21–28 In comparison to conventional molecular solvents, ionic liquids could lead to inherently safer and more sustainable separation processes because of their low flammability, high thermal stability and negligible vapor pressure.29–31 In earlier work, we have developed a process for purification of indium by solvent extraction with the undiluted quaternary phosphonium ionic liquid trihexyl(tetradecyl)phosphonium chloride (Cyphos IL 101).32,33
Although solvent extraction processes typically comprise an aqueous phase and an immiscible organic phase, solvent extraction of metal ions can also be performed with two immiscible organic phases.34–37 Non-aqueous solvent extraction often shows separation factors that are different from what is observed for extraction of metal ions from aqueous solutions, due to differences in the solvation of the metal ions. This observations can be explored for the development of more efficient solvent extraction processes, as illustrated in recent papers.38–42
In this paper, an efficient non-aqueous solvent extraction process for separation of indium and zinc from an ethylene glycol (EG) feed solution is described. The quaternary phosphonium ionic liquid trihexyl(tetradecyl)phosphonium chloride (Cyphos IL 101) and the quaternary ammonium ionic liquid Aliquat 336 (a mixture of tri-n-octylmethyl and tri-n-decylmethylammonium chloride with the former dominating) are used as extractants due to their commercial availability. The speciation of indium in the two immiscible organic phases is investigated. The solvent extraction process is demonstrated in continuous counter-current mode in a battery of mixer–settlers.
Experimental
Products
Trihexyl(tetradecyl)phosphonium chloride (Cyphos® IL 101, purity > 97%) was purchased from Cytec Industries Inc. (Niagara Falls, Ontario, Canada). Aliquat® 336 (mixture of quaternary ammonium chlorides, with 88.2–90.6% quaternary ammonium content), methanol-d4 (>99.8% atom% D), D2O (99.9 atom% D) and LiCl (>99%) were obtained from Fluka (Sigma-Aldrich, Diegem, Belgium). InCl3·4H2O (99.99%) was obtained from abcr (Karlsruhe, Germany). Ethylene glycol (99.5%), 1-butanol (99%), toluene (>99.8%), p-cymene (99+%) and ethanol (99.8+%, absolute) were purchased from Acros Organics (Thermo Fisher Scientific, Geel, Belgium). ZnCl2 (98–100.5%), HNO3 (65% a.r.), nitromethane (99+%), phosphorus standard (1000 mg L−1 in 2–5% HNO3), erbium standard (1000 mg L−1 in 2–5% HNO3), scandium standard (1000 mg L−1 in 2–5% HNO3), indium standard (1000 mg L−1 in 2–5% HNO3), zinc standard (1000 mg L−1 in 2–5% HNO3) and lanthanum standard (1000 mg L−1 in 2–5% HNO3) were obtained from Chem-Lab (Zedelgem, Belgium). NaOH pearls (a.r.) were purchased from Fisher Scientific (Thermo Fisher Scientific, Loughborough, United Kingdom). Triton® X-100 (for analysis) and trichloroethylene (99.99%) were purchased from VWR (Leuven, Belgium) and In(NO3)3·xH2O (99.99%) from Alfa Aesar (Karlsruhe, Germany). Water was always of ultrapure quality, deionized to a conductivity of <0.055 μS cm−1 (298.2 K) with a Sartorius Arium Pro ultrapure water system. The silicone solution in isopropanol was obtained from SERVA Electrophoresis GmbH (Heidelberg, Germany). All chemicals were used as received, without further purification.Instrumentation
A magnetic stirrer (MIX 15 eco model, 2Mag magnetic eMotion) in combination with a 20 × 6 mm stirring bar was used to mix the two phases in the solvent extraction experiments. After each extraction, the mixtures were centrifuged with a Eppendorf centrifuge 5804. Metal concentrations in both phases were determined using a benchtop total reflection X-ray fluorescence spectrometer (TXRF; Bruker S2 Picofox), equipped with a molybdenum X-ray source and operated at a voltage of 50 kV and a current of 600 μA. For analysis of the more polar phase (MP) by TXRF, an aliquot of the more polar phase was mixed with 50 μL of a 5 wt% HNO3 solution, 200 μL of a 5 wt% Triton X-100 solution, the appropriate amount of lanthanum and erbium internal standard solution and ethanol until a total volume of 1 mL was obtained. The quartz glass sample carriers were first treated with 30 μL of a silicone solution in isopropanol, and dried for 10 min in a hot air oven at 60 °C, followed by the application of 2 μL of the sample and drying for 30 min at the same temperature. The metal concentrations in the more polar phase were measured for 1000 s. For the less polar phase (LP), an aliquot of the less polar phase was mixed with 100–200 μL of a 5 wt% Triton X-100 solution, the appropriate amount of lanthanum and erbium internal standard and ethanol until a total volume of 1 mL was obtained. The sample carrier pre-treatment, the drying procedure and the measuring time were performed in the same way for the less polar phase as described for the more polar phase.The phosphorous content of the more polar phase after extraction and scrubbing was determined by inductive coupled plasma-optical emission spectrometry (ICP-OES), with a PerkinElmer Avio 500 spectrometer equipped with a GemCone Low-Flow Nebulizer, baffled cyclonic spray chamber, alumina injector and PerkinElmer Hybrid XLT torch. Samples, calibration solutions and quality controls were diluted in EG. All ICP spectra were measured in triplicate. The calibration curve was constructed by measuring an external standard series spanning the expected concentration range, prepared by diluting phosphorous standard solution to the desired concentration with 1-butanol standardized internally with 1 ppm of scandium. The line at 213.617 nm was measured in axial viewing mode for the determination of phosphorous. This wavelength was selected on its performance in the measurement of samples with known concentrations. Additionally, a reagent blank was measured and subtracted from the sample spectra containing 1 ppm of scandium as internal standard and diluted in 1-butanol.
The indium and zinc content of the more polar phase after stripping with NaOH was determined by ICP-OES, with a PerkinElmer Avio 500 spectrometer equipped with GemCone High Solids Nebulizer, baffled cyclonic spray chamber, 2.0 mm inner diameter alumina injector and PerkinElmer Hybrid XLT torch. After stripping and prior to ICP-OES, the more polar phase was filtered using Spartan® 30/0.2 RC filter units (Whatman®). Samples, calibration solutions and quality controls were diluted in 2 wt% HNO3. All ICP spectra were measured in triplicate. The calibration curve was constructed by measuring a series of external standards spanning the expected concentration range, prepared by diluting indium and zinc standard solution to the desired concentration with 2 wt% HNO3 solution and standardized internally with 3 ppm of scandium. The lines at 230.606 nm and 206.200 nm were measured in axial viewing mode for the determination of indium and zinc, respectively. Additionally, a reagent blank was measured and subtracted from the sample spectra containing 3 ppm of scandium as internal standard, and diluted in 2 wt% HNO3. Analysis of metal concentrations in less polar phase was performed analogously. Samples, calibration curve, quality controls and the reagent blank were diluted using 1-butanol (as opposed to 2 wt% HNO3) standardized internally with 1 ppm of scandium (as opposed to 3 ppm of scandium). The lines at 225.609 nm and 206.200 nm were measured in axial viewing mode for the determination of indium and zinc, respectively. For the more polar phase a Meinhard Low-Flow Nebulizer, baffled cyclonic spray chamber, 1.2 mm inner diameter alumina injector and PerkinElmer Hybrid XLT torch were used.
Liquid-state 1H NMR spectra were recorded on a Bruker Avance™ III HD 400 spectrometer operating at 400 MHz. Samples were diluted in methanol-d4 and referenced internally to tetramethylsilane (TMS). Trichloroethylene was added as internal standard for toluene/p-cymene quantification in the more polar phase after extraction, and the spectra were recorded with a recycle delay time (d1) of 60 s using the zg30 pulse program. Nitromethane was added as internal standard for EG quantification in the less polar phase after extraction. The spectra were analyzed with Topspin software. The chemical shifts are noted in parts per million (ppm), referenced to tetramethylsilane. Liquid-state 115In NMR spectra were recorded on a Bruker Avance™ II 600 MHz spectrometer, operating at 131.504 MHz with a sweep width of 1187 ppm. The 115In NMR samples were measured without deuterated solvents present and with respect to an external reference of 0.1 M In(NO3)3·6H2O in D2O. All samples were loaded into borosilicate NMR tubes (standard; 5 mm diameter), with the external reference sealed in a capillary tube. The system was irradiated at the resonance frequency of the sample.
Viscosities were measured using a rolling-ball type viscometer (Anton Paar, Lovis 2000 ME), densities were determined using a density meter with an oscillating U-tube sensor (Anton Paar, DMA 4500 M) and pH measurements were performed with an S220 SevenCompact™ pH/Ion meter (Mettler-Toledo) and a Slimtrode (Hamilton) electrode.
Raman spectra were recorded using a confocal Horiba Jobin Yvon LabRam HR Evolution Raman microscope. The spectrometer is equipped with a 1800 grooves per mm holographic grating with a confocal attachment, a Peltier-cooled CCD (SIN-EM FIVIS) for detection and an Olympus BX41 microscope. For excitation, a green line (λ = 532.0 nm) from a solid-state laser (LAS-532-100-HREV) operating at 14 mW was employed. Raman spectra of liquid samples were collected at room temperature in a glass cuvette (4 mL) using a x50_VIS_LWD microscope objective to focus the laser beam at the center of the cuvette. Each spectral scan was collected with an acquisition time of 3 s for 15 accumulations. Spectra were processed with the LabSpec6 software. Fourier transform infrared (FTIR) spectra were recorded using a Bruker Vertex 70 spectrometer with the attenuated total reflectance module (Platinum ATR) for direct sample examination and analyzed with OPUS software.
Extended X-ray Absorption Fine Structure (EXAFS) spectra of the indium K-edge (27![[thin space (1/6-em)]](https://www.rsc.org/images/entities/char_2009.gif) 939 eV) were collected at the Dutch-Belgian Beamline (DUBBLE, BM26A) at the European Synchrotron Radiation Facility (ESRF) in Grenoble (France).43 The energy of the X-ray beam was tuned by a double-crystal monochromator operating in fixed-exit mode using a Si(111) crystal pair. The measurements were done in transmission mode using Ar/He gas-filled ionization chambers at ambient pressure. Samples of the more polar phase were prepared by dissolving InCl3 ([In] = 5–30–60 g L−1) in EG + LiCl (0–3 mol L−1) and the samples of the less polar phase were prepared by extraction of indium from a more polar phase ([In] = 5 or 60 g L−1; [LiCl] = 0 or 3 mol L−1) by Cyphos IL 101 or Aliquat 336 (5 or 60 vol%) dissolved in toluene. The samples were loaded in polycarbonate cuvettes with a path length of 5 or 10 mm depending on the sample. The Viper software was used for isolating the EXAFS function (χ), using standard procedures for pre-edge subtraction, data normalization and subtraction of the atomic background with a smoothing spline.44 The ab initio code FEFF 7.0 was used to calculate the theoretical phase and amplitude functions that were subsequently used in the non-linear least-squares refinement of the experimental data by fitting in R + Δ (Å) space.45 The samples or the more polar phase were fitted with two shells consisting of the In–O and In–Cl single scattering paths, whereas the samples of the less polar phase were fitted with one In–Cl single scattering path. The amplitude reduction factor S0 was fixed to 0.9 for all samples, which was deduced by fitting the main species present in a reference sample of indium(III) chloride in 1-methyl-3-octylimidazolium chloride as described in earlier work.46 Estimated standard deviations are reported in parentheses as calculated by VIPER.
939 eV) were collected at the Dutch-Belgian Beamline (DUBBLE, BM26A) at the European Synchrotron Radiation Facility (ESRF) in Grenoble (France).43 The energy of the X-ray beam was tuned by a double-crystal monochromator operating in fixed-exit mode using a Si(111) crystal pair. The measurements were done in transmission mode using Ar/He gas-filled ionization chambers at ambient pressure. Samples of the more polar phase were prepared by dissolving InCl3 ([In] = 5–30–60 g L−1) in EG + LiCl (0–3 mol L−1) and the samples of the less polar phase were prepared by extraction of indium from a more polar phase ([In] = 5 or 60 g L−1; [LiCl] = 0 or 3 mol L−1) by Cyphos IL 101 or Aliquat 336 (5 or 60 vol%) dissolved in toluene. The samples were loaded in polycarbonate cuvettes with a path length of 5 or 10 mm depending on the sample. The Viper software was used for isolating the EXAFS function (χ), using standard procedures for pre-edge subtraction, data normalization and subtraction of the atomic background with a smoothing spline.44 The ab initio code FEFF 7.0 was used to calculate the theoretical phase and amplitude functions that were subsequently used in the non-linear least-squares refinement of the experimental data by fitting in R + Δ (Å) space.45 The samples or the more polar phase were fitted with two shells consisting of the In–O and In–Cl single scattering paths, whereas the samples of the less polar phase were fitted with one In–Cl single scattering path. The amplitude reduction factor S0 was fixed to 0.9 for all samples, which was deduced by fitting the main species present in a reference sample of indium(III) chloride in 1-methyl-3-octylimidazolium chloride as described in earlier work.46 Estimated standard deviations are reported in parentheses as calculated by VIPER.
Batch-scale solvent extraction, scrubbing and stripping
The lab-scale, single-contact non-aqueous solvent extraction, scrubbing and stripping experiments were performed in 20 mL glass vials at room temperature, RT (20–25 °C) with mechanical stirring. Extraction experiments were performed using two phases. Once equilibrium was reached, phase separation was accelerated using an Eppendorf 5804 centrifuge, followed by separation of the two phases. Both phases were measured using TXRF after the proper dilutions were made.The distribution ratio D of a metal M is defined as
 | (1) |
 | (2) |
 | (3) |
The percentage extraction (%E) is defined as the amount of metal extracted to the less polar phase over the initial amount of metal present in the aqueous phase:
 | (4) |
The separation efficiency between two metals can be described by the separation factor α, which is defined as the ratio of the respective distribution ratios of two extractable solutes measured under the same conditions:
 | (5) |
Co-extracted metal ions are removed after extraction from the less polar phase by a scrubbing solution, leaving the metal ions of interest in the loaded organic phase. The percentage scrubbing (%S) in the scrubbed phase can be defined as:
 | (6) |
The metal ions of interest are removed after scrubbing from the loaded less polar phase by a stripping agent. The percentage stripping (S) in the stripping phase is expressed using the scrubbing percentage %S (eqn (6)).
For the construction of the McCabe–Thiele diagram, Origin 2018b was used to fit an equilibrium curve to the data. Non-linear Curve Fitting ExpDec2, two-phase exponential decay function with time constant parameter, was used for the extraction McCabe–Thiele diagram and non-linear Curve Fitting ExpDec1, one-phase exponential decay function with time constant parameter, for the scrubbing McCabe–Thiele diagram, respectively.
Continuous solvent extraction with mixer–settlers
Continuous experiments were performed in a Rousselet PTFE lab-scale mixer–settler units of universal type (Model UX 1.1), having a mixer volume of 35 mL, a settler volume of 143 mL and a settler area of 49 cm2. In each settler, one baffle and two PTFE coalescence plates were present. Peristaltic pumps of the type Masterflex L/S® Variable-Speed Digital Drive with Remote I/O (Cole-Palmer) were used to pump the more polar and less polar phases via high density polyethylene plastic tubes. For all operations, the more polar phase was the continuous phase. For the extraction, four extraction stages were used. The phase ratio was adjusted so that the more-polar-to-less-polar (MP![[thin space (1/6-em)]](https://www.rsc.org/images/entities/char_2009.gif) :
:![[thin space (1/6-em)]](https://www.rsc.org/images/entities/char_2009.gif) LP) volume phase ratio was equal to 1
LP) volume phase ratio was equal to 1![[thin space (1/6-em)]](https://www.rsc.org/images/entities/char_2009.gif) :
:![[thin space (1/6-em)]](https://www.rsc.org/images/entities/char_2009.gif) 2. The flow rate of the more polar phase was 1 mL min−1, while for the less polar phase it was 2 mL min−1. For the continuous scrubbing experiment, six mixer–settler units were used with a fixed phase ratio of MP
2. The flow rate of the more polar phase was 1 mL min−1, while for the less polar phase it was 2 mL min−1. For the continuous scrubbing experiment, six mixer–settler units were used with a fixed phase ratio of MP![[thin space (1/6-em)]](https://www.rsc.org/images/entities/char_2009.gif) :
:![[thin space (1/6-em)]](https://www.rsc.org/images/entities/char_2009.gif) LP = 1
LP = 1![[thin space (1/6-em)]](https://www.rsc.org/images/entities/char_2009.gif) :
:![[thin space (1/6-em)]](https://www.rsc.org/images/entities/char_2009.gif) 2. The flow rate of the more polar phase was 1 mL min−1, while for the less polar phase it was 2 mL min−1. During the operations, samples (200 μL) of both the more polar and less polar phases were collected at the end of each settler after every 30 min or hour of operation. The less polar phases were analyzed by ICP-OES.
2. The flow rate of the more polar phase was 1 mL min−1, while for the less polar phase it was 2 mL min−1. During the operations, samples (200 μL) of both the more polar and less polar phases were collected at the end of each settler after every 30 min or hour of operation. The less polar phases were analyzed by ICP-OES.
Results and discussion
Effect of the LiCl concentration on In(III) extraction
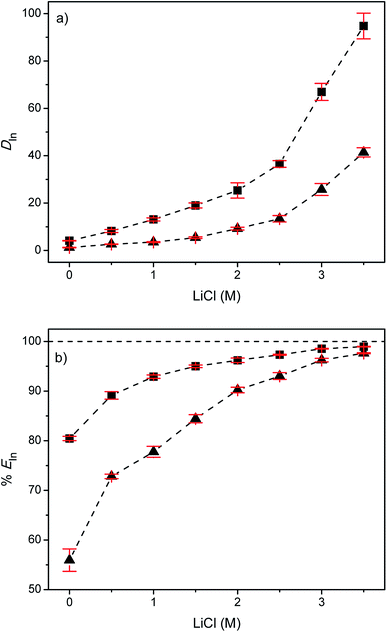
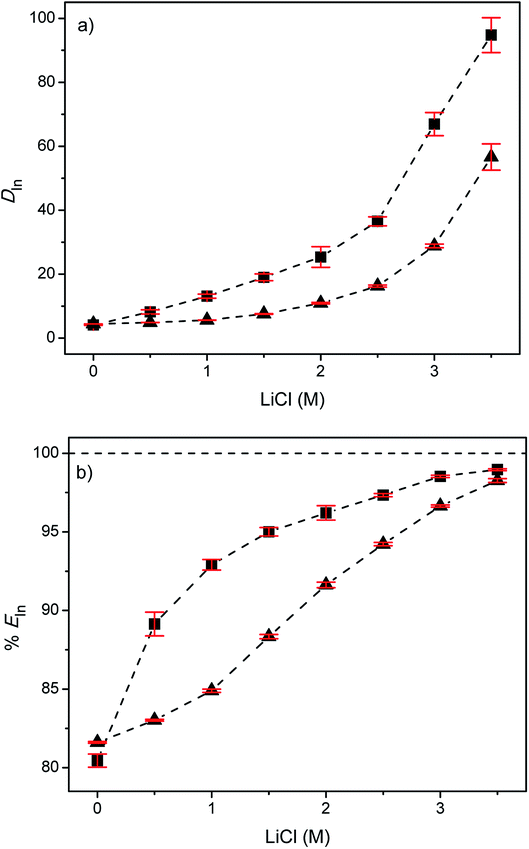
The diluent present in the less polar phase is generally an aromatic or aliphatic hydrocarbon, preferentially with a low solubility in the more polar phase, a high flash point and a high boiling point. It's function is to reduce the viscosity of the extractant and it has also an effect on the extraction efficiencies and hence on the selectivity of the extraction process.34,42 For the extraction of indium from EG with Cyphos IL 101 or Aliquat 336, toluene was considered as diluent since it has often been used in the past in combination with the extractants Cyphos IL 101 and Aliquat 336.47–54 In the first series of experiments, the distribution ratios (DIn) and the percentages extraction of indium(III) (%EIn) were determined as a function of the LiCl concentration varying between 0 and 3.5 M (Fig. 1). LiCl was used as a salting-out agent because of its high solubility in EG.34The average distribution ratio of indium(III) for the EG + (5 vol% Cyphos IL 101 in toluene) system increased with increasing chloride concentration. The same trend but with lower D values was observed for the EG + (5 vol% Aliquat 336 in toluene) system. The lower D values can be explained by the lower lipophilicity of Aliquat 336 compared to Cyphos IL 101. The shorter alkyl chains attached to the quaternary ammonium cation core give rise to a lower lipophilicity of Aliquat 336 compared to Cyphos IL 101. Furthermore, the charge delocalization at the quaternary ammonium cations gives the central part of these cations a higher charge density, and thus more polar character, than the corresponding quaternary phosphonium cations.55,56 For both systems an extraction percentage >97% was obtained at the highest LiCl concentration investigated (3.5 M).
Next, the mutual solubility of the both phases was examined. Any solvent pair can be used for solvent extraction as long as two immiscible phases are formed. Test tube experiments indicated that no significant volume changes occurred after extraction for the systems investigated in this paper. The mutual solubility of EG and toluene was estimated by recording the 1H NMR spectra of both phases after equilibrium was attained (Fig. S1 ESI†). The solubility of the extractant in the more polar phase was estimated by recording the 1H NMR spectra of the more polar phase after equilibrium for Aliquat 336 and by measuring the phosphorous content of the more polar by ICP-OES phase after equilibration for Cyphos IL 101. In the absence of LiCl, the solubility of EG in the less polar phase was ∼15 g L−1 for both systems and the solubility of toluene in the more polar phase was as high as ∼36 g L−1 and ∼45 g L−1 for the Aliquat 336 and Cyphos IL 101 system, respectively. As a consequence of the salting-out effect, the mutual solubility decreased as a function of increasing LiCl concentration. At a concentration of 3.5 M LiCl, the solubility of EG in less polar phase decreased to ∼9 g L−1 for the Aliquat 336 and ∼13 g L−1 for the Cyphos IL 101 system. The solubility of toluene in more polar phase decreased to ∼9 g L−1 and ∼14 g L−1 for the Aliquat 336 and Cyphos IL 101 system, respectively.
The solubility of Aliquat 336 in the more polar phase (∼6 g L−1) was considerately higher in the absence of LiCl than the solubility of Cyphos IL 101 (3.7 g L−1) under the same conditions. With increasing LiCl concentrations, this difference in solubility diminished rapidly. At 3.5 M LiCl, the solubility of Aliquat 336 and Cyphos IL 101 in the more polar phase decreased to ∼0.3 g L−1 and 0.2 g L−1, respectively. Overall, the mutual solubility at all LiCl concentrations is higher in the system containing Aliquat 336 as the extractant. The concentration of extractant in toluene largely affects the phase equilibrium. As shown in Fig. S2 ESI,† upon addition of extractant to the two phase system, the solubility of EG in the less polar phase and of toluene in the more polar phase increased.
Speciation of indium(III)
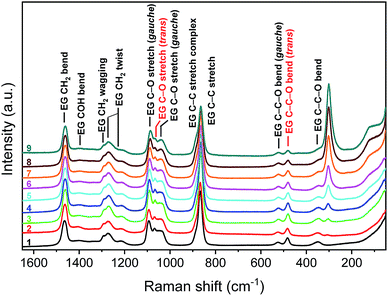
Knowledge of the speciation of metals in the phases is required to explain the extraction mechanism. The extractability of metal ions strongly depends upon the structure of metal complexes in the more polar phase.57 Raman spectra were recorded in the spectral region from 50 to 1650 cm−1 as a function of the indium concentration (5, 10, 20, 40, 60, 100, 150 and 200 g L−1) and LiCl concentration (0, 1, 2, 3.5 M). Initially, the indium speciation was studied in EG without LiCl present. Fig. 2 shows the Raman spectra at 0 M LiCl as a function of the indium concentration. Table 1 gives the list of the observed Raman modes. Three main changes can be observed throughout the indium concentration range. First, the peak at 304 cm−1 becomes more prominent with increasing indium concentration. This peak finds its origin in coordination of indium(III) to EG. Second, a shoulder of the C–C stretch emerges around 885 cm−1, representing the C–C stretch of the indium–EG complex. Thirdly, the C–O stretch (trans) of EG transforms from an independent peak to a shoulder of the C–O stretch (gauche) of EG at ∼1090 cm−1 with increasing indium concentration. Simultaneously, the C–O stretch (gauche) of EG at ∼1043 cm−1 becomes more pronounced. EG is an oxygen donor ligand. The ligand coordinates as a bidentate as well as a monodentate ligand.58,59 Geometrically, EG cannot be present in trans conformation when coordinated as a bidentate ligand to indium(III). As a consequence, as more and more indium(III) is coordinated to EG, the fraction of EG present in trans conformation decreases. G. Carta et al. studies the indium(III) complex in dimethyl ether. Based on elemental, thermogravimetric, infra-red, mass spectrometry and single crystal X-ray analysis, it was proposed that the (InCl3)2(DME)3 complex composed out of two centrosymmetrically related lnCl3·DME·0.5DME units, where the indium(III) is coordinated to three chlorine atoms, two oxygen atoms of one chelating DME unit and one oxygen atom of the bridging DME ligand in a fac-octahedral arrangement, resulting in a six-coordinate complex.60 Complexes with bridging ligands are common in crystal structures. Metal complexes were EG serves as a bridging complex are reported for sodium and copper.61,62 It is possible that a similar bridging complex as with DME, (InCl3)2(EG)3, exists in solution. In contrast to crystal structures, it is unlikely that an indium(III) complex encounters a second indium(III) complex and forms a bridging complex in a liquid. Therefore, we do not exclude the presence of a mononuclear indium(III) complex, (InCl3)(EG)2, where the indium(III) is coordinated to three chlorine atoms, two oxygen atoms of one chelating EG unit and one oxygen atom of another EG ligand.| Raman | Infrared | ||
|---|---|---|---|
| ν (cm−1) | Assignment | ν (cm−1) | Assignment |
| 304 | ν(In–Cl) | 480 | C–C–O bend (trans) |
| 346 | C–C–O bend | 517 | C–C–O bend (gauche) |
| 481 | C–C–O bend (trans) | 585 | C–O tors |
| 521 | C–C–O bend (gauche) | 861 | CH2 rock (trans) |
| 855 | C–C stretch indium complex | 880 | CH2 rock (gauche) |
| 866 | C–C stretch | 1033 | C–C stretch + C–O stretch |
| 1043 | C–O stretch (gauche) | 1083 | C–C stretch + C–O stretch |
| 1067 | C–O stretch (trans) | 1203 | CH2 twist |
| 1090 | C–O stretch (gauche) | 1256 | CH2 twist |
| 1215 | CH2 twist | 1332 | CH2 wagging + C–O–H bend |
| 1269 | CH2 twist | 1362 | CH2 wagging + C–O–H bend |
| 1289 | CH2 wagging | 1410 | CH2 wagging + C–O–H bend |
| 1397 | C–O–H bend | 1455 | CH2 sciss |
| 1462 | CH2 bend (sciss) | 1656 | H2O sciss |
| 2874 | CH2 stretch (sym.) | ||
| 2938 | CH2 stretch (asym.) | ||
| 3295 | OH stretch | ||
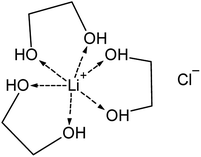
Next, the Raman spectra of EG were recorded as a function of the LiCl concentration without indium(III) present (Fig. S3 ESI†). Similar to the spectra of indium(III) in EG, a shoulder of the C–C stretch emerges, representing the C–C stretch of the lithium–EG complex and with increasing LiCl concentration, the C–O stretch (trans) of EG transforms from an independent peak to a shoulder of the C–O stretch (gauche). Lithium is probably coordinated to six oxygen atoms from three chelating EG units, similar to the speciation of lithium in glymes (Fig. 3).72 As with indium, due to the bidentate nature of the coordination of EG to lithium, an increase in LiCl concentration leads to a decrease in the fraction of EG present in trans conformation.
Finally, Raman spectra were recorded with both indium and lithium present in EG. Fig. S4 ESI† shows the Raman spectra at different LiCl concentrations (0, 1, 2, 3.5 M) as a function of the indium concentration (5, 10, 20, 40, 60 g L−1). No additional changes in the spectra were observed with increasing indium concentration except the ones already observed for the mono-element solutions. However, when comparing the Raman spectra at different indium concentrations as a function of the LiCl concentration, the Raman mode of the indium complex shifts to lower wavenumbers (5–15 cm−1) with increasing LiCl concentration (Fig. 4 and S5 ESI†). A shift to lower wavenumbers of the metal–ligand stretching frequency can result from a change to a higher coordination number.73 Possibly, an additional chlorine atom is coordinated to indium, replacing the bridging EG molecule.
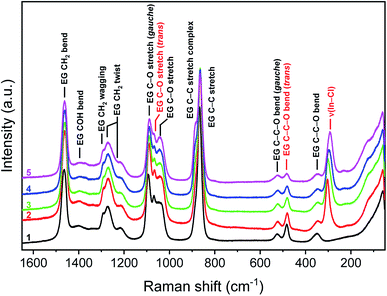 | ||
| Fig. 4 Raman spectra at 60 g L−1 indium as a function of the LiCl concentration. EG (1), 0 M LiCl (2), 1 M LiCl (3), 2 M LiCl (4), 3.5 M LiCl (5). λlaser = 532.0 nm. | ||
Table 2 shows the Raman spectra for indium complexes in various solvents. Based on this data, it is concluded that indium is probably present as a neutral complex at low LiCl concentration. In solvents containing monodentate ligands, indium is coordinated to three chloride ions and three ligand molecules (In(L)3Cl3), similar to the coordination of several divalent metal halides with EG.57 Since, EG can serve either as a monodentate and bidentate ligand, the bridging (InCl3)2(EG)3 or mononuclear (InCl3)(EG)2 complex is proposed for low LiCl concentrations. As the LiCl concentration increases, a larger fraction of the coordinated indium ions shifts to bidentate coordination with probably one EG molecule in combination with four chloride ions ([In(EG)Cl4]−) (Fig. 5). The additional chloride atoms originate from the LiCl, releasing chloride anions upon coordinating with EG (Fig. 3).
a Dimethyl sulfoxide (Raman + infrared), pyridine (infrared), γ-picoline (infrared).b Diethyl ether (Raman), acetonitrile-d3 (Raman), 1-ethyl-3-methylimidazolium chloride (Raman), 1-methyl-3-butylimidazolium chloride (Raman), (C2H5)4N[InCl4] salt (Raman + infrared), (n-C3H7)4N[InCl4] salt (Raman + infrared), 1![[thin space (1/6-em)]](https://www.rsc.org/images/entities/char_2009.gif) : :![[thin space (1/6-em)]](https://www.rsc.org/images/entities/char_2009.gif) 1 molar ratio Aliquat 336 to InCl3 in benzene (infrared) and molar ratios >1 1 molar ratio Aliquat 336 to InCl3 in benzene (infrared) and molar ratios >1![[thin space (1/6-em)]](https://www.rsc.org/images/entities/char_2009.gif) : :![[thin space (1/6-em)]](https://www.rsc.org/images/entities/char_2009.gif) 1 triheptylammonium chloride to InCl3 in benzene (infrared).c 1-Ethyl-3-methylimidazolium chloride (Raman), 1 1 triheptylammonium chloride to InCl3 in benzene (infrared).c 1-Ethyl-3-methylimidazolium chloride (Raman), 1![[thin space (1/6-em)]](https://www.rsc.org/images/entities/char_2009.gif) : :![[thin space (1/6-em)]](https://www.rsc.org/images/entities/char_2009.gif) 1 molar ratio Aliquat 336 to InCl3 in benzene (infrared).d 1-Ethyl-3-methylimidazolium chloride (Raman), 1-methyl-3-butylimidazolium chloride (Raman), ((CH3)3NH)3[InCl6] crystal (infrared). 1 molar ratio Aliquat 336 to InCl3 in benzene (infrared).d 1-Ethyl-3-methylimidazolium chloride (Raman), 1-methyl-3-butylimidazolium chloride (Raman), ((CH3)3NH)3[InCl6] crystal (infrared). |
||||
|---|---|---|---|---|
| Complex | Raman | Infrared | ||
| ν (cm−1) | Assignment | ν (cm−1) | Assignment | |
| InCl3L3a | 267 | Str. ν(In–Cl) | 248–306 | Str. ν(In–Cl) |
| [InCl4]−b | 333–351 | T2 antisym. str. | 330–336 | T2 antisym. str. |
| 317–326 | A1 sym. str. | 115–120 | T2 antisym. deform | |
| 105–116 | T2 antisym. deform | |||
| 89 | E sym. deform | |||
| [InCl5]2−c | 293 | A1 | 293–296 | n.a. |
| 149 | E, A1, B1 overlap | 259 | n.a. | |
| 135 | n.a. | |||
| [InCl6]3−d | 268 | A1g | 245 | n.a. |
| 149 | Eg, B2g | 182 | n.a. | |
| 150 | n.a. | |||
 | ||
| Fig. 5 Tentative chemical structures of indium(III) complexes formed at low (left + middle) and high (right) LiCl concentration. | ||
To confirm our hypothesis about the indium(III) complexes in EG, infrared spectra were recorded in the spectral region from 375 to 4000 cm−1 as a function of the indium concentration (5, 10, 20, 40 and 60 g L−1) and LiCl concentration (0, 1, 2, 3.5 M). The spectrometer did not allow for the recording of far-infrared spectra at wavenumbers <375 cm−1. Fig. S6 ESI† shows the infrared spectra at 0, 1, 2 and 3.5 M LiCl as a function of the indium concentration. Table 1 gives the list of the observed infrared modes. Limited changes are observed for the different indium concentrations besides the peak at 1656 cm−1, that is related to the H2O sciss, and which becomes more prominent with increasing indium concentrations. Since indium is added as indium(III) chloride tetrahydrate, the increased intensity of this peak is related to the increasing water content in the liquid.
As the LiCl concentration in the samples increases, a new peak at 427 cm−1 starts to appear, and this can be related to the coordination of lithium with EG. At the same time, the CH2 rocking (trans) band of EG become less prominent (Fig. S7 and S8 ESI†). Due to the overlap of the ν(Li–O) with the C–C–O band (trans), no statements can be made about the intensity of this trans band of EG. The same observations were made for the Raman spectra were the C–C–O bend (trans) and C–O stretch (trans) of EG became less prominent with increasing LiCl concentration. This supports our hypothesis that a substantial fraction of the molecules undergo a change in conformation, from trans- to gauche-form, with increasing LiCl concentration.
115In NMR spectroscopy was also used to the confirm the indium(III) speciation in the MP phase. 115In NMR spectra of the MP before extraction containing 5 g L−1 indium(III) were measured having various LiCl concentrations to confirm the change in speciation across the LiCl concentration range. Unfortunately, no NMR lines of indium were observed. Failure to observe NMR lines of indium in an environment of low symmetry is not uncommon due to line broadening.85 115In is a quadrupolar nucleus (spin I = 9/2) with short relaxation times leading to broad NMR signals and a low resolution.85,86
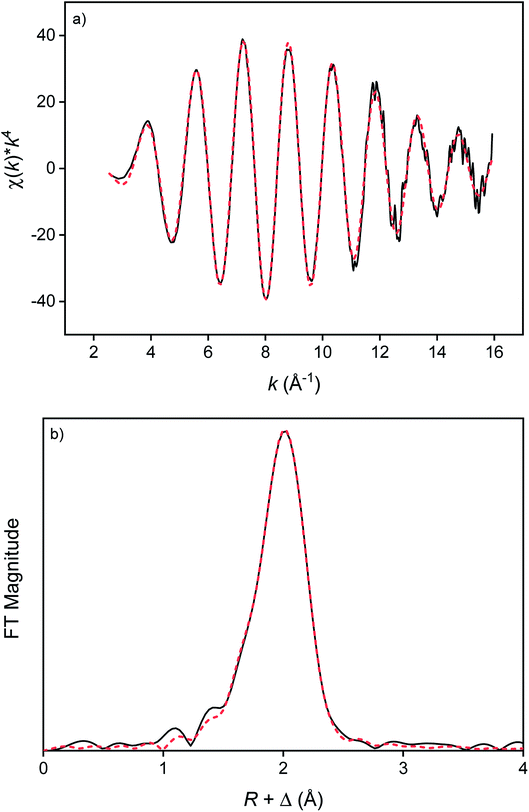
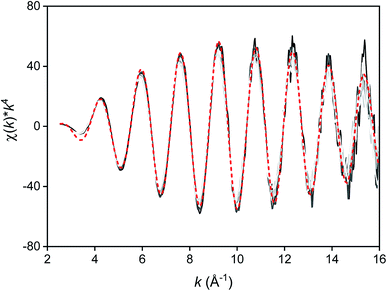
The first coordination sphere of the indium(III) complexes in the more polar and less polar phase were probed by Extended X-ray Absorption Fine Structure (EXAFS). The speciation of InCl3 in several organic solvents and ionic liquids had already been investigated by several researchers.33,87–89 The speciation can differ between a neutral InCl3L3 complex and an anionic tetra-, penta- or hexachloroindate(III) complex. Based on the coordination of several divalent metal halides with EG ligands reported in the literature,57 it was expected that a heteroleptic indium(III) complex would be present with both chloride and EG coordinated to the metal center. Therefore, the EXAFS spectra of all more polar samples were fitted with the same model consisting of two shells of the In–O and In–Cl single scattering paths and the number of neighbors (degeneracy) was regressed, as well as the path length, the Debye–Waller factor and the E0 shift. The fitted EXAFS function and Fourier transform of the sample containing 3 mol L−1 LiCl and 30 g L−1 indium are shown in Fig. 6. The results indicate that degeneracy of the In–O scattering path varied between 2.0(0.2) and 4.4(1.5) and for the In–Cl scattering path between 4.8(0.4) and 2.1(0.3) (Table 3). The degeneracy was found to be correlated with the LiCl concentration, while no significant correlation was found with the indium concentration. This indicates that the coordination environment of indium changes with increasing LiCl concentration, which is in line with the conclusions of the Raman spectra. At low LiCl concentrations, indium is coordinated with three oxygen atoms, possibly from two bidentate coordinated and one bridging monodentate EG ligand, and three chloride anions (InCl3)2(EG)3 or one bidentate coordinated and one monodentate coordinated EG ligand, and three chloride anions (InCl3)(EG)2. At higher LiCl concentrations, the coordination changes to two oxygen atoms of one bidentate coordinated EG ligand and four chloride anions ([In(EG)Cl4]−).
| [LiCl] mol L−1 | [In] g L−1 | In–O | In–Cl | ||||
|---|---|---|---|---|---|---|---|
| N | r (Å) | σ2 (Å2) | N | r (Å) | σ2 (Å2) | ||
| 0 | 5 | 3.0(1.0) | 2.202(20) | 0.002(2) | 2.1(0.3) | 2.440(10) | 0.001(1) |
| 0 | 30 | 4.4(1.5) | 2.262(23) | 0.008(3) | 3.3(0.8) | 2.427(11) | 0.005(1) |
| 0 | 60 | 3.6(0.5) | 2.242(04) | 0.006(1) | 2.9(0.1) | 2.436(02) | 0.004(1) |
| 1.5 | 5 | 2.4(1.4) | 2.217(30) | 0.004(4) | 3.5(0.9) | 2.448(12) | 0.003(1) |
| 1.5 | 30 | 2.5(0.1) | 2.267(03) | 0.007(2) | 4.2(0.1) | 2.440(01) | 0.006(1) |
| 1.5 | 60 | 2.7(0.4) | 2.256(07) | 0.006(1) | 3.5(0.1) | 2.446(02) | 0.004(1) |
| 3.0 | 5 | 2.2(0.6) | 2.250(06) | 0.009(1) | 4.8(0.4) | 2.448(01) | 0.006(1) |
| 3.0 | 30 | 2.0(0.2) | 2.265(10) | 0.006(1) | 4.1(0.1) | 2.453(01) | 0.006(1) |
| 3.0 | 60 | 2.0(0.3) | 2.262(06) | 0.006(1) | 4.0(0.1) | 2.453(01) | 0.005(1) |
In the less polar phase, it is expected that indium is present as an anionic chloroindate complex. To verify this experimentally, EXAFS spectra were recorded of the less polar phase after extraction of an EG solution containing 5 or 60 g L−1 dissolved as InCl3 and 0 or 3 mol L−1 LiCl with Cyphos IL 101 or Aliquat 336 (5 or 60 vol%) dissolved in toluene. The EXAFS spectra overlap completely, meaning that the indium(III) species in all samples is very similar (Fig. 7). This indicates that the indium(III) species showed very limited variation in the range of tested extraction conditions. The spectra were fitted to a model consisting of one In–Cl single scattering path (Table 4). The degeneracy of the scattering path of the samples was approximately equal to four, indicating that most probably the tetrachloroindate(III) complex InCl4− is present in the less polar phase.
| [LiCl]MP (mol L−1) | [In]MP (g L−1) | [IL]LP (vol%) | IL | N | r (Å) | σ2 (Å2) |
|---|---|---|---|---|---|---|
| 5 | 0 | 5 | Cyphos IL 101 | 4.4(4) | 2.364(1) | 0.003(1) |
| 5 | 3 | 5 | Cyphos IL 101 | 4.5(1) | 2.365(1) | 0.003(1) |
| 60 | 0 | 60 | Cyphos IL 101 | 4.3(1) | 2.365(1) | 0.004(1) |
| 60 | 3 | 60 | Cyphos IL 101 | 4.2(1) | 2.366(1) | 0.004(1) |
| 5 | 0 | 5 | Aliquat 336 | 4.3(1) | 2.365(1) | 0.004(1) |
| 5 | 3 | 5 | Aliquat 336 | 4.0(1) | 2.367(1) | 0.004(1) |
| 60 | 0 | 60 | Aliquat 336 | 4.1(2) | 2.367(2) | 0.004(1) |
115In NMR spectroscopy was also used to the determine the composition of the extracted indium(III) complexes. 115In NMR spectra of the LP phase after extraction were measured starting from a MP phase having 5 g L−1 indium(III) and varying LiCl concentrations. The NMR spectra are shown in Fig. S9 ESI.† As expected for a quadrupolar nucleus, broad NMR signals were observed. A signal at ∼451 ppm was observed for the LP phase 5 vol% of Cyphos IL 101 in toluene and a signal at ∼441 ppm was observed for the LP phase 5 vol% of Aliquat 336 in toluene, independent on the LiCl concentration. The chemical shifts found were compared to literature data for chloroindate(III) anions in molecular solvents.33,87,88,90–95 Chemical shifts of the signals lie in the same range as observed for tetrachloroindate anions, [InCl4]− in molecular solvents (416–480 ppm). This suggests that the majority of indium exists in the LP phase as tetrachloroindate(III) anions, confirming the EXAFS data.
In addition to EXAFS and 115In NMR spectra, Raman spectra were also recorded to determine the speciation of the extracted indium complexes. Raman spectra of the LP phase before and after extraction were measured starting from a MP phase having 5 g L−1 indium(III) and 3.5 M LiCl. The Raman spectra are shown in Fig. S10 ESI.† A signal at ∼321 cm−1 was observed for the LP phase 5 vol% of Cyphos IL 101 in toluene and a signal at ∼323 cm−1 was observed for the LP phase 5 vol% of Aliquat 336 in toluene. When comparing the Raman shifts of the signals to the Raman shifts of chloroindate(III) anions in various solvents (Table 2), it can be concluded that the signals in the same range as observed for tetrachloroindate anions, [InCl4]−, confirming the EXAFS and 115In NMR data.
Effect of the diluent on indium(III) extraction
Generally, the mutual solubility is quite high for both systems, even at high LiCl concentrations. In order to decrease the mutual solubility, the toluene diluent was changed to the less polar solvent p-cymene. p-Cymene is a naturally occurring aromatic organic compound. It is one of the major constituents of extracts and essential oils used in traditional medicines as antimicrobial agents.96,97 Besides its “green character”, it has also a higher boiling (111 °C vs. 177.1 °C) and flash point (4 °C vs. 47 °C) than toluene, making it safer to handle. Moreover, it can be regarded as a model of the commercial diluent SOLVESSO 150 (flash point 64 °C), dedicated to solvent extraction applications.98 Third-phase formation occurred after extraction when combining the diluent p-cymene with Aliquat 336 as the extractant. Third layer formation will cause operational problems when switching to continuous mode in mixer–settlers and is therefore undesirable. Due to the formation of a third phase and the higher mutual solubility that was observed for the EG–toluene system when Aliquat 336 was present in comparison to Cyphos IL 101, it was decided to exclude Aliquat 336 as an extractant in further studies. Fig. 8 shows the distribution ratios and the percentages extraction of indium(III) as a function of the LiCl concentration varying between 0 and 3.5 M for the EG + (5 vol% Cyphos IL 101 in toluene) and EG + (5 vol% Cyphos IL 101 in p-cymene) system. The distribution ratios and percentages extraction of indium(III) were slightly lower for the EG + (5 vol% Cyphos IL 101 in p-cymene) system than for the EG + (5 vol% Cyphos IL 101 in toluene) system, but the system is still capable of almost fully extracting (%EIn = 98%) the indium(III) present at the maximum LiCl concentration.The main difference between both systems is the mutual solubility (Fig. S11 ESI†). When comparing both systems, it is evident that the mutual solubility of the EG + (5 vol% Cyphos IL 101 in p-cymene system) is considerately lower than that of the EG + (5 vol% Cyphos IL 101 in toluene) system. The solubility of p-cymene in the more polar phase is on average 9 times lower, reaching a minimum of 1.5 ppm at the highest LiCl concentration. The solubility of EG in the less polar phase is on average 2 times lower, reaching a minimum of 3.5 g L−1 at the highest LiCl concentration. The solubility of Cyphos IL 101 in the more polar phase is similar in both systems.
Effect of the LiCl concentration on separation of indium(III) and zinc(II)
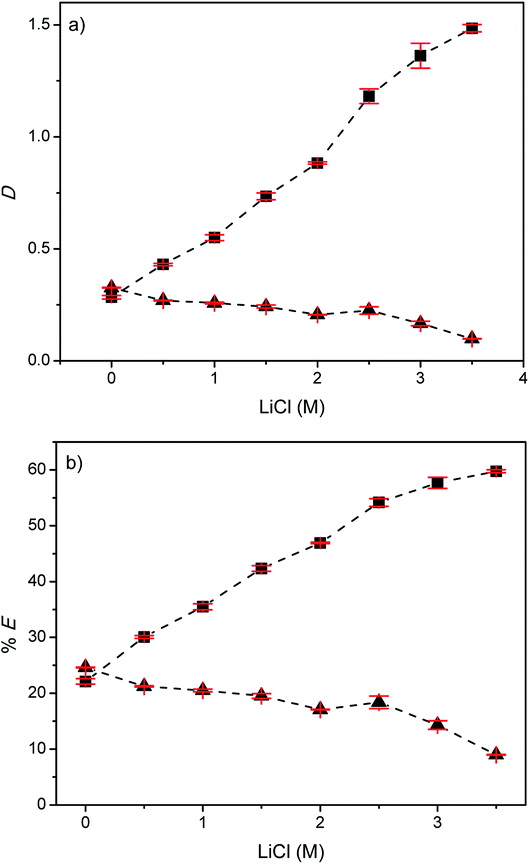
After identification of EG/p-cymene as a promising solvent pair for non-aqueous solvent extraction of indium(III), zinc(II) was added as a second metal to investigate the capability of the EG + (Cyphos IL 101 in p-cymene) system for separation of indium(III) and zinc(II). In contrast to the mono-element systems studied before, 1 vol% of 1-decanol had to be added as a modifier to avoid third-phase formation after extraction. The extractant concentration was also lowered from 5 to 2.56 vol%. Theoretically, 2.56 vol% of Cyphos IL 101 is required to fully extract indium(III) with a MP![[thin space (1/6-em)]](https://www.rsc.org/images/entities/char_2009.gif) :
:![[thin space (1/6-em)]](https://www.rsc.org/images/entities/char_2009.gif) LP volume phase ratio of 1
LP volume phase ratio of 1![[thin space (1/6-em)]](https://www.rsc.org/images/entities/char_2009.gif) :
:![[thin space (1/6-em)]](https://www.rsc.org/images/entities/char_2009.gif) 1. The selectivity of the solvent extraction systems can be increased by exploiting such loading effects. At high metal concentrations in the feed, fewer free extractant molecules are present and thus the metal ion that has the highest affinity (i.e. indium(III)) will be extracted preferentially and the co-extraction of less preferred metals (i.e. zinc(II)) will be suppressed. The distribution ratios and the percentages extraction of indium(III) and zinc(II) as a function of the LiCl concentration varying between 0 and 3.5 M for the EG + (2.56 vol% Cyphos IL 101 in p-cymene) are shown in Fig. 9. From Fig. 9 it is clear that the extraction of indium(III) increased with increasing LiCl concentration while the extraction of zinc(II) decreased. The highest separation factor (αIn(III)/Zn(II) = 15) is obtained at a LiCl concentration of 3.5 M. The percentages extraction of indium(III) at zinc(II) at this concentration are 60% and 9%, respectively.
1. The selectivity of the solvent extraction systems can be increased by exploiting such loading effects. At high metal concentrations in the feed, fewer free extractant molecules are present and thus the metal ion that has the highest affinity (i.e. indium(III)) will be extracted preferentially and the co-extraction of less preferred metals (i.e. zinc(II)) will be suppressed. The distribution ratios and the percentages extraction of indium(III) and zinc(II) as a function of the LiCl concentration varying between 0 and 3.5 M for the EG + (2.56 vol% Cyphos IL 101 in p-cymene) are shown in Fig. 9. From Fig. 9 it is clear that the extraction of indium(III) increased with increasing LiCl concentration while the extraction of zinc(II) decreased. The highest separation factor (αIn(III)/Zn(II) = 15) is obtained at a LiCl concentration of 3.5 M. The percentages extraction of indium(III) at zinc(II) at this concentration are 60% and 9%, respectively.
Extraction from non-aqueous vs. aqueous solutions
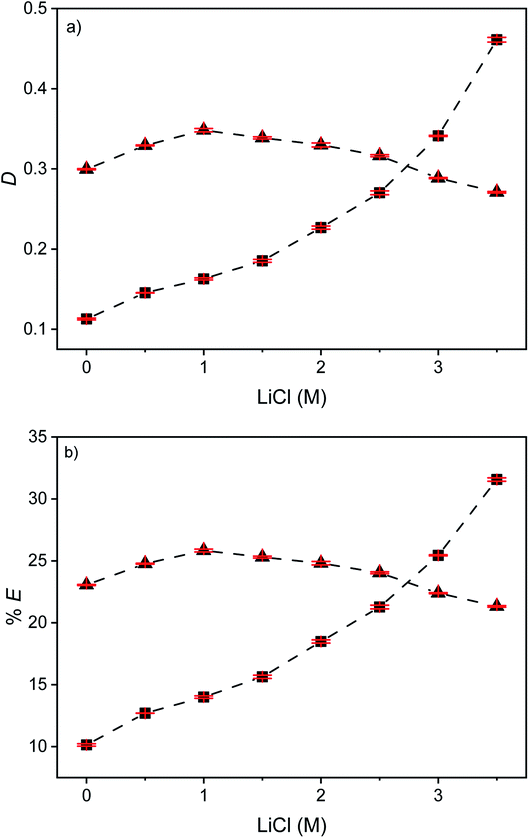
Solvent extraction of a mixture of indium(III) and zinc(II) (each 5 g L−1) has been carried out from EG (+LiCl) and aqueous chloride solutions by a solvent comprising Cyphos IL 101 (2.56 vol%) dissolved in p-cymene and 1 vol% 1-decanol as modifier (Fig. 9 and 10). When comparing these results to the non-aqueous system it is clear that the separation of indium from zinc is more difficult in the aqueous system. The distribution ratio and the percentage extraction for both elements are very similar and exhibit only limited variation across the LiCl concentration range.Effect of [extractant] on separation of indium(III) and zinc(II)
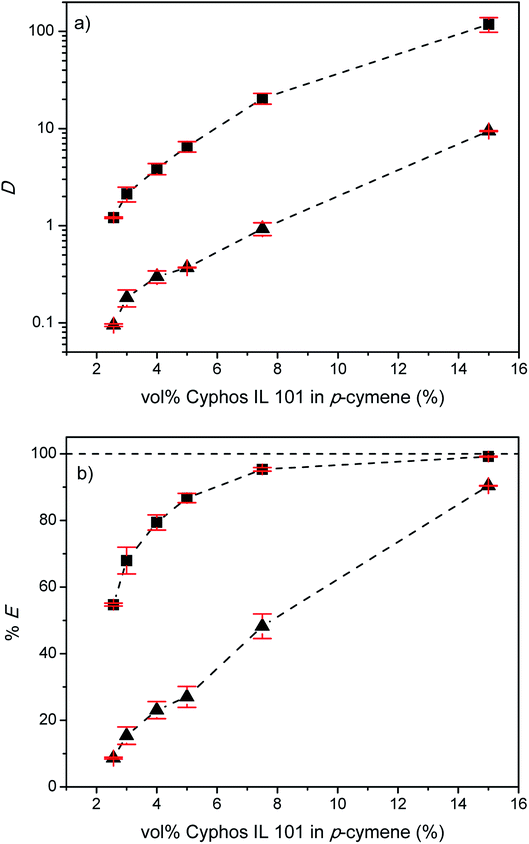
In order to increase the percentages extraction of indium(III), the effect of the extractant concentration on the extraction of indium(III) and zinc(II) was studied. Fig. 11 shows the distribution ratios and the percentages extraction of indium(III) and zinc(II) as a function of the Cyphos IL 101 concentration varying between 2.56 and 15 vol% for the EG–Cyphos IL 101 in p-cymene system at a LiCl concentration of 3.5 M. As expected, the percentage extraction of indium(III) and zinc(II) increased with increasing Cyphos IL 101 concentration. Eventually, 99% of indium(III) and 90% of zinc(II) were extracted. However, increasing the extractant concentration leads to a more difficult separation. The best separation was obtained at a Cyphos IL 101 concentration of 2.56 vol% corresponding to the highest %EIn/%EZn ratio, namely 6.Influence of the MP![[thin space (1/6-em)]](https://www.rsc.org/images/entities/h3_char_2009.gif) :
:![[thin space (1/6-em)]](https://www.rsc.org/images/entities/h3_char_2009.gif) LP phase ratio on separation of indium(III) and zinc(II)
LP phase ratio on separation of indium(III) and zinc(II)
The effect of the MP![[thin space (1/6-em)]](https://www.rsc.org/images/entities/char_2009.gif) :
:![[thin space (1/6-em)]](https://www.rsc.org/images/entities/char_2009.gif) LP volume phase ratio on the extraction of indium(III) and zinc(II) from an EG feed solution containing 3.5 M LiCl was investigated with 2.56 vol% Cyphos IL 101 in p-cymene (Fig. 12). The MP
LP volume phase ratio on the extraction of indium(III) and zinc(II) from an EG feed solution containing 3.5 M LiCl was investigated with 2.56 vol% Cyphos IL 101 in p-cymene (Fig. 12). The MP![[thin space (1/6-em)]](https://www.rsc.org/images/entities/char_2009.gif) :
:![[thin space (1/6-em)]](https://www.rsc.org/images/entities/char_2009.gif) LP phase ratio was varied from 1
LP phase ratio was varied from 1![[thin space (1/6-em)]](https://www.rsc.org/images/entities/char_2009.gif) :
:![[thin space (1/6-em)]](https://www.rsc.org/images/entities/char_2009.gif) 11 to 11
11 to 11![[thin space (1/6-em)]](https://www.rsc.org/images/entities/char_2009.gif) :
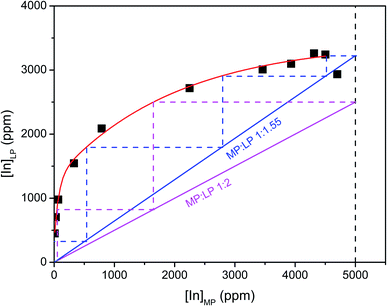
:![[thin space (1/6-em)]](https://www.rsc.org/images/entities/char_2009.gif) 1. A McCabe–Thiele plot was constructed to estimate the number of theoretical stages required for quantitative extraction of indium(III) at a selected MP
1. A McCabe–Thiele plot was constructed to estimate the number of theoretical stages required for quantitative extraction of indium(III) at a selected MP![[thin space (1/6-em)]](https://www.rsc.org/images/entities/char_2009.gif) :
:![[thin space (1/6-em)]](https://www.rsc.org/images/entities/char_2009.gif) LP phase ratio. It was found that four counter-current stages are required to achieve quantitative extraction of indium(III) at a volume phase ratio of 1
LP phase ratio. It was found that four counter-current stages are required to achieve quantitative extraction of indium(III) at a volume phase ratio of 1![[thin space (1/6-em)]](https://www.rsc.org/images/entities/char_2009.gif) :
:![[thin space (1/6-em)]](https://www.rsc.org/images/entities/char_2009.gif) 1.55. There is still some co-extraction of zinc(II), indicating the necessity of scrubbing to remove the co-extracted zinc(II) (Table S1 ESI†). For MP
1.55. There is still some co-extraction of zinc(II), indicating the necessity of scrubbing to remove the co-extracted zinc(II) (Table S1 ESI†). For MP![[thin space (1/6-em)]](https://www.rsc.org/images/entities/char_2009.gif) :
:![[thin space (1/6-em)]](https://www.rsc.org/images/entities/char_2009.gif) LP volume phase ratios smaller than 1
LP volume phase ratios smaller than 1![[thin space (1/6-em)]](https://www.rsc.org/images/entities/char_2009.gif) :
:![[thin space (1/6-em)]](https://www.rsc.org/images/entities/char_2009.gif) 1.55, the McCabe–Thiele plot could not be constructed due to maximum loading of the extractant. At these volume phase ratios, it is impossible to completely extract indium(III). For the ease of handling, a MP
1.55, the McCabe–Thiele plot could not be constructed due to maximum loading of the extractant. At these volume phase ratios, it is impossible to completely extract indium(III). For the ease of handling, a MP![[thin space (1/6-em)]](https://www.rsc.org/images/entities/char_2009.gif) :
:![[thin space (1/6-em)]](https://www.rsc.org/images/entities/char_2009.gif) LP phase ratio of 1
LP phase ratio of 1![[thin space (1/6-em)]](https://www.rsc.org/images/entities/char_2009.gif) :
:![[thin space (1/6-em)]](https://www.rsc.org/images/entities/char_2009.gif) 2 was chosen as the optimal volume phase ratio. Three counter-current stages are required to achieve quantitative extraction of indium(III) at a volume phase ratio of 1
2 was chosen as the optimal volume phase ratio. Three counter-current stages are required to achieve quantitative extraction of indium(III) at a volume phase ratio of 1![[thin space (1/6-em)]](https://www.rsc.org/images/entities/char_2009.gif) :
:![[thin space (1/6-em)]](https://www.rsc.org/images/entities/char_2009.gif) 2.
2.
Next, the influence of the extraction time was evaluated from 1 min to 100 min at the optimal LiCl concentration of 3.5 M and volume phase ratio of 1![[thin space (1/6-em)]](https://www.rsc.org/images/entities/char_2009.gif) :
:![[thin space (1/6-em)]](https://www.rsc.org/images/entities/char_2009.gif) 2 (Fig. S12 ESI†). The results show that equilibrium is reached after 20 min. The settling time at equilibrium conditions is 210 s.
2 (Fig. S12 ESI†). The results show that equilibrium is reached after 20 min. The settling time at equilibrium conditions is 210 s.
Scrubbing studies
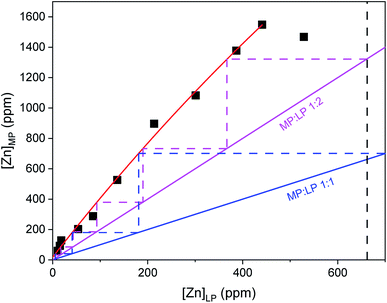
To avoid loss of indium(III), an EG solution of high LiCl concentration, 3.5 M, was used to the shift the solvent extraction equilibrium towards the extracted metal complexes. To further suppress the loss of indium(III) and to increase the scrubbing efficiency of zinc(II), the principle of the crowding effect of the less polar phase was exploited by adding indium(III), 5 g L−1, to the scrubbing solution.38 A McCabe–Thiele plot was constructed to estimate the number of theoretical stages required for quantitative scrubbing of zinc(II) at a selected MP![[thin space (1/6-em)]](https://www.rsc.org/images/entities/char_2009.gif) :
:![[thin space (1/6-em)]](https://www.rsc.org/images/entities/char_2009.gif) LP phase ratio (Fig. 13). The MP
LP phase ratio (Fig. 13). The MP![[thin space (1/6-em)]](https://www.rsc.org/images/entities/char_2009.gif) :
:![[thin space (1/6-em)]](https://www.rsc.org/images/entities/char_2009.gif) LP phase ratio was varied from 1
LP phase ratio was varied from 1![[thin space (1/6-em)]](https://www.rsc.org/images/entities/char_2009.gif) :
:![[thin space (1/6-em)]](https://www.rsc.org/images/entities/char_2009.gif) 11 to 11
11 to 11![[thin space (1/6-em)]](https://www.rsc.org/images/entities/char_2009.gif) :
:![[thin space (1/6-em)]](https://www.rsc.org/images/entities/char_2009.gif) 1. The %SZn for each MP
1. The %SZn for each MP![[thin space (1/6-em)]](https://www.rsc.org/images/entities/char_2009.gif) :
:![[thin space (1/6-em)]](https://www.rsc.org/images/entities/char_2009.gif) LP phase ratio is shown in Table S1 ESI.† It was found that six counter-current stages are required to achieve quantitative scrubbing of zinc(II) at a volume phase ratio of 1
LP phase ratio is shown in Table S1 ESI.† It was found that six counter-current stages are required to achieve quantitative scrubbing of zinc(II) at a volume phase ratio of 1![[thin space (1/6-em)]](https://www.rsc.org/images/entities/char_2009.gif) :
:![[thin space (1/6-em)]](https://www.rsc.org/images/entities/char_2009.gif) 2, extracting at the same time 60% of the indium from the scrub solution. A MP
2, extracting at the same time 60% of the indium from the scrub solution. A MP![[thin space (1/6-em)]](https://www.rsc.org/images/entities/char_2009.gif) :
:![[thin space (1/6-em)]](https://www.rsc.org/images/entities/char_2009.gif) LP phase ratio of 1
LP phase ratio of 1![[thin space (1/6-em)]](https://www.rsc.org/images/entities/char_2009.gif) :
:![[thin space (1/6-em)]](https://www.rsc.org/images/entities/char_2009.gif) 1 would result in three theoretical stages and a MP
1 would result in three theoretical stages and a MP![[thin space (1/6-em)]](https://www.rsc.org/images/entities/char_2009.gif) :
:![[thin space (1/6-em)]](https://www.rsc.org/images/entities/char_2009.gif) LP phase ratio of 2
LP phase ratio of 2![[thin space (1/6-em)]](https://www.rsc.org/images/entities/char_2009.gif) :
:![[thin space (1/6-em)]](https://www.rsc.org/images/entities/char_2009.gif) 1 in two theoretical stages. However, in both cases the total indium input is bigger than the output. Moreover, in the latter case two times the amount of more polar phase is needed, which make these phase ratios economically less interesting.
1 in two theoretical stages. However, in both cases the total indium input is bigger than the output. Moreover, in the latter case two times the amount of more polar phase is needed, which make these phase ratios economically less interesting.
Next, the scrubbing time was optimized by evaluating the percentage scrubbing of zinc(II) (%SZn) from 1 min to 100 min at a LiCl concentration of 3.5 M, In(III) concentration of 5 g L−1 and volume phase ratio of 1![[thin space (1/6-em)]](https://www.rsc.org/images/entities/char_2009.gif) :
:![[thin space (1/6-em)]](https://www.rsc.org/images/entities/char_2009.gif) 2 (Fig. S13 ESI†). The results show that equilibrium is reached after 20 min. The settling time at equilibrium conditions is 100 s.
2 (Fig. S13 ESI†). The results show that equilibrium is reached after 20 min. The settling time at equilibrium conditions is 100 s.
Stripping studies
Stripping of the less polar phase after extraction (5 g L−1 In(III), 5 g L−1 Zn(II), 3.5 M LiCl in EG![[thin space (1/6-em)]](https://www.rsc.org/images/entities/char_2009.gif) :
:![[thin space (1/6-em)]](https://www.rsc.org/images/entities/char_2009.gif) 2.56 vol% Cyphos IL 101, 1 vol% 1-decanol in p-cymene 1
2.56 vol% Cyphos IL 101, 1 vol% 1-decanol in p-cymene 1![[thin space (1/6-em)]](https://www.rsc.org/images/entities/char_2009.gif) :
:![[thin space (1/6-em)]](https://www.rsc.org/images/entities/char_2009.gif) 2, 20 min, RT, 600 rpm) and scrubbing (5 g L−1 In, 3.5 M LiCl in EG
2, 20 min, RT, 600 rpm) and scrubbing (5 g L−1 In, 3.5 M LiCl in EG![[thin space (1/6-em)]](https://www.rsc.org/images/entities/char_2009.gif) :
:![[thin space (1/6-em)]](https://www.rsc.org/images/entities/char_2009.gif) LP phase after extraction 1
LP phase after extraction 1![[thin space (1/6-em)]](https://www.rsc.org/images/entities/char_2009.gif) :
:![[thin space (1/6-em)]](https://www.rsc.org/images/entities/char_2009.gif) 1, 20 min, RT, 600 rpm) was tested using several stripping agents. Approximately 3.5 g L−1 of indium(III) and 210 ppm of zinc(II) are present in the less polar phase after extraction and scrubbing. Cyphos IL 101 is a basic extractants (anion exchanger). The driving force for extraction is the salting-out effect. Stripping of metals is efficient if the distribution ratio is low. This can be achieved by decreasing the salt concentration by addition of water or EG. However, the stripping with water did not result in a complete stripping; 85% of indium(III) and 13% of zinc(II) were stripped from the loaded less polar phase with water. Moreover, the stripping with EG resulted in the formation of three phases. The pH of the more polar phase after stripping with water is 3.30. Moreover, a second stripping step with water resulted in the formation of indium(III) hydroxide precipitation (pHMP = 3.73). A higher phase volume ratio is economically less attractive. From previous studies it is known that indium(III) can be stripped from the loaded less polar phase by precipitation stripping via addition of NaOH.29 Indium is directly stripped from the less polar phase with an aqueous NaOH solution forming insoluble In(OH)3. The loaded less polar phase was stripped with an aqueous phase containing three equivalents of NaOH. Using only 3 equivalents of NaOH as a stripping agent, it was possible to obtain a indium percentage stripping and precipitation of 98% and 100%, respectively. Although zinc is partially stripped (13%) and precipitated (68%), it is present in very low concentrations. The pH of the more polar phase after stripping was 6.58. The zinc remaining in the less polar phase can be removed by contacting it for a second time with an aqueous NaOH solution.
1, 20 min, RT, 600 rpm) was tested using several stripping agents. Approximately 3.5 g L−1 of indium(III) and 210 ppm of zinc(II) are present in the less polar phase after extraction and scrubbing. Cyphos IL 101 is a basic extractants (anion exchanger). The driving force for extraction is the salting-out effect. Stripping of metals is efficient if the distribution ratio is low. This can be achieved by decreasing the salt concentration by addition of water or EG. However, the stripping with water did not result in a complete stripping; 85% of indium(III) and 13% of zinc(II) were stripped from the loaded less polar phase with water. Moreover, the stripping with EG resulted in the formation of three phases. The pH of the more polar phase after stripping with water is 3.30. Moreover, a second stripping step with water resulted in the formation of indium(III) hydroxide precipitation (pHMP = 3.73). A higher phase volume ratio is economically less attractive. From previous studies it is known that indium(III) can be stripped from the loaded less polar phase by precipitation stripping via addition of NaOH.29 Indium is directly stripped from the less polar phase with an aqueous NaOH solution forming insoluble In(OH)3. The loaded less polar phase was stripped with an aqueous phase containing three equivalents of NaOH. Using only 3 equivalents of NaOH as a stripping agent, it was possible to obtain a indium percentage stripping and precipitation of 98% and 100%, respectively. Although zinc is partially stripped (13%) and precipitated (68%), it is present in very low concentrations. The pH of the more polar phase after stripping was 6.58. The zinc remaining in the less polar phase can be removed by contacting it for a second time with an aqueous NaOH solution.
Mixer–settler experiments
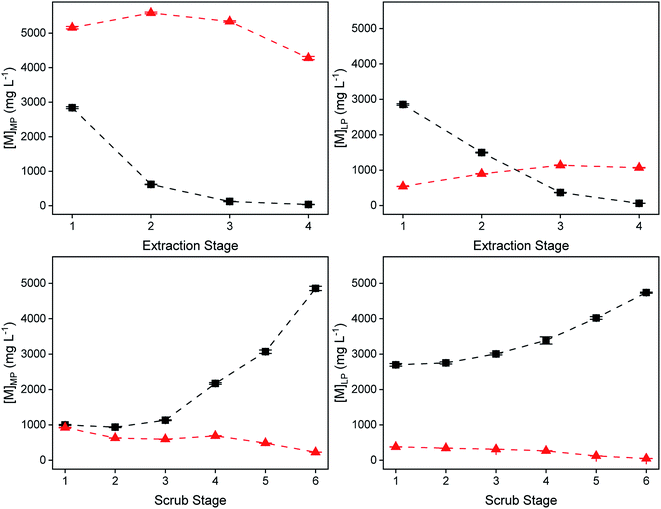
The extraction and scrubbing process was tested in lab-scale mixer–settlers to test the feasibility of working in continuous mode. The composition of the more polar and less polar phase, the scrubbing agent, the volume phase ratio, reaction time and the theoretical number of stages were determined. While the use of a McCabe–Thiele diagram predicted the need for three stages of extraction, four were used, as the stage efficiency is predicted to be significantly lower than 100%, due to the slow kinetics of the system (equilibration time of 20 min). During the experiment, the extraction and scrubbing behavior of indium(III) and zinc(II) was monitored by taking a sample (200 μL) of the more polar and less polar phase every 30 min to 60 min from each extraction or scrubbing chamber. Equilibrium was reached after about 10 hours of operation for the extraction process and after about 12 hours for the scrubbing process, after which the system remained stable over time, with only minor variations in the metal concentrations (Fig. S14 and S15 ESI†). No precipitation or third-phase formation was observed during the entire operation. As a result, Fig. 14 shows the concentration profile of indium(III) and zinc(II) across the mixer–settler battery. During the four-stage extraction, 99% of In(III) was extracted. Co-extraction of Zn(II) was limited to 19%, which was subsequently for the most part removed (90%) from the loaded less polar phase after the six scrubbing stages. A high amount of In(III) (92%) was extracted from the scrub feed to the loaded less polar phase. The final loaded LP phase exiting the mixer–settlers contained indium of a purity of 98%. The density, viscosity of the MPinlet, MPoutlet, LPinlet and LPoutlet at equilibrium for extraction and scrubbing are listed in Table 5. The solubility of p-cymene in the more polar phase for extraction was 269 ± 117 ppm and for scrubbing 373 ± 126 ppm, respectively. The solubility of Cyphos IL 101 in the more polar phase was 178 ± 2 ppm for extraction and 77 ± 1 ppm for scrubbing. After the continuous scrubbing experiment, the loaded less polar phase contained 4.7 g L−1 of indium(III). Precipitation stripping was performed using 3 times stoichiometric amount of NaOH with respect to indium(III) by addition of an aqueous NaOH solution in a 1![[thin space (1/6-em)]](https://www.rsc.org/images/entities/char_2009.gif) :
:![[thin space (1/6-em)]](https://www.rsc.org/images/entities/char_2009.gif) 1 volume phase ratio. ICP-OES analysis of the less polar and more polar phase confirmed quantitative stripping and precipitation. The recovered hydroxide residue was filtered (Whatman GF/A) and dried (Schlenk line, 80°, 24 h). The purity was determined by ICP and corresponded to 98.5% indium(III) and 1.5% zinc(II).
1 volume phase ratio. ICP-OES analysis of the less polar and more polar phase confirmed quantitative stripping and precipitation. The recovered hydroxide residue was filtered (Whatman GF/A) and dried (Schlenk line, 80°, 24 h). The purity was determined by ICP and corresponded to 98.5% indium(III) and 1.5% zinc(II).
| Extraction | Scrubbing | |||||||
|---|---|---|---|---|---|---|---|---|
| MPinlet | MPoutlet | LPinlet | LPoutlet | MPinlet | MPoutlet | LPinlet | LPoutlet | |
| a sρ ≤ 1.589 × 10⁻⁴ g mL−1 for all the samples. | ||||||||
| Density (g mL−1)a | 1.195 | 1.186 | 0.854 | 0.861 | 1.188 | 1.181 | 0.861 | 0.862 |
| Viscosity (mPa s−1) | 139 ± 1 | 130 ± 4 | 0.92 ± 0.01 | 0.98 ± 0.01 | 138 ± 1 | 122 ± 1 | 0.98 ± 0.01 | 1.08 ± 0.06 |
Conclusions
A process for the separation of indium(III) and zinc(II) from ethylene glycol solutions by non-aqueous solvent extraction with the ionic liquid Cyphos IL 101 was developed. Indium(III) was selectively extracted with minimum co-extraction of zinc(II) using Cyphos IL 101 from ethylene glycol, whereas the extraction was inefficient from aqueous chloride solutions. In ethylene glycol at low LiCl concentrations, the bridging (InCl3)2(EG)3 or mononuclear (InCl3)(EG)2 complex is proposed. At higher LiCl concentrations, the coordination changes to two oxygen atoms of one bidentate ethylene glycol ligand and four chloride anions ([In(EG)Cl4]−). In the less polar phase indium(III) is present as a tetrahedral [InCl4]− complex independent of the LiCl concentration in the more polar phase. Raman spectroscopy, infrared spectroscopy, EXAFS and 115In NMR were used to characterize the dominant species in solution. Based on a McCabe–Thiele plot, four-stage counter-current extraction simulations were conducted to fully extract indium(III). The co-extracted zinc(II) was removed by a six-stage counter-current scrubbing with an indium(III)-containing scrub feed solution. The indium in the final loaded less polar phase exiting the mixer–settlers had a purity of 98%. The loaded indium(III) could be recovered as In(OH)3 (98.5%) by precipitation stripping with an aqueous NaOH solution.Conflicts of interest
There are no conflicts to declare.Acknowledgements
The research received funding from the European Research Council (ERC) under the European Union's Horizon 2020 Research and Innovation Programme: Grant Agreement 694078—Solvometallurgy for critical metals (SOLCRIMET). The FWO Flanders is acknowledged for funding of the DUBBLE and of a Raman microscope (project I000718N).References
- D. Pradhan, S. Panda and L. B. Sukla, Miner. Process. Extr. Metall. Rev., 2018, 39, 167–180 CrossRef.
- A. M. Alfantazi and R. R. Moskalyk, Miner. Eng., 2003, 16, 687–694 CrossRef CAS.
- N. Felix, in Ullmann's Encyclopedia of Industrial Chemistry, ed. F. Ullmann, Wiley-VCH, Weinheim, 2012, pp. 65–74 Search PubMed.
- T. H. Nguyen and L. Man Seung, Miner. Process. Extr. Metall. Rev., 2019, 40, 278–291 CrossRef CAS.
- A. P. Paiva, Sep. Sci. Technol., 2001, 36, 1395–1419 CrossRef CAS.
- J. Yang, T. Retegan and C. Ekberg, Hydrometallurgy, 2013, 137, 68–77 CrossRef CAS.
- M. C. B. Fortes and J. S. Benedetto, Miner. Eng., 1998, 11, 447–451 CrossRef CAS.
- T. Sato, J. Inorg. Nucl. Chem., 1975, 37, 1485–1488 CrossRef CAS.
- W.-S. Chou, Y.-H. Shen, S.-J. Yang, T. -C. Hsiao and L. -F. Huang, Environ. Prog. Sustainable Energy, 2016, 35, 758–763 CrossRef CAS.
- L. Xingbin, D. Zhigan, L. Cunxiong, W. Chang, L. Minting, F. Gang and R. Hao, Hydrometallurgy, 2015, 156, 1–5 CrossRef.
- S. Virolainen, D. Ibana and E. Paatero, Hydrometallurgy, 2011, 107, 56–61 CrossRef CAS.
- M. S. Lee, J. G. Ahn and E. C. Lee, Hydrometallurgy, 2002, 63, 269–276 CrossRef CAS.
- H. N. Kang, J.-Y. Lee and J.-Y. Kim, Hydrometallurgy, 2011, 110, 120–127 CrossRef CAS.
- R. Vostal, M. Reiber and M. Bertau, Chem. Ing. Tech., 2019, 91, 1681–1687 CrossRef CAS.
- B. Gupta, N. Mudhar and I. Singh, Sep. Purif. Technol., 2007, 57, 294–303 CrossRef CAS.
- M. A. Rodriguez, G. Cote and D. Bauer, Solvent Extr. Ion Exch., 1992, 10, 811–827 CrossRef.
- M. Avila-Rodríguez, G. Cote, R. Navarro Mendoza, T. I. Saucedo Medina and D. Bauer, Solvent Extr. Ion Exch., 1998, 16, 471–485 CrossRef.
- M. S. Lee and J. G. Ahn, Korean J. Met. Mater., 2015, 53, 488–494 CrossRef CAS.
- J. Yang, T. Retegan, B.-M. Steenari and C. Ekberg, Sep. Purif. Technol., 2016, 166, 117–124 CrossRef CAS.
- B. Gupta, A. Deep and P. Malik, Anal. Chim. Acta, 2004, 513, 463–471 CrossRef CAS.
- S. Dhiman and B. Gupta, Sep. Purif. Technol., 2020, 237, 116407 CrossRef.
- M. F. Volia, E. E. Tereshatov, M. Boltoeva and C. M. Folden, New J. Chem., 2020, 44, 2527–2537 RSC.
- F. J. Alguacil and E. Escudero, Hydrometallurgy, 2019, 189, 105104 CrossRef CAS.
- L. Deliang, Z. Nengwu, L. Yao, C. Jiaying, W. Pingxiao and W. Jieyuan, Hydrometallurgy, 2019, 189, 105146 CrossRef.
- S. Van Roosendael, M. Regadio, J. Roosen and K. Binnemans, Sep. Purif. Technol., 2019, 212, 843–853 CrossRef CAS.
- M. Matsumiya, M. Sumi, Y. Uchino and I. Yanagi, Sep. Purif. Technol., 2018, 201, 25–29 CrossRef CAS.
- C. Deferm, J. Luyten, H. Oosterhof, J. Fransaer and K. Binnemans, Green Chem., 2018, 20, 412–424 RSC.
- T. Vander Hoogerstraete, B. Onghena and K. Binnemans, J. Phys. Chem. Lett., 2013, 4, 1659–1663 CrossRef PubMed.
- X. Han and D. W. Armstrong, Acc. Chem. Res., 2007, 40, 1079–1086 CrossRef CAS PubMed.
- F. Kubota and M. Goto, Solvent Extr. Res. Dev., Jpn., 2006, 13, 23–36 CAS.
- M. L. Dietz, Sep. Sci. Technol., 2006, 41, 2047–2063 CrossRef CAS.
- C. Deferm, M. Van de Voorde, J. Luyten, H. Oosterhof, J. Fransaer and K. Binnemans, Green Chem., 2016, 18, 4116–4127 RSC.
- C. Deferm, B. Onghena, T. Vander Hoogerstraete, D. Banerjee, J. Luyten, H. Oosterhof, J. Fransaerc and K. Binnemans, Dalton Trans., 2017, 46, 4412–4421 RSC.
- N. K. Batchu, T. Vander Hoogerstraete, D. Banerjee and K. Binnemans, Sep. Sci. Technol., 2017, 174, 544–553 CAS.
- K. Binnemans and P. T. Jones, J. Sustain. Met., 2017, 3, 570–600 CrossRef.
- A. R. Burns and R. W. Cattrall, J. Inorg. Nucl. Chem., 1973, 35, 2489–2496 CrossRef CAS.
- M. R. St. J. Foreman, Cogent Chem., 2016, 2, 1139289 Search PubMed.
- N. K. Batchu, B. Dewulf, S. Riano and K. Binnemans, Sep. Purif. Technol., 2020, 235, 116193 CrossRef CAS.
- N. K. Batchu, T. Vander Hoogerstraete, D. Banerjee and K. Binnemans, RSC Adv., 2017, 7, 45351–45362 RSC.
- Z. Li, B. Onghena, X. Li, Z. Zhang and K. Binnemans, Ind. Eng. Chem., 2019, 58, 15628–15636 CrossRef CAS PubMed.
- Z. Li, Z. Zhang, S. Smolders, X. Li, S. Raiguel, E. Nies, D. E. De Vos and K. Binnemans, Chem.–Eur. J., 2019, 25, 9197–9201 CrossRef CAS PubMed.
- Z. Li, X. Li, S. Raiguel and K. Binnemans, Sep. Sci. Technol., 2018, 201, 318–326 CAS.
- S. Nikitenko, A. M. Beale, A. M. van der Eerden, S. D. Jacques, O. Leynaud, M. G. O'Brien, D. Detollenaere, R. Kaptein, B. M. Weckhuysen and W. Bras, J. Synchrotron Radiat., 2008, 15, 632–640 CrossRef CAS PubMed.
- K. V. Klementev, Nucl. Instrum. Methods Phys. Res., Sect. A, 2000, 448, 299–301 CrossRef CAS.
- M. Newville, J. Synchrotron Radiat., 2001, 8, 96–100 CrossRef CAS PubMed.
- C. Deferm, J. C. Malaquias, B. Onghena, D. Banerjee, J. Luyten, H. Oosterhof, J. Fransaer and K. Binnemans, Green Chem., 2019, 21, 1517–1530 RSC.
- F. G. Seeley and D. J. Crouse, J. Chem. Eng. Data, 1966, 11, 424–429 CrossRef CAS.
- A. Cieszynska and M. Wiśniewski, Sep. Purif. Technol., 2011, 80, 385–389 CrossRef CAS.
- A. Cieszynska and M. Wiśniewski, Hydrometallurgy, 2012, 113–114, 79–85 CrossRef CAS.
- P. Rybka and M. Regel-Rosock, Sep. Sci. Technol., 2012, 47, 1296–1302 CrossRef CAS.
- M. Regel-Rosocka and M. Wiśniewski, Hydrometallurgy, 2011, 110, 85–90 CrossRef CAS.
- M. Regel-Rosocka, Ł. Nowak and M. Wiśniewski, Sep. Purif. Technol., 2012, 97, 158–163 CrossRef CAS.
- R. K. Mishra, P. C. Rout, K. Sarangi and K. C. Nathsarma, Hydrometallurgy, 2011, 108, 93–99 CrossRef CAS.
- L. Poriel, A. Favre-Réguillon, S. Pellet-Rostaing and M. Lemaire, Sep. Purif. Technol., 2006, 41, 1927–1940 CAS.
- P. J. Carvalho, S. P. M. Ventura, M. L. S. Batista, B. Schröder, F. Gonçalves, J. Esperança, F. Mutelet and J. A. P. Coutinho, J. Chem. Phys., 2014, 140, 064505 CrossRef PubMed.
- K. A. Kurnia, M. V. Quental, L. M. N. B. F. Santos, M. G. Freire and J. A. P. Coutinhoa, Phys. Chem. Chem. Phys., 2015, 17, 4569–4577 RSC.
- H. Narita, M. Tanaka, H. Shiwaku, Y. Okamoto, S. Suzuki, A. Ikeda-Ohnob and T. Yaitab, Dalton Trans., 2014, 43, 1630–1635 RSC.
- D. Knetsch and W. L. Groeneveld, Inorg. Chim. Acta, 1973, 7, 81–87 CrossRef CAS.
- R. M. Williams and R. H. Atalla, J. Chem. Soc., Perkin Trans. 2, 1975, 1155–1161 RSC.
- G. Carta, F. Benetollo, S. Sitran, G. Rossetto, F. Braga and P. Zanella, Polyhedron, 1995, 14, 1923–1928 CrossRef CAS.
- D. Bright, G. H. W. Milburn and M. R. Truter, J. Chem. Soc. A, 1971, 1582–1586 RSC.
- I. Labádi, K. Burger, G. Liptay, M. Czugler and A. Kálmán, J. Therm. Anal., 1986, 31, 1171–1181 CrossRef.
- K. Krishnan and R. S. Krishnan, Proc. – Indian Acad. Sci., Chem. Sci., 1966, 64, 111–123 CrossRef CAS.
- C. Murli, N. Lu, Z. Dong and Y. Song, J. Phys. Chem. B, 2012, 116, 12574–12580 CrossRef CAS PubMed.
- P. Buckley and P. A. Giguère, Can. J. Chem., 1967, 45, 397–407 CrossRef CAS.
- W. Sawodny, K. Niedenzu and J. W. Dawson, Spectrochim. Acta, Part A, 1967, 23, 799–806 CrossRef CAS.
- M. N. Rodnikova, N. A. Chumaevskii, V. M. Troitskii and D. B. Kayumova, Russ. J. Phys. Chem., 2006, 80, 826–830 CrossRef CAS.
- A. Miyake, Bull. Chem. Soc. Jpn., 1959, 32, 1381–1383 CrossRef CAS.
- A. Miyake, J. Am. Chem. Soc., 1960, 82, 3040–3043 CrossRef CAS.
- Y. Kuroda and M. Kubo, J. Polym. Sci., 1957, 26, 323–328 CrossRef CAS.
- Y.-C. Guo, C. Cai and Y.-H. Zhang, AIP Adv., 2018, 8, 055308 CrossRef.
- S. Tanga and H. Zhao, RSC Adv., 2014, 4, 11251–11287 RSC.
- D. N. Sathyanarayana, Vibrational Spectroscopy: Theory and Applications, New Age International, New Delhi, 2005, pp. 406–410 Search PubMed.
- R. A. Work and M. L. Good, Spectrochim. Acta, Part A, 1973, 29, 1535–1545 CrossRef CAS.
- J.-S. Cho and H.-G. Cho, Bull. Korean Chem. Soc., 2009, 30, 803–809 CrossRef CAS.
- J.-S. Cho and H.-G. Cho, J. Korean Chem. Soc., 2007, 51, 287–290 CrossRef CAS.
- W. T. Robinson, C. J. Wilkins and Z. Zeying, J. Chem. Soc., Dalton Trans., 1990, 219–227 RSC.
- M. J. Taylor, J. Chem. Soc. A, 1967, 1462–1464 RSC.
- A. J. Carty, H. A. Patel and P. M. Boorman, Can. J. Chem., 1970, 48, 492–500 CrossRef CAS.
- J.-Z. Yang, P. Tian, W.-G. Xu, B. Xu and S.-Z. Liu, Thermochim. Acta, 2004, 412, 1–5 CrossRef CAS.
- J.-Z. Yang, P. Tian, L.-L. He and W.-G. Xu, Fluid Phase Equilib., 2003, 204, 295–302 CrossRef CAS.
- A. J. Carty and D. G. Tuck, J. Chem. Soc. A, 1966, 1081–1087 RSC.
- B. F. G. Johnson and R. A. Walton, Inorg. Chem., 1966, 5, 49–53 CrossRef CAS.
- J. Gislason, M. H. Lloyd and D. G. Tuck, Inorg. Chem., 1971, 10, 1907–1910 CrossRef.
- J. W. Akitt, in Multinuclear NMR, ed. J. Mason, Plenum Press, New York, 1987, ch. 9, pp. 259–287 Search PubMed.
- M. A. Malyarick and S. P. Petrosyants, Inorg. Chem., 1993, 32, 2265–2268 CrossRef CAS.
- D. C. Apperley, C. Hardacre, P. Licence, R. W. Murphy, N. V. Plechkova, K. R. Seddon, G. Srinivasan, M. Swadźba-Kwaśny and I. J. Villar-Garcia, Dalton Trans., 2010, 39, 8679–8687 RSC.
- C. Hardacre, R. W. Murphy, K. R. Seddon, G. Srinivasan and M. Swadzba-Kwasny, Aust. J. Chem., 2010, 63, 845–848 CrossRef CAS.
- J. Estager, A. A. Oliferenko, K. R. Seddon and M. Swadźba-Kwaśny, Dalton Trans., 2010, 39, 11375–11382 RSC.
- A. Fratiello, D. D. Davis, S. Peak and R. E. Schuster, Inorg. Chem., 1971, 10, 1627–1632 CrossRef CAS.
- B. R. McGarvey, C. O. Trudell, D. G. Tuck and L. Victoriano, Inorg. Chem., 1980, 19, 3432–3436 CrossRef CAS.
- T. H. Cannon and R. E. Richards, Trans. Faraday Soc., 1966, 62, 1378–1387 RSC.
- H. Haraguchi, K. Fuwa and S. Fujiwara, J. Phys. Chem., 1973, 77, 1497–1500 CrossRef CAS.
- D. C. Apperley, C. Hardacre, P. Licence, R. W. Murphy, N. V. Plechkova, K. R. Seddon, G. Srinivasan, M. Swadźba-Kwaśny and I. J. Villar-Garcia, Dalton Trans., 2010, 39, 8679–8687 RSC.
- C. Hardacre, R. W. Murphy, K. R. Seddon, G. Srinivasan and M. Swadzba-Kwasny, Aust. J. Chem., 2010, 63, 845–848 CrossRef CAS.
- Z. Li, K. H. Smith and G. W. Stevens, Chin. J. Chem. Eng., 2016, 24, 215–220 CrossRef CAS.
- A. Marchese, C. R. Arciola, R. Barbieri, A. S. Silva, S. F. Nabavi, A. J. T. Sokeng, M. Izadi, N. J. Jafari, I. Suntar, M. Daglia and S. M. Nabavi, Materials, 2017, 10, 947 CrossRef PubMed.
- Z. Li and K. Binnemans, AIChE J., 2020, 68, e16246 Search PubMed.
Footnote |
| † Electronic supplementary information (ESI) available: Mutual solubility graphs, Raman spectra, infrared spectra, kinetic studies, concentration profiles stages mixer–settler. See DOI: 10.1039/d0ra04684a |
| This journal is © The Royal Society of Chemistry 2020 |

