
 Open Access Article
 This Open Access Article is licensed under a Creative Commons Attribution-Non Commercial 3.0 Unported Licence
Converting waste textiles into highly effective sorbent materials†
Bijan Nasri-Nasrabadi and
Nolene Byrne *
*
Institute for Frontier Materials, Deakin University, Geelong, Victoria 3216, Australia. E-mail: nolene.byrne@deakin.edu.au
First published on 12th October 2020
Abstract
Activated carbon fibres with a tubular structure and exfoliated surface were produced utilizing cotton textile waste as the precursor. The synthesized carbon fibres were freeze dried resulting in a tubular structure and large pore size distribution. The absorption properties against various oils and organic solvents were accessed, these fibres showed some of the highest absorption capabilities reported for cellulose based carbons, in particular for olive oil, gasoline and chloroform.
Introduction
A significant amount of textile waste is disposed of in landfill; textile waste accounts for 10–20% of landfill depending on the country.1,2 As such, new approaches for recycling and utilizing waste textiles are under constant development.3,4 One potential solution is the use of cotton based textile waste as a precursor for carbon materials. These materials have applications in areas such as energy storage,5,6 catalyst supports,7,8 and filtration.9,10 In particular for filtration, the low density and inherent hydrophobic nature of carbon substrates make them suitable to remove oil and organic solvents from wastewater.11,12 Carbon substrates can be obtained from either synthesized or natural polymer based materials. However, harmful and expensive starting materials are the key issues associated with the carbon substrates obtained from the synthesized precursors.13 In contrast, waste cotton is an abundant, sustainable and nontoxic resource as cotton is predominately a cellulosic polymer. To date a range of different cellulosic based precursors have been used as absorption substrates and the performance is generally very good owing to high surface area and porosity.14–17 In this study, we report a facile route to produce carbon fibres from waste cotton textile garments; the fibres show significantly higher absorption capabilities than previous reports, due to a tubular structure and exfoliated surface created by combining a freeze drying and CO2 activation. Regenerated cellulose fibres are wet spun using cotton waste and a binary ionic liquid solvent, complete experimental details has been previously published.4,18 The fibres are either air dried as is standard method for producing regenerated cellulose fibres or freeze dried prior to carbonization. Carbonization was achieved by heating the fibres in a nitrogen atmosphere at 5 °C min−1 up to 1100 °C and held for 1 hour.Fig. 1 shows the SEM image of fibre before and after carbonization for both air and freeze dried approaches. The air dried regenerated cellulose fibre exhibits a smooth surface area with a solid and highly packed cross-section as is typical,19,20 the diameter is in the range of 22 ± 3 μm (Fig. 1a). Fig. 1b is the SEM image of the freeze dried fibre (FDF) a different morphology is observed here when compared to the air dried fibre. The FDF shows an exfoliated morphology with microchannels, in the range of 0.5 to 2 μm on the surface. It can also be seen that the freeze drying has resulted in a tubular cross section, with an inner diameter range of 15 ± 3 μm and an outer diameter in the range of 22 ± 3 μm. Fig. 1c shows the air dried sample after carbonization (ADCF). A solid cross section and a smooth surface morphology (Fig. 1c) remains, however a reduction in the diameter has resulted, the diameter has reduced to 5 ± 3 μm. Fig. 2d shows the carbonized freeze dried sample, the exfoliated surface remains as does the tubular structure, with an inner diameter of 12 ± 3 μm and an outer diameter of 17 ± 3 μm. In order to further increase the surface area and porosity, we subjected the freeze dried fibres to CO2 activation, CO2 activation was achieved by exposing the carbonized fibres to CO2 flow for 1 hour at 800 °C. Fig. 2e is the CO2 activated freeze dried carbon fibres (AFDCF). The outer surface of the CO2 activated fibres appears very similar to the freeze dried sample however, new pores in the dimension range less than 1 μm appear on the inner surface of the fibres (Fig. S1†). During the activation, CO2 reacts with carbon atoms via C + CO2 → CO + C(O), where the first product is carbon monoxide gas and the second product is various oxygen complexes which develop on the carbon substrate. The above reaction removes delicate carbon atoms from the substrate via the conversion of carbon to carbon monoxide gas (CO).21,22 The generated CO creates new pores on the fibres inner surface.
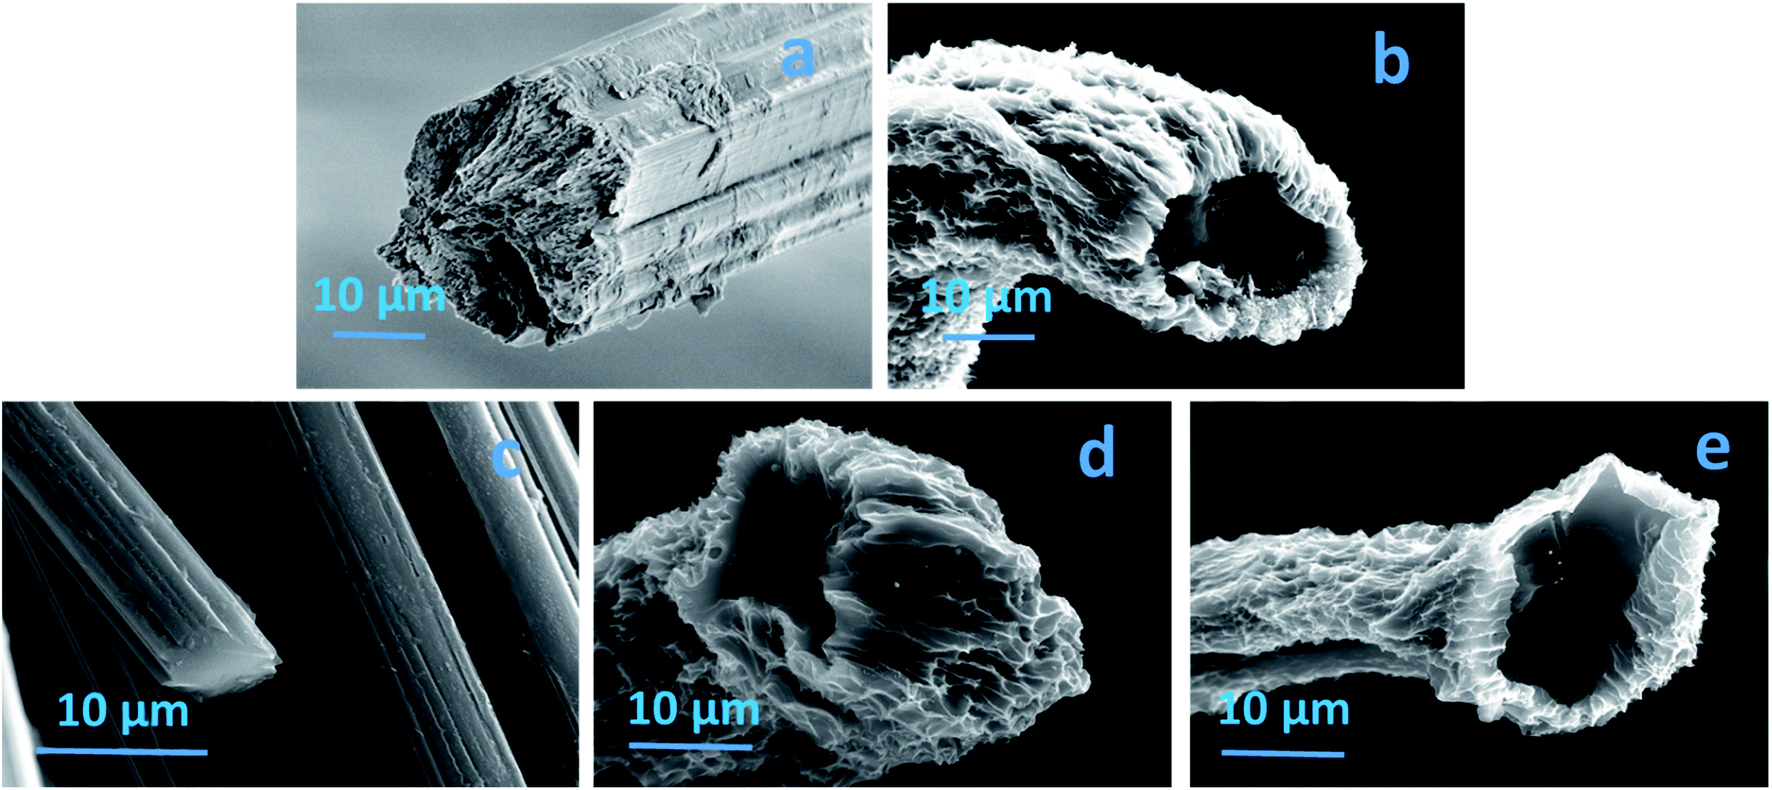 | ||
| Fig. 1 (a) The SEM image of the air dried fibre (ADF), (b) freeze dried fibre (FDF), (c) air dried carbon fibre (ADCF), (d) freeze dried carbon fibre (FDCF), and (e) CO2 activated freeze dried carbon fibre (AFDCF). | ||
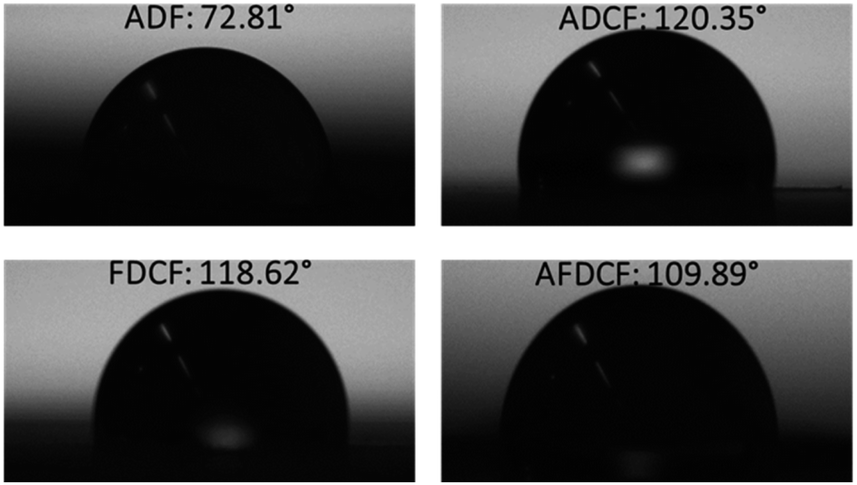 | ||
| Fig. 2 The water contact angle measurement of air dried fibre (ADF), air dried carbon fibre (ADCF), freeze dried carbon fibre (FDCF), and CO2 activated freeze dried carbon fibres (AFDCF). | ||
Table 1 lists the pore characteristics of the fibres before and after carbonization, obtained from N2 absorption. As expected, the freeze dried fibres (FDF) show an overall higher pore volume and surface area compared with the air dried fibres (ADF). The FDF displays a cumulative pore volume and surface area of 13.51 cm3 g−1 and 89 m2 g−1, while the ADF sample displays a cumulative pore volume and surface area of 0.02 cm3 g−1 and 2 m2 g−1. Carbonization of the fibres resulted in the generation of pores in the meso and micropore range for both ADF and FDF fibres. This is due to the removal of the non-carbon elements. In the case of the CO2 activated fibre, larger pores in the range of macro are present. As the results show the macropores volume of the FDCF increased from 12.37 cm3 g−1 to 25.74 cm3 g−1 with CO2 activation. We also observed a significant increase of the surface area from 197 m2 g−1 for the FDCF to 312 m2 g−1 for the CO2 activated FDCF. As such the CO2 activation applied here, produces fibres with a greater pore size distribution.
| Sample | Surface area, m2 g−1 | Pore volume, cm3 g−1 | Micropores volume, cm3 g−1 | Mesopores volume, cm3 g−1 | Macropores volume, cm3 g−1 |
|---|---|---|---|---|---|
| ADF | 2 | 0.02 | 0.02 | 0 | 0 |
| FDF | 89 | 13.51 | 0.04 | 0.12 | 13.35 |
| ADCF | 72 | 0.09 | 0.05 | 0.04 | 0 |
| FDCF | 197 | 12.60 | 0.08 | 0.15 | 12.37 |
| AFDCF | 312 | 25.96 | 0.11 | 0.10 | 25.74 |
The fibres hydrophobicity was measured, which is a key parameter to determine material capacity and performance to absorb organic solvents and spilled oils. Fig. 2 is the contact angle values before and after carbonization. Regenerated cellulose fibres are highly hydrophilic, in general, here the water contact angle was measured to be 72.81°, an increase in hydrophobicity results from carbonization. The carbonized air dried and freeze dried samples showed almost similar contact angle values of 120.35° and 119.62° respectively. After CO2 activation, however, we found a slight decrease in the contact angle, the CO2 activated sample (AFDCF) has a water contact angle of 109.89°, which is around 10 degree lower than the value range of other the two carbonized fibres. This decrease can be due to the generation of new oxygen complexes on the carbon fibres surface after the CO2 activation.
ATR-FTIR analyse shows the change in the surface groups for the regenerated cellulose and carbonized cellulose fibres. The freeze dried cellulose fibre reveals characteristic peaks of hydrophilic functional groups (Fig. 3). The absorption peak at 1065 cm−1 ascribes to the skeletal vibration of C–O–C groups. The broad peak between 3100 cm−1 and 3600 cm−1 ascribed to stretching of –OH groups. It should be stated that both the freeze dried and air dried cellulose fibres showed similar spectrums. After carbonization, as the FTIR results show these functional groups have disappeared, as is expected for carbonized materials and explains the change from hydrophilic to hydrophobic substrates. For the CO2 activated sample, two weak absorption peaks in the range 3200–2700 cm−1 and around 2350 cm−1 are observed, this likely ascribe to the –OH intramolecular bonds and O![[double bond, length as m-dash]](https://www.rsc.org/images/entities/char_e001.gif) CO groups. These new absorption peaks correlate to the formation of new oxygen complexes after CO2 activation and thus the lowering of the contact angle.
CO groups. These new absorption peaks correlate to the formation of new oxygen complexes after CO2 activation and thus the lowering of the contact angle.
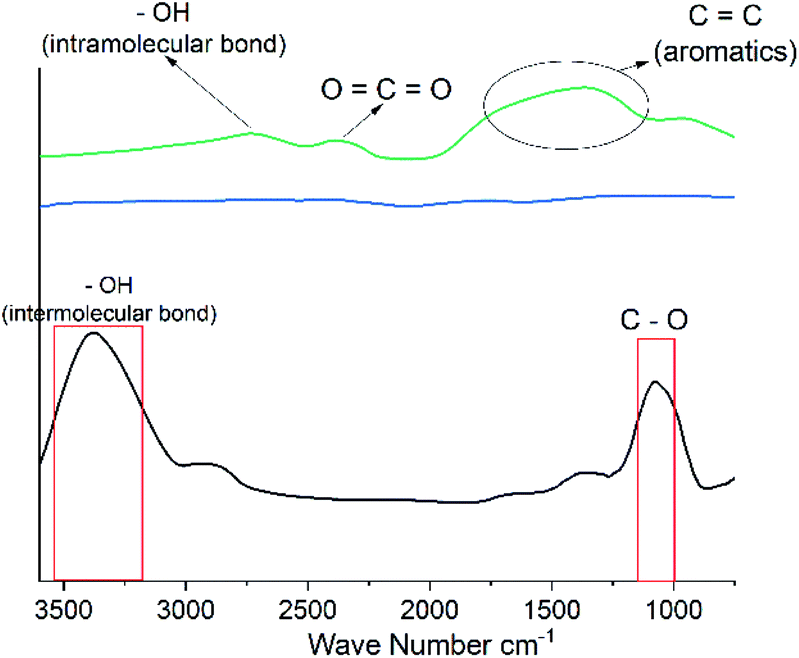 | ||
| Fig. 3 The ATR-FTIR spectra of the freeze dried cellulose fibre (FDF) (black), freeze dried carbon fibre (FDCF) (blue), and CO2 activated freeze dried carbon fibres (AFDCF) (green). | ||
In order to quantify the absorption performance, the weight gain is defined as the weight of the uptake liquid per the dried fibres weight. Fig. 4 shows the weight gain values of the three different carbon fibres, air dried (ADCF), freeze dried (FDCF) and CO2 activated (AFDCF) for heptane, ethanol, chloroform, gasoline, and olive oil. Based on the results, we found that in general the FDCF displayed a higher absorbance capability than the ADCF, which correlates to the exfoliated surface morphology and the tubular structure. As can be seen, the FDCF shows around 71%, 91%, 41%, 41%, and 34% higher weight gain, when compared to the ADCF (for ethanol, heptane, chloroform, gasoline, and olive oil respectively). With CO2 activation, we observed a significant enhancement in the weight again performance for all solutes tested. The CO2 activated fibre demonstrate an absorption capacity range of 75–175 g g−1, which is higher than that of sorbents from other lignocellulosic sources such as carbon aerogels from winter melon (25–50 g g−1),23 carbon nanofiber hydrogel/aerogels (45–65 g g−1),24 carbon fibre aerogels derived from bamboo (40–75 g g−1),15 hollow carbon fibres sponges from crude catkins (75–140 g g−1),25 and carbon fibre aerogel made from raw cotton (50–110 g g−1)11 for similar solutes. The increase in the absorption capacity of the activated sample reported here is likely due to the generation of additional macropores, upon activation.
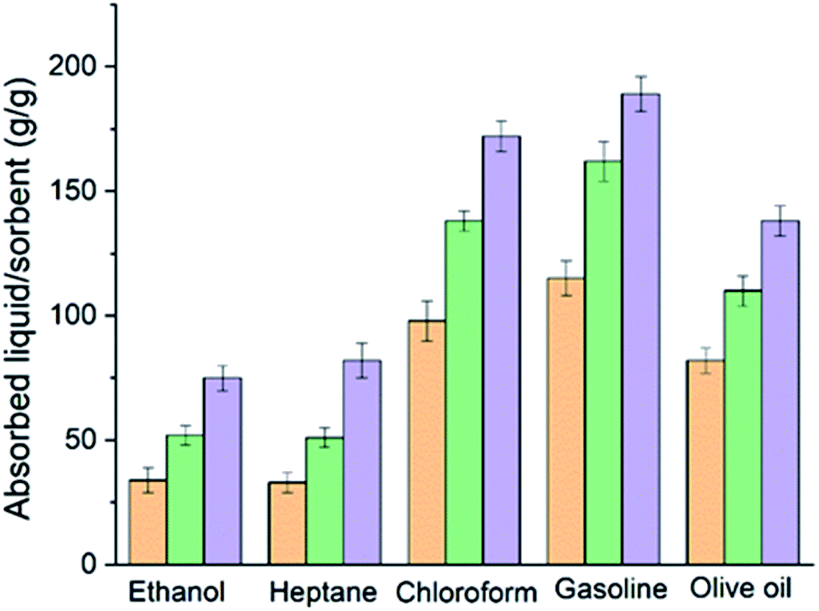 | ||
| Fig. 4 Weight gain values for different solutes, where orange is for air dried carbon fibres (ADCF), green is for freeze dried carbon fibres (FDCF) and purple for CO2 activated freeze dried carbon fibre (AFDCF). | ||
The recoverability of the sorbent and the recyclability of the absorbed chemical are key factors in developing a cost effective water clean-up processes. Generally, an absorbed chemical is extracted via either distillation for useful chemicals with low boiling points, squeezing for useful chemicals with high boiling points or combustion for useless and flammable chemicals. Here the recoverability of the sorbent after combustion and also the recyclability of the solutes via an absorption/distillation process was accessed using ethanol and gasoline. Direct consumption in air is used to test the absorption/consumption recoverability of the CO2 activated freeze dried carbon fibre (AFDCF). After five absorption/consumption cycles, for ethanol and gasoline, we observed 96% and 90% respectively of their weight gain capacity in comparison to the first cycle Fig. 5a shows the 5 absorption/consumption cycles for ethanol and the corresponding gasoline data is in the ESI Fig. S2a.† The higher decrease in the absorption capacity of the carbon fibres for gasoline is most likely due to the deposition of residues within the porous structure and on the surface of the carbon fibres after combustion.26
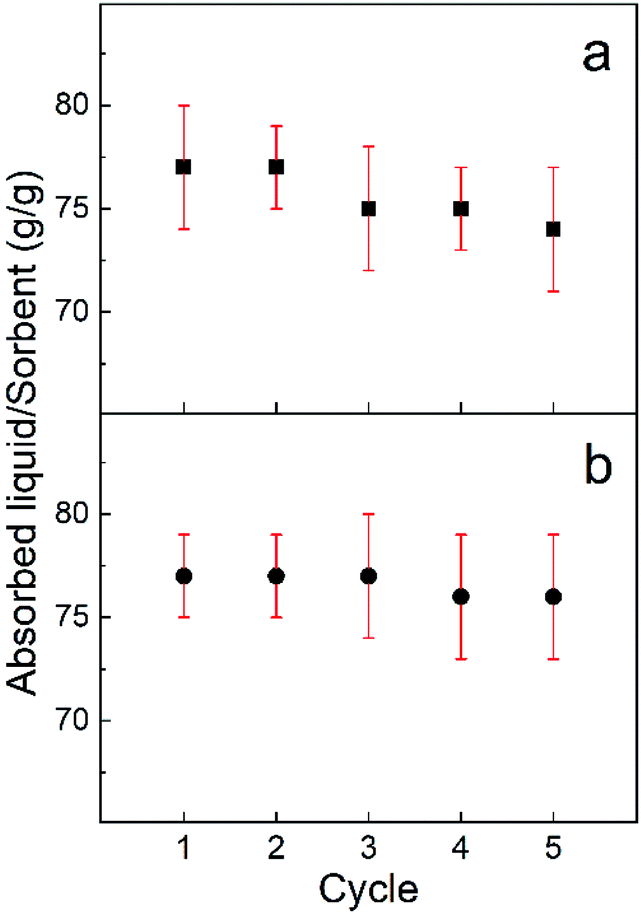 | ||
| Fig. 5 (a) The absorption/combustion and (b) the absorption/distillation recyclability of the CO2 activated freeze dried carbon fibres with ethanol. | ||
We also employed distillation to recover the carbon fibres and harvest the chemical. Ethanol with a boiling point of around 78 °C and gasoline with a boiling point of around 200 °C were used to demonstrate recyclability of the absorbed solute and the recoverability of the sorbent after each absorption/distillation cycle. Fig. 5b shows the trend of absorption/distillation cycles for ethanol, repeated for five times. We found that, the AFDCF can almost fully recover its absorption capacity with no noticeable change of the sorbent mass after each cycle. This suggests the self-supporting microstructure of the porous carbon fibres and allows the sorbent to preserve its saturated capacity with a repeatable performance. Regarding the gasoline, we again found a decline in the absorption capacity of the fibres after each cycle. As Fig. S2b† shows the saturated capacity of the carbon fibres after the 2th, 3rd, 4th, and 5th cycles was 91%, 90%, 84%, and 82% compared to cycle 1.
Conclusions
In this study we developed a facile method to produce tubular carbon fibres utilizing cotton waste textile as the precursor. The obtained fibres exhibited an exfoliated surface area. We found that CO2 activation enhanced the surface area and resulted in a broader pore size distribution. The absorption capacity of these new fibres was examined and they showed extremely excellent absorption ability, some the highest absorption values reported to date for cellulosic based carbon materials.Conflicts of interest
There are no conflicts to declare.References
- Y. Wang, Waste Biomass Valorization, 2010, 1, 135–143 CrossRef.
- G. Sandin and G. M. Peters, J. Cleaner Prod., 2018, 184, 353–365 CrossRef CAS.
- B. Zeng, X. Wang and N. Byrne, Carbohydr. Polym., 2019, 205, 1–7 CrossRef CAS.
- Y. Ma, B. Zeng, X. Wang and N. Byrne, ACS Sustainable Chem. Eng., 2019, 7, 11937–11943 CAS.
- L. Li, F. Lu, C. Wang, F. Zhang, W. Liang, S. Kuga, Z. Dong, Y. Zhao, Y. Huang and M. Wu, J. Mater. Chem. A, 2018, 6, 24468–24478 RSC.
- Y. Cui, W. Liu, Y. Lyu, Y. Zhang, H. Wang, Y. Liu and D. Li, J. Mater. Chem. A, 2018, 6, 18276–18285 RSC.
- A. M. ElKhatat and S. A. Al-Muhtaseb, Adv. Mater., 2011, 23, 2887–2903 CrossRef CAS.
- A. C. Pierre and G. M. Pajonk, Chem. Rev., 2002, 102, 4243–4266 CrossRef CAS.
- Q. Zuo, Y. Zhang, H. Zheng, P. Zhang, H. Yang, J. Yu, J. Tang, Y. Zheng and J. Mai, Chem. Eng. J., 2019, 365, 175–182 CrossRef CAS.
- K. K. Shimabuku, T. L. Zearley, K. S. Dowdell and R. S. Summers, Environ. Sci.: Water Res. Technol., 2019, 5, 849–860 RSC.
- H. Bi, Z. Yin, X. Cao, X. Xie, C. Tan, X. Huang, B. Chen, F. Chen, Q. Yang and X. Bu, Adv. Mater., 2013, 25, 5916–5921 CrossRef CAS.
- A. Saini, P. H. Maheshwari, S. S. Tripathy, S. Waseem and S. Dhakate, Journal of Water Process Engineering, 2020, 34, 101136 CrossRef.
- Z. Y. Wu, C. Li, H. W. Liang, J. F. Chen and S. H. Yu, Angew. Chem., Int. Ed., 2013, 52, 2925–2929 CrossRef CAS.
- K. Hina, H. Zou, W. Qian, D. Zuo and C. Yi, Cellulose, 2018, 25, 607–617 CrossRef CAS.
- S. Yang, L. Chen, L. Mu, B. Hao and P.-C. Ma, RSC Adv., 2015, 5, 38470–38478 RSC.
- H. Voisin, L. Bergström, P. Liu and A. P. Mathew, Nanomaterials, 2017, 7, 57 CrossRef.
- N. El Badawi, A. R. Ramadan, A. M. Esawi and M. El-Morsi, Desalination, 2014, 344, 79–85 CrossRef CAS.
- B. Nasri-Nasrabadi, X. Wang and N. Byrne, J. Text. Inst., 2020, 1–10 Search PubMed.
- Y. Ma, B. Nasri-Nasrabadi, X. You, X. Wang, T. J. Rainey and N. Byrne, J. Nat. Fibers, 2020, 1–13 Search PubMed.
- W. P. F. Neto, J.-L. Putaux, M. Mariano, Y. Ogawa, H. Otaguro, D. Pasquini and A. Dufresne, RSC Adv., 2016, 6, 76017–76027 RSC.
- G. Zu, J. Shen, L. Zou, F. Wang, X. Wang, Y. Zhang and X. Yao, Carbon, 2016, 99, 203–211 CrossRef CAS.
- Q. Hu and M.-S. Kim, Carbon Lett., 2008, 9, 298–302 CrossRef.
- Y.-Q. Li, Y. A. Samad, K. Polychronopoulou, S. M. Alhassan and K. Liao, ACS Sustainable Chem. Eng., 2014, 2, 1492–1497 CrossRef CAS.
- H. W. Liang, Q. F. Guan, L. F. Chen, Z. Zhu, W. J. Zhang and S. H. Yu, Angew. Chem., Int. Ed., 2012, 51, 5101–5105 CrossRef CAS.
- L. Zang, Z. Bu, L. Sun and Y. Zhang, RSC Adv., 2016, 6, 48715–48719 RSC.
- K.-W. Youm and S.-J. Kim, Journal of the Korea Society For Power System Engineering, 2014, 18, 11–15 CrossRef.
Footnote |
| † Electronic supplementary information (ESI) available. See DOI: 10.1039/d0ra04616g |
| This journal is © The Royal Society of Chemistry 2020 |