
 Open Access Article
 This Open Access Article is licensed under a Creative Commons Attribution-Non Commercial 3.0 Unported Licence
Reliable prediction of n-heptane isomerization over Pt/(CrOx/ZrO2)-HMS via comparative assessment of regularization networks and surface response methodologies†
Nastaran Parsafard *a,
Ali Garmroodi Asil*b and
Shohreh Mirzaeic
*a,
Ali Garmroodi Asil*b and
Shohreh Mirzaeic
aKosar University of Bojnord, Iran. E-mail: n-parsafard@kub.ac.ir
bBojnourd University, Iran
cFerdowsi University of Mashhad, Iran
First published on 15th July 2020
Abstract
Novel Pt–Cr/Zr(x)-HMS catalysts with different molar ratios of Cr/Zr were synthesized. These catalysts were characterized by necessary techniques including XRD, XRF, NH3-TPD, FTIR, H2 chemisorption, nitrogen sorption and TGA. Moreover, generalization performances of an optimized in-house regularization network and an RSM were compared for the prediction of activity and selectivity versus various molar ratios, feed temperatures and time on stream. The results indicated that the incorporation of Cr promotes the catalyst activity, in which a high amount of 63% conversion was obtained at Cr/Zr = 30 and T = 200 °C. Increasing temperature has an adverse effect on i-C7 and mono plus multi-branch isomer selectivity nearly in all amounts of molar ratios. The best i-C7 selectivity (66%), MOB (29.6%) and MUB (32%) were observed at 200 °C and Cr/Zr = 30. Although both modeling methods exhibited outstanding performances, statistical analysis revealed that optimized RN has slightly better performances than RSM.
Introduction
It is well proved that increasing energy consumption and pollutant emissions in transportation require consideration of both fuel production and vehicle efficiency. On a long-term perspective, higher octane fuels should be utilized by engine designers to enhance the fuel efficiency using higher compression ratios, boost pressures, and other techniques.1,2 Moreover, aromatics, especially benzene, are one of the most environmentally intimidating compounds existing in unclean air. The release of these harmful compounds from various sources, especially from motor vehicles, leads to serious health problems. Due to the concern about the harmful effects of aromatics, many methods for the elimination of aromatic emissions have been established.3–6 However, most of these methods are not suitable, especially in the case of gasoline, wherein the removal of these compounds causes a sharp drop in its octane number. Since the octane number of a fuel is a measure of its improved combustion, there is still a need to consider a suitable method.3–6 One solution to tackle this problem is to replace these compounds with other friendly high-octane components, which would result in considerable energy saving. The isomerization process of straight-chain hydrocarbons is a proper way to produce high research octane number (RON) materials.2 These materials are suitable substitutes for aromatics.During isomerization, most of the normal paraffin (nP) hydrocarbons with low octane numbers are converted into isomerates with the same family (iP) having enhanced RON. The isomerization of straight-chain hydrocarbons such as normal heptane and higher n-alkanes has not yet been commercialized because there is still no balance between the major products (isomerized materials) and the by-products (particularly cracked materials).3 A proper catalyst needs to be established to avert n-heptane from getting involved in the cracking process while enhancing the conversion of n-heptane into multi-branched isomers. Literature reviews reveal that various catalysts including SAPO,7 different kinds of zeolites,8,9 heteropolyacids,10 MCMs,11 and SO42−/ZrO2![[thin space (1/6-em)]](https://www.rsc.org/images/entities/char_2009.gif) 12 have been used for this process.
12 have been used for this process.
It is well understood that solid acids are one class of the most promising catalysts for this reaction.13 The addition of transition metal oxides is a modification method for the preparation of acidic catalysts. Selective conversion of n-heptane into desirable products occurs when molecular transmission between the metal and acid sites happens quickly.14 In other words, the effective balance between the metal and acid sites is a crucial factor for the catalyst used in this process. Some of these metals such as tungsten and molybdenum have been evaluated and reported in previous works.13,14 In recent years, new micro/mesoporous composite materials that are suitable candidates for use as isomerization process catalysts have gained researcher's interest.5 Both micro- and mesoporous properties of these materials endow them with excellent activity and selectivity performances for use in selective n-heptane isomerization reactions. A new generation of micro-/mesoporous catalysts by employing HMS (Hexagonal Mesoporous Silica) and HZSM-5 (protonated Zeolite Socony Mobil-5) precursors has been introduced by researchers.15–17 These composite catalysts that have a hierarchical pore structure exhibited admirable activities for n-heptane isomerization since they benefit from an adjustable hole of mesoporous silicate and the robust acidity of microporous zeolites. In order to enhance the acidic properties of the aforementioned materials for attaining the best performances in the isomerization reaction, the modification treatment with several metals such as Ti,18,19 Co,20 V,21 Mn,22 Fe,23 Zr,24 and Al25 has been investigated previously. Great ion-exchange capacity and also proper redox activities make zirconia a suitable catalyst, support, or promoter in catalytic processes.
In 2014, Peyrovi et al. have synthesized collections of Pt supported on HMS plus Zr-HMS with different molar ratios of Si/Zr and used for n-heptane isomerization.16 Their results reveal that increasing the zirconium content in the Pt-HMS structure results in an increase in the catalytic activity and selectivity. Moreover, Zr(x)-HMS-containing catalysts can be considered as efficient catalysts for producing high octane number gasoline. In this regard, further investigations have been accomplished by Parsafard et al. in recent years.13,15,16,26
In continuation of these works and to investigate the catalytic performance in a group of the periodic table, platinated Cr/Zr-mixed oxides on HMS were prepared and evaluated. Herein, the effects of the Cr/Zr ratio on the Pt/HMS catalysts for isomerization reactions are reported. These catalysts were studied for the physicochemical properties, catalytic activity, selectivity and stability for the n-heptane isomerization reaction.
Generally, catalyst preparation is a tedious and intricate process including many stages, variables and complicated interactions, which turns the experimental investigations pretty costly and time-consuming. All the preceding research studies on the application of composite catalysts in the isomerization process have revealed that most of these experimental procedures simultaneously involve several factors. It is obvious that this experimental process is often tiresome, prolonged, expensive and most importantly does not regard the interaction of numerous treatment parameters, hence reduced accuracy is not unexpected. In order to increase the efficiency of n-heptane isomerization, the process should be accomplished under optimal reaction conditions. In other words, implementing reactions under non-optimized conditions might utilize more resources with lesser output. An inclusive modelling technique that can be implemented easily with satisfactory efficiency can help finding optimal conditions and parameter interaction.
Data-driven models including response surface methodologies (RSMs) and artificial neural networks (ANNs) have drawn much attention in the catalytic systems.27 These methods have been identified to perform remarkably well in elucidating the underlying mechanism of the input parameters without prior information on the nature of the problem.28 In 2016, Elfghi has examined the evaluation capabilities of RSM and ANN to determine the research octane number (RON) of reformate yielded from the naphtha catalytic unit.29 The results indicated that although ANN requires a large quantity of training data, it shows superior performance for both data fitting and estimation capabilities compared to RSM and might be a very dominant and flexible tool for modelling and optimization purposes. In another study, Avramovic et al. have used RSM and ANN for modelling the content of fatty acid ethyl esters of sunflower oil in the heterogeneously catalysed alcoholysis process.30 They have reported that both models are efficient in terms of envisaging the ester content; however, the ANN model was found to be more accurate than the RSM model. Moreover, similar results obtained by Mousavi et al. indicated that the ANN has slightly better performances than the RSM in terms of capturing the nonlinear behaviour of the system and being accurate in estimating the values of NO conversion on Mn/active carbon nanocatalysts.31 Hafizi et al. compared these two methodologies for linear alkyl benzene synthesis over a H14[NaP5W30O110]/SiO2 catalyst. The results indicated that although neural networks presented better efficiency and accuracy than the RSM with a limited number of experiments, both the techniques have proven to be powerful tools for the modelling and optimization of multifaceted processes such as catalytic reactions.32 Although the results of the above-mentioned articles indicated that the performance of the neural network is slightly better than that of the RSM, adjusting the available parameters can help to improve the obtained results. Statistical assessment accomplished by Mirzaei et al. revealed that tuning the parameters of the RSM and ANN enables us to effectively predict methane adsorption capacity on the carbon active samples.33
In the present study, collections of the Pt–Cr/Zr(x)-HMS catalysts with various Cr/Zr molar ratios were synthesized and utilized as solid acid catalysts for the catalytic isomerization of n-heptanes. In order to examine the catalyst performances, parameters such as activity and various forms of the selectivity including MOB (mono-branched) heptane, MUB (multi-branched) heptane, i-C7 (MOB + MUB), cracking (crack.), hydrogenolysis (hydro.) and RON (research octane number) at an extended range of feed temperature (200–350 °C) and exposed time (1–72 h) have been tested. Moreover, an in-house regularization network (RN) and a response surface methodology will be recruited to explore the relationship between the catalyst performance and catalyst preparation parameters including catalyst molar ratio (M), temperature (T) and time (t), which were selected as influential factors on the catalyst efficiency in isomerization reactions.
Four different points of views are emphasized in this article: (a) introducing the novel structure of Pt–Cr/Zr(x)-HMS catalysts with various chromium-to-zirconium (Cr/Zr) molar ratios for n-heptane isomerization which has not been reported in the previous literature, (b) outstanding performance of optimized RN and RSM in finding the relationship between activity and selectivity of the prepared catalysts versus influential preparation parameters, (c) proposing an in-house RN equipped with appropriate regularization levels and a tuned RSM as reliable and powerful tools for modelling n-heptane catalytic reforming processes and (d) improved energy efficiency and reduced aromatics can be achieved by producing fuel with a high octane number.
This comprehensive approach can suggest a substantial improvement in catalytic isomerization processes.
Experimental section
Materials
All the chemicals, namely, ethanol (≥99.5%, Merck), tetraethyl orthosilicate (TEOS, ≥99%, Merck), dodecyl amine (≥97%, Merck), hydrochloric acid (≥37%, Merck), zirconyl(IV) nitrate hydrate (≥99.9%, Sigma-Aldrich), ammonium dichromate (≥99.5%, Sigma-Aldrich), and hexachloroplatinic acid (≥37.5% (Pt), Sigma-Aldrich) were purchased and used without further purification.Catalyst preparation
Pt-supported composite catalysts were prepared by an impregnation method. According to our reported works,13,14 after preparing Zr-HMS using a sol–gel method, 12 wt% chromium using ammonium dichromate ((NH4)2Cr2O7) as a chromium source was introduced into the structure of Zr-HMS. The obtained solid was dried in an oven at 110 °C overnight and calcined at 600 °C for 6 h. The powder (CrOx/ZrO2)-HMS materials were prepared with different Cr/Zr ratios, namely 5, 10, 20, and 35. In this synthesis method, the weight percentage of chromium is kept constant, while the amount of zirconium is changed. Finally, the produced supports were impregnated with a certain concentration of hexachloroplatinic acid solution (0.6 wt% Pt). The Pt/(CrOx/ZrO2)-HMS catalysts were dried and then calcined at 300 °C for 4 h. In this work, Pt–Cr/Zr(x)-HMS catalysts were labelled PCZH(x), where x represents the nominal Cr/Zr molar ratios that are equal to 5, 10, 20, and 35.Characterization
In order to confirm crystallinity and phases of the calcined catalysts, an X-PERT X-ray diffractometer (XRD) equipped with a CuKα anti-cathode (40 kV and 50 mA) was used with 2θ between 0° and 80° and a 0.06° step with an integration time of 1 s. Additionally, to measure chromium-to-zirconium ratios and other chemical compositions, an XRF-8410 Rh apparatus (X-ray Florescence) operating at a voltage of 60 kV was used. To identify functional groups, a BOMEM FTIR (Fourier Transform Infrared) spectrometer was employed in the wavenumber range of 400–4000 cm−1. To indicate the metal oxidation states, UV/vis diffuse reflectance spectroscopy (DRS) spectra were recorded using a Shimadzu UV-2100 at 200–800 nm. The acidity was measured by ammonia thermo-desorption (NH3-TPD) using a Micromeritics TPD/TPR 2900 apparatus. The desorption profiles were recorded at a rate of 10 °C min−1 up to 800 °C. The H2 chemisorption was used to evaluate the metal dispersion percentage over the surfaces of the catalysts. For this aim, a TPD/TPR analyser (2900 Micromeritics) equipped with a TCD detector was applied for measuring the Pt dispersion (Ptd). Moreover, to determine the specific surface areas of the prepared catalysts, a BET instrument (ASAP-2010 micromeritics) was employed via analysis of N2 physisorption. The pore volume (Vp) and pore diameter (dp) were calculated by the Barrett–Joyner–Halenda (BJH) technique. The total pore volume was estimated from the N2 uptake value at P/P0 = 0.99. Furthermore, thermogravimetric and differential thermal analysis (TG/DTA) with an STA503 M medium was used for the analysis of deposited coke over the surface of catalysts.Procedures of catalytic tests
A fixed-bed micro reactor was used for catalytic isomerization experiments over n-heptane feed. In each run, 1 g of the catalyst was placed inside the reactor. Before the reaction, the catalyst was reduced by a flow of hydrogen at 400 °C for 2 h. The reaction conditions are as follows: temperature range of 200–350 °C for activity tests and 300 °C for stability tests, atmospheric pressure, reaction time of 1 h for activity test and of 72 h for stability test, optimized hydrogen flow at a rate of 40 mL min−1, and optimized n-heptane flow at a rate of 2 mL h−1. The reaction products were analysed online with a gas chromatograph (Agilent Technologies 7890A) equipped with a flame ionization detector (FID).Design of experiment and statistical analysis
Design of experiment (DOE) as a powerful tool was recruited for finding the optimized condition for the catalyst performance in the n-heptane isomerization over Pt–Cr/Zr(x)-HMS. Various categorized techniques involve the Plackett–Burman design, Box–Behnken design and central composite design (CCD) for the optimization of process parameters in the DOE.34The RSM combined with central composite design (CCD) as a suitable experimental design scheme can be employed for developing the proper polynomial modelling and determining the various parameter efficiency and optimal circumstances. In order to assist the PCZH(x) catalyst for n-heptane isomerization, two distinct sets of data with 16 different preparation experiments (totally 32) were suggested using Design-Expert Software V.11, as shown in Tables 1 and 2. Three distinguished parameters, namely, (1) the chromium-to-zirconium (Cr/Zr) molar ratio of PCZH(x) catalyst samples, (2) feed temperature, and (3) time on stream (TOS) are varied in a particular range of values in which the minimum, central and maximum amounts with respect to their values in the actual and coded form are given in Tables 1 and 2. The selection of these parameters with their specific experimental ranges was meticulously based on the preliminary screening test and frequently used in the literature.13–17,25,26 The CCD routine is employed to determine the least experiments supposed to be accomplished for optimizing the input variables and output responses. By using the Design Expert software, it is anticipated to (a) develop the experimental design, (b) obtain the best-fitted mathematical model, (c) assess the succeeding regression analysis and (d) optimize the process and analysis of variance (ANOVA). As displayed in Table 1, in the first set of experiments, two independent factors of feed temperature (X1) and catalyst molar ratio (X2) were utilized in the RSM with the CCD technique and three levels of ±1 (factorial points) plus the center point. In the same way, input variables in the second set of experiments are the time on stream (X1) and the catalyst molar ratio (X2) (see Table 2).
| Parameters | Levels | ||
|---|---|---|---|
| Low (−1) | Center (0) | High (+1) | |
| a All the S. denotes for selectivity. | |||
| X1: temperature (°C) | 200 | 275 | 350 |
| X2: molar ratio of catalyst | 5 | 20 | 35 |
| RUN | Parameters | Observed responses | |||||||
|---|---|---|---|---|---|---|---|---|---|
| X1 | X2 | Conversion (%) | MOB S.a (%) | MUB S. (%) | i-C7 S. (%) | Crack S. (%) | Hydro S. (%) | RON (%) | |
| 1 | 250 | 20 | 54.3 | 23.6 | 22.9 | 46.5 | 53.5 | 0.0 | 40.6 |
| 2 | 275 | 20 | 55.3 | 22.0 | 21.1 | 43.1 | 56.9 | 0.0 | 45.2 |
| 3 | 350 | 20 | 55.5 | 20.9 | 19.2 | 40.1 | 53.3 | 6.6 | 48.3 |
| 4 | 200 | 35 | 52.8 | 24.9 | 24.5 | 49.4 | 50.4 | 0.2 | 40.3 |
| 5 | 350 | 5 | 55.7 | 15.0 | 14.1 | 29.1 | 65.0 | 5.8 | 41.7 |
| 6 | 250 | 35 | 54.2 | 22.6 | 21.1 | 43.7 | 56.1 | 0.2 | 41.7 |
| 7 | 300 | 35 | 58.4 | 20.3 | 20.1 | 40.4 | 58.4 | 1.2 | 43.4 |
| 8 | 200 | 10 | 48.4 | 19.0 | 16.6 | 35.6 | 63.9 | 0.5 | 28.5 |
| 9 | 300 | 10 | 51.8 | 16.6 | 14.4 | 31.0 | 68.0 | 0.9 | 32.8 |
| 10 | 350 | 35 | 62.9 | 19.0 | 17.9 | 36.9 | 58.7 | 4.4 | 47.3 |
| 11 | 275 | 5 | 54.7 | 17.7 | 18.4 | 36.1 | 62.9 | 0.9 | 39.5 |
| 12 | 350 | 10 | 51.9 | 15.8 | 12.8 | 28.6 | 66.1 | 5.1 | 34.1 |
| 13 | 200 | 5 | 53.8 | 19.8 | 20.0 | 39.8 | 59.7 | 0.5 | 39.0 |
| 14 | 275 | 5 | 55.0 | 15.7 | 17.1 | 32.8 | 65.4 | 1.7 | 41.4 |
| 15 | 250 | 10 | 51.6 | 17.9 | 14.9 | 32.8 | 66.6 | 0.6 | 32.2 |
| 16 | 200 | 20 | 53.1 | 29.4 | 28.7 | 58.1 | 41.9 | 0.0 | 38.7 |
| Parameters | Levels | ||
|---|---|---|---|
| Low (−1) | Center (0) | High (+1) | |
| a S. denotes for selectivity. | |||
| X1: time (h) | 1 | 36 | 72 |
| X2: molar ratio of catalyst | 5 | 20 | 35 |
| RUN | Parameters | Observed responses | ||||||
|---|---|---|---|---|---|---|---|---|
| X1 | X2 | Conversion (%) | MOB S.a (%) | MUB S. (%) | i-C7 S. (%) | Crack S. (%) | Hydro S. (%) | |
| 1 | 72 | 35 | 57.4 | 19.8 | 19.8 | 39.6 | 59.0 | 1.4 |
| 2 | 36 | 20 | 52.1 | 21.8 | 20.4 | 42.2 | 57.7 | 1.2 |
| 3 | 1 | 5 | 55.0 | 15.7 | 17.1 | 32.8 | 65.4 | 1.7 |
| 4 | 42 | 20 | 52.0 | 21.8 | 20.4 | 42.2 | 57.8 | 1.2 |
| 5 | 30 | 20 | 52.2 | 21.9 | 20.4 | 42.3 | 57.7 | 1.1 |
| 6 | 1 | 35 | 58.4 | 20.3 | 20.1 | 40.4 | 58.4 | 1.2 |
| 7 | 72 | 5 | 51.2 | 15.1 | 16.8 | 31.9 | 66.5 | 2.5 |
| 8 | 1 | 20 | 55.3 | 22.0 | 21.1 | 43.1 | 56.9 | 0.0 |
| 9 | 36 | 35 | 57.8 | 20.0 | 20.0 | 40.0 | 58.6 | 1.4 |
| 10 | 30 | 10 | 50.3 | 16.4 | 14.3 | 30.7 | 68.7 | 1.6 |
| 11 | 72 | 20 | 51.7 | 21.7 | 20.3 | 42.0 | 57.9 | 1.6 |
| 12 | 6 | 20 | 52.6 | 22.0 | 20.4 | 42.5 | 57.6 | 0.8 |
| 13 | 36 | 5 | 51.6 | 15.3 | 16.9 | 32.2 | 66.1 | 2.1 |
| 14 | 36 | 10 | 50.3 | 16.4 | 14.3 | 30.7 | 68.7 | 1.6 |
| 15 | 4 | 10 | 50.5 | 16.6 | 14.4 | 31.0 | 68.1 | 1.1 |
| 16 | 60 | 10 | 50.1 | 16.3 | 14.2 | 30.5 | 68.9 | 1.8 |
All the related responses including activity and different forms of selectivity were experimentally achieved based on 16 designated runs, as shown in Tables 1 and 2. Presenting the ANOVA table could help to obtain a proper model and asses the significance of the regression model, investigating the individual model coefficients and lack-of-fit. The cubic polynomial response shown in eqn (1) was applied for finding the correlation between independent and dependent variables:
| Y = a + bX1 + cX2 + dX1X2 + eX21 + fX22 + gX21X2 + hX1X22 + iX31 + jX32 | (1) |
In the above equation, Y is conversion and selectivity as an estimated response, X with indices 1 and 2 is an independent variable (including catalyst molar ratio, temperature and time), a is the intercept term and factors (b–j) are linear, quadratic and cubic interaction coefficients of variables. All the experiments were performed randomly since the level of errors and influences of the uncontrolled variance in the observed responses reached its minimum values. The flowchart of RSM is presented in Fig. 1.
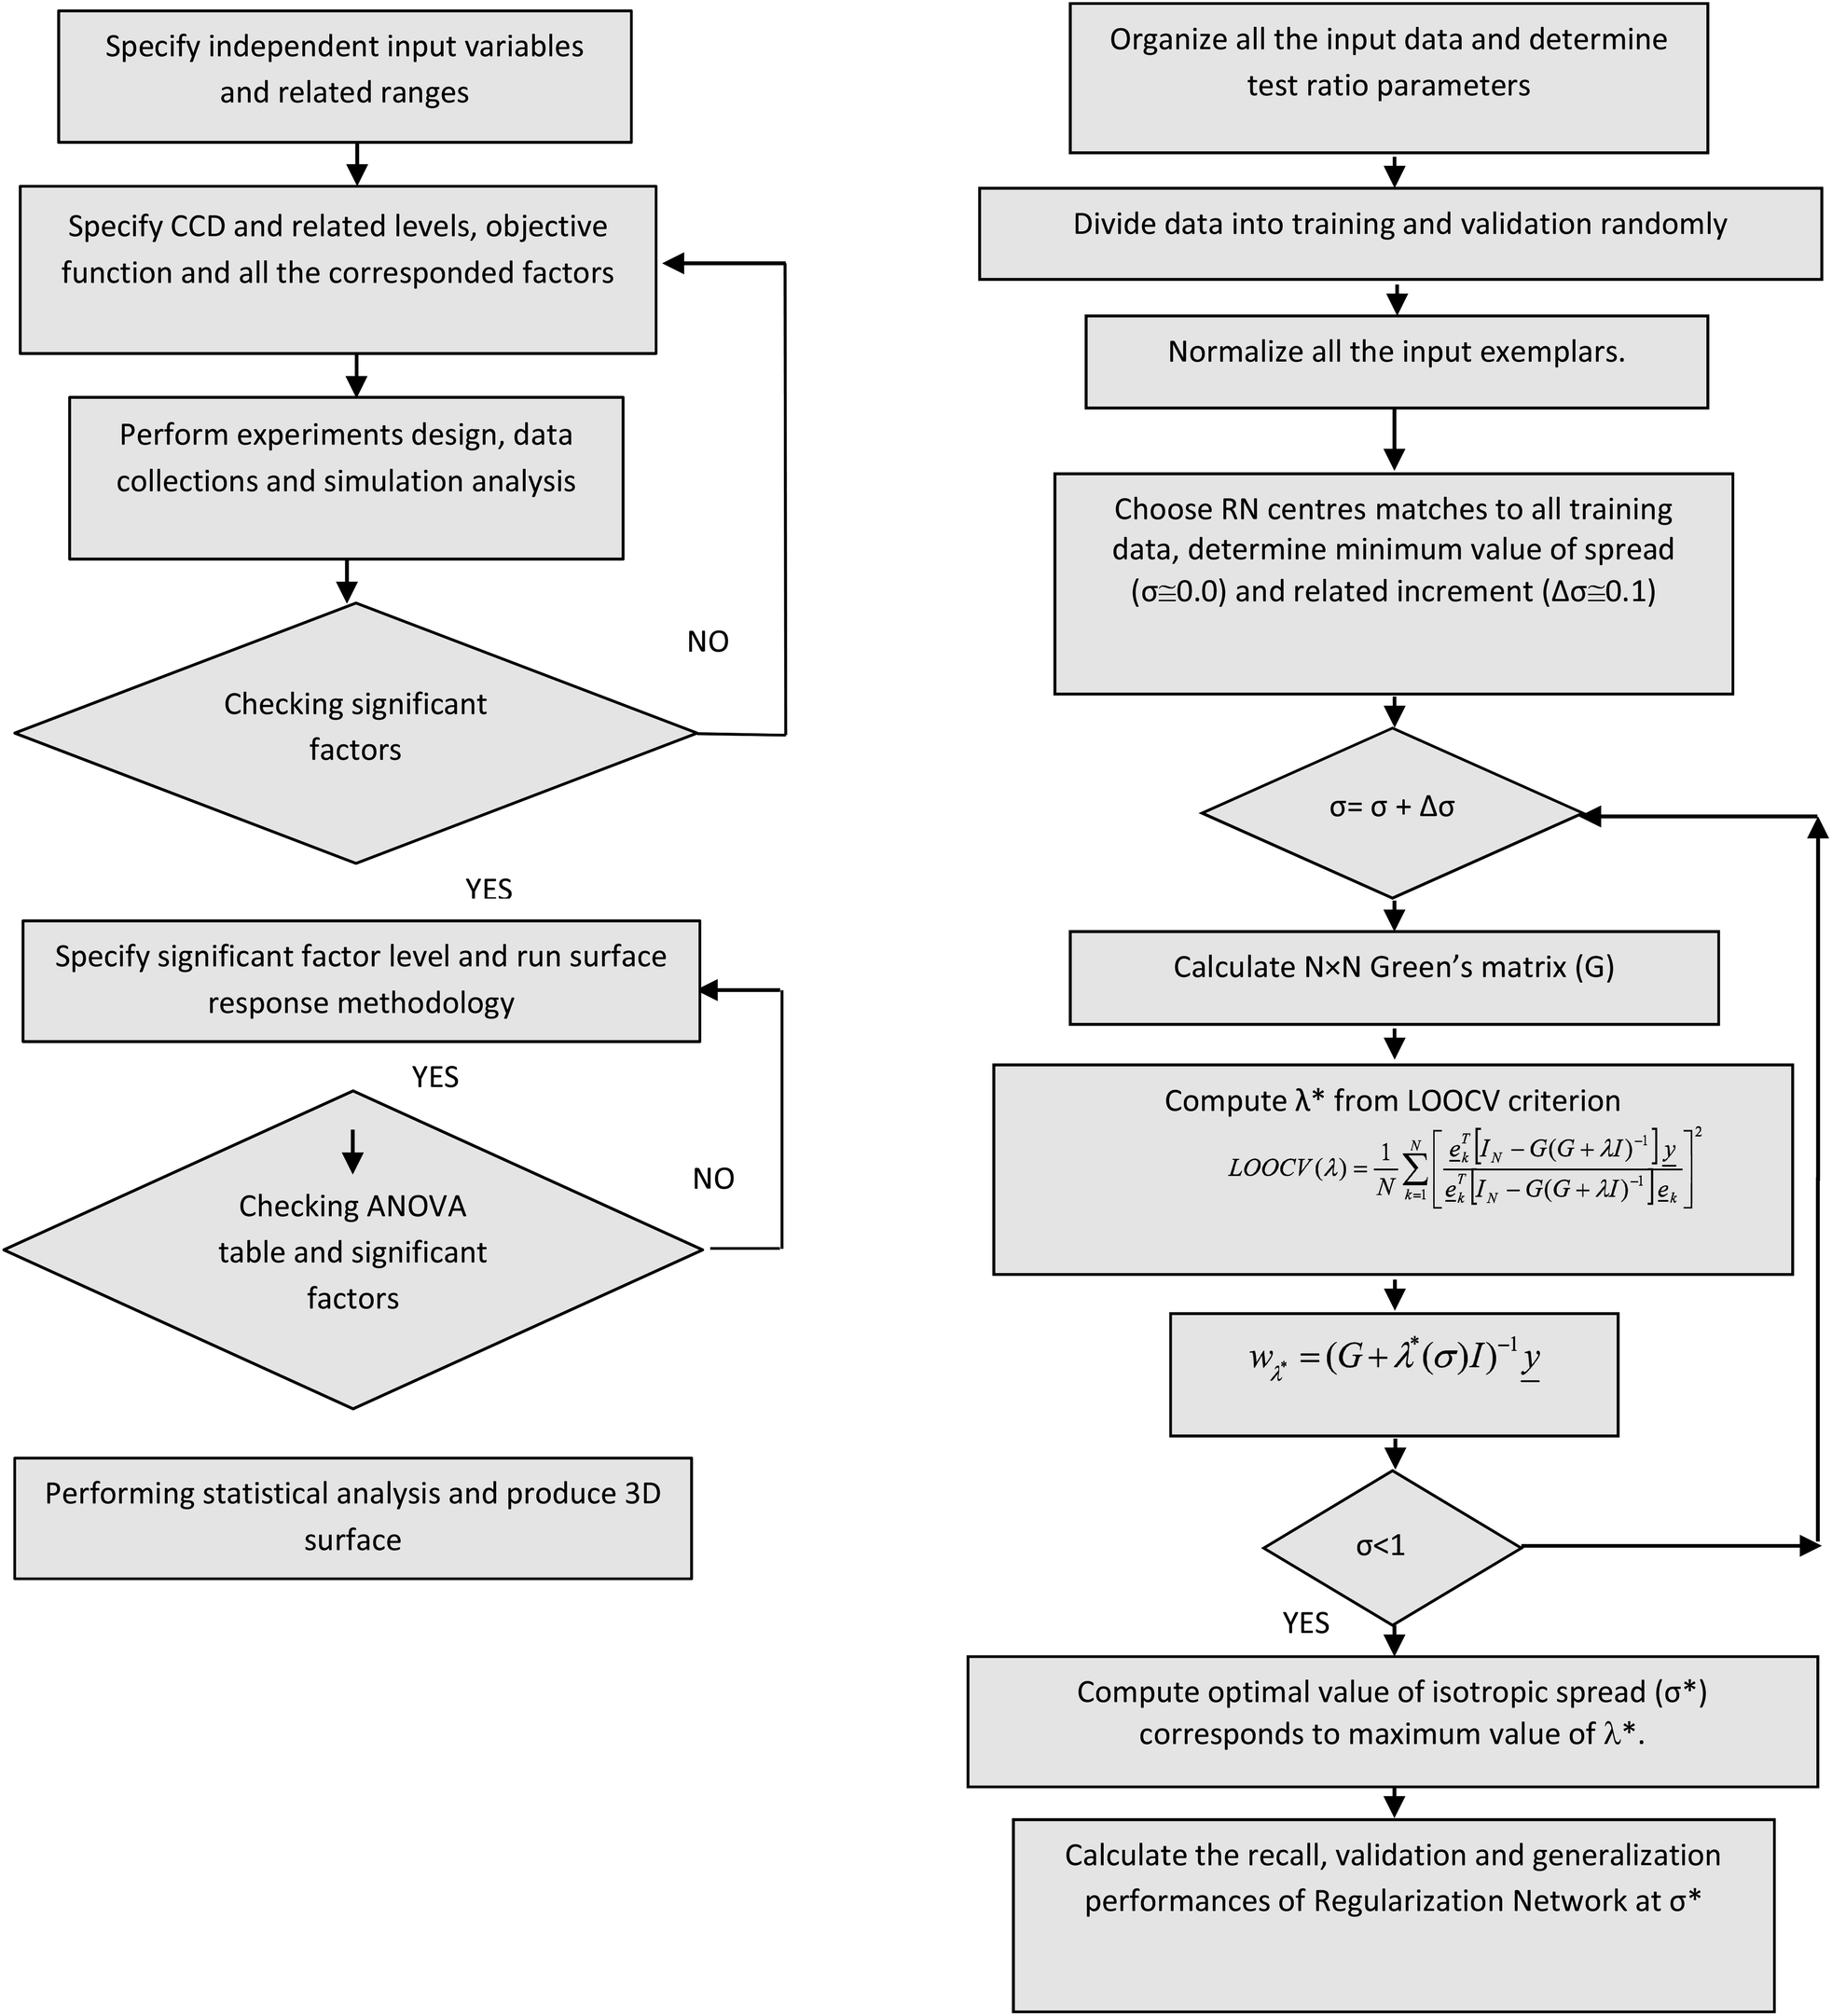 | ||
| Fig. 1 Flow chart of the surface response methodology (right) and the in-house optimal regularization network (left). | ||
Artificial neural networks
The ANN as an influential and computational method can execute nonlinear mapping and solve various intricate systems with efficient training algorithm even with a lack of necessity for details. Achieving good performance of ANN depends on providing adequate data during the training process. If enough training data are not available, then the predefined ANN undergoes overfitting and under fitting problems.35 In the overfitting problem, the validation error elevated while the training error is reduced since the model learns the expected output for every input data instead of learning the real data distribution. On the contrary, under fitting happens when a model cannot learn enough because of insufficient training data. In order to fix these problems, multiple regularization techniques have been suggested and widely used in the data analysis.36 Therefore, regularization is a common method in which additional information is introduced to cost function in order to solve an ill-posed problem, decrease overfitting and subsequently improve the model's performance. Generally, this information is added to the cost function in the form of a penalty term, such as restrictions for smoothness or bounds on the vector space norm.37 Studies of Girosi revealed that regularization principles lead to approximation schemes which are equivalent to networks with a single hidden layer that are called regularization networks.38 The learning algorithm executes a set of approximating functions f(x,ω), where ω is a set of parameters of an arbitrary nature. Considering a noisy function y(x), aiming to obtain f(x,ω), which minimizes the below merit function:39|
R(ω,λ) = ‖y(x) − f(x,ω)‖2 + λΩ[f(x,ω)]
| (2) |
In the above equation, the Ω[f(x,ω)] is a non-negative penalty expression that penalizes the non-smooth function f(x,ω)and λ is the regularization parameter.
Investigation of Poggio and Girosi revealed that the ultimate solution of multivariate regularization which minimizes the merit function R(ω,λ) is shown in the eqn (3):40
(G + λIN)![[w with combining low line]](https://www.rsc.org/images/entities/i_char_0077_0332.gif) λ = λ = ![[y with combining low line]](https://www.rsc.org/images/entities/i_char_0079_0332.gif)
| (3) |
In eqn (3), G denotes the N × N symmetric Green's matrix which is Gaussian function with an infinite number of continuous derivatives and specific isotropic spread (σ). Also, λ is the regularization parameter, IN is the N × N identity matrix, λ which is the N × 1 linear synaptic weight vector and is the real response values corresponding to the input vector ![[x with combining low line]](https://www.rsc.org/images/entities/i_char_0078_0332.gif) i = 1, 2, …, N. The important point in the RN is that the neurons (or centres) should be located exactly at the locus of training exemplars. Scrutinizing for obtaining the best amount of regularization parameter and isotropic spread has a profound effect on the performances of RN. Although there are few practical approaches for finding the best amount of λ, however, eminent leave one out cross-validation technique (LOOCV) is employed for optimal selection of this parameter. The flow chart of RN is described in Fig. 1.
i = 1, 2, …, N. The important point in the RN is that the neurons (or centres) should be located exactly at the locus of training exemplars. Scrutinizing for obtaining the best amount of regularization parameter and isotropic spread has a profound effect on the performances of RN. Although there are few practical approaches for finding the best amount of λ, however, eminent leave one out cross-validation technique (LOOCV) is employed for optimal selection of this parameter. The flow chart of RN is described in Fig. 1.
Results and discussions
Pt/(CrOx/ZrO2)-HMS catalysts characterization
The XRD patterns for Pt/(CrOx/ZrO2)-HMS synthesized by the impregnation method are shown in Fig. 2. | ||
| Fig. 2 XRD patterns of Pt/(CrOx/ZrO2)-HMS synthesized catalysts. | ||
The XRD spectra of the components of these composite catalysts (Zr(x)-HMS) have been reported in previous work,14 which is a reference pattern to the catalysts prepared in the present work. A comparison of obtained XRD patterns with reference patterns reveals that no peak is clearly observed for zirconia, platinum and chromium oxide structures, probably because of their good dispersion or small amounts. However, the typical peaks of the HMS are seen at ∼2.3° (d100) and its amorphous portion at 20°–30°. Comparing the patterns together, it is observed that with the increase in zirconium content, the peak of the amorphous portion of HMS is broadened and its d100 peak intensity is decreased.13
The UV-vis diffuse reflectance spectra of the calcined (CrOx/ZrO2)-HMS catalysts before and after Pt impregnation are shown in Fig. 3. These spectra have two distinct peaks around 280 and 380 nm, a shoulder around 460 nm and a weak and broad band around 700 nm. The bands related to the charge transfer of O2−–Cr6+ in the tetrahedrally coordinated arrangement are observed at 280 and 380 nm. Polychromate structure of Cr6+ and octahedral arrangement of Cr3+ are revealed as a shoulder around 460 nm and a peak around 700 nm, respectively.41 Furthermore, the absorption bands at around 200 nm and 240 nm are assigned to the charge transfer of oxygen ions to Zr(IV) ions in the tetrahedral structure and monoclinic ZrO2 phase, respectively.13,14 All the above-mentioned bands are found in the platinum catalysts. The only difference between these spectra is the decrease in the band intensity after platinum impregnation.
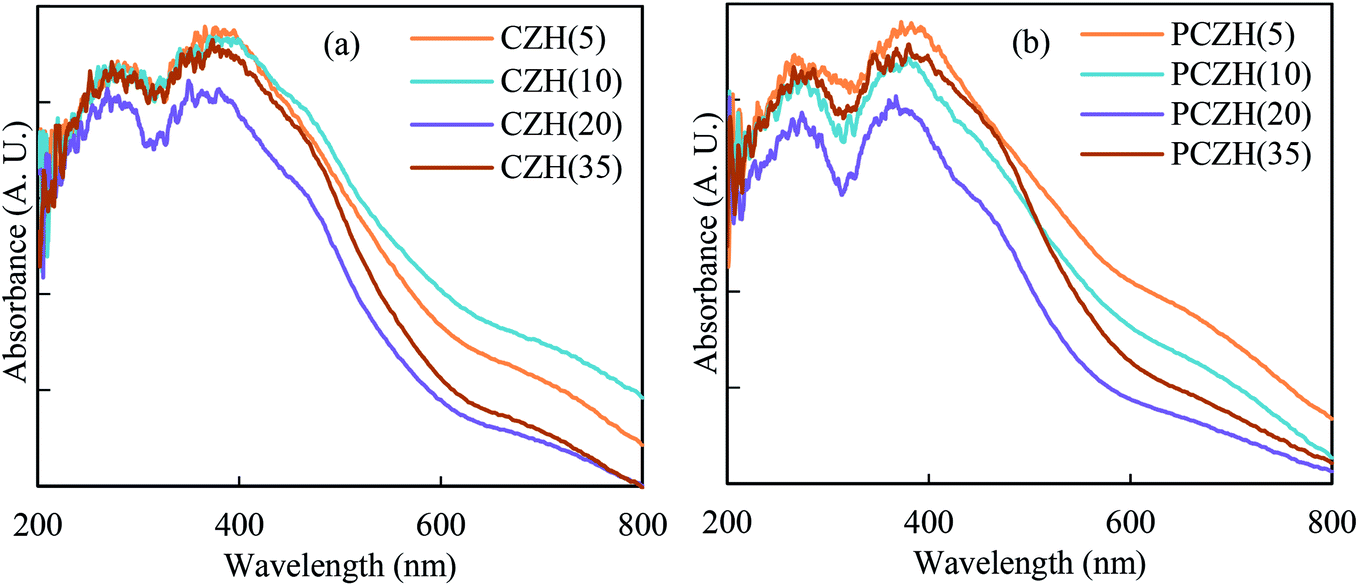 | ||
| Fig. 3 UV-vis DRS for CZH(x) (a) before and (b) after platinum impregnation. | ||
Fig. 4 shows the FT-IR spectra of platinated (CrOx/ZrO2)-HMS catalysts. The spectra of these catalysts give bands centred at 451, 794, 952 and 1076 cm−1, which are indications of infrared bands of HMS. These peaks were assigned to the Si–O–Si bending vibration, the symmetry stretching vibration of Si–O–Si, the bending vibration of the defective Si–OH groups and the asymmetric stretching vibration of Si–O–Si, respectively. The reported works show peaks in this range for chromium oxide that appear to overlap with the HMS peaks in the present spectra, which led the spectra to shift to higher wavenumbers. Therefore, it is difficult to identify them. In addition, the existence of no peak indicates good zirconium dispersion in the prepared catalyst.13,14,42
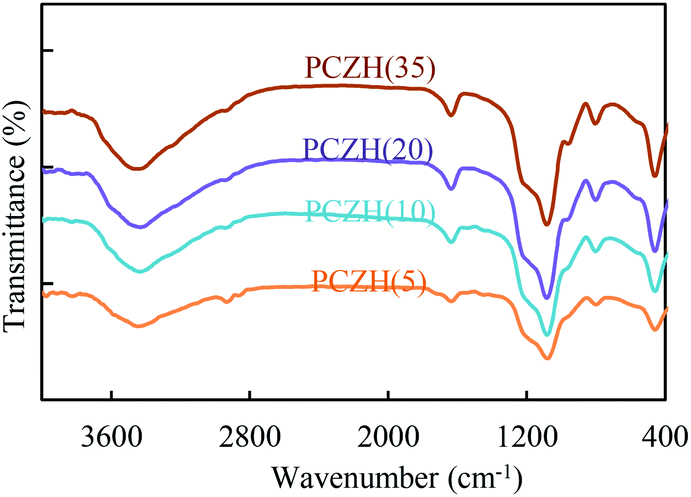 | ||
| Fig. 4 FT-IR spectra of various synthesized catalysts. | ||
Other peaks in the spectra correspond to the peaks known in the prior works,13,14 such as the FT-IR peak at near 3500 cm−1 attributed to the stretching vibrations of terminal Si–OH and adsorbed water molecules. In addition, very small peaks with a very low intensity at 2850 cm−1 are observed due to the vibration of the C–H stretching mode, which is probably due to the fact that calcination was not performed completely on the catalysts and the surfactant used during calcination is not excluded.
The surface properties of the catalysts were confirmed by N2 adsorption/desorption isotherms (Table 3). All these isotherms were of type IV, which corresponds to the mesoporous structure of these catalysts according to the IUPAC classification. Hysteresis loops (H1) of these isotherms showed the uniform, cylindrical and no interconnectivity for pore structures. The surface area increases with the increase in the Cr/Zr molar ratio. Similar trends were also observed for the mesopore volume. However, the mesopore diameter decreases.
| Catalysts | PCZH(5) | PCZH(10) | PCZH(20) | PCZH(35) |
|---|---|---|---|---|
| a BET surface area by the Brunauer–Emmett–Teller method.b Average mesopore volume (Vp) by the t-plot.c Average pore diameter.d By the XRF method.e By the NH3-TPD method.f By the H2-chemisorption method. | ||||
| SBETa (m2 g−1) | 695.0 | 705.3 | 725.9 | 756.9 |
| Vpb (cm3 g−1) | 1.5 | 1.7 | 2.2 | 2.9 |
| dpc (nm) | 8.2 | 6.9 | 6.2 | 5.7 |
| Cr/Zrd | 4.7 | 9.3 | 18.9 | 34.4 |
| Si/Crd | 1.2 | 3.5 | 14.3 | 43.8 |
| Si/Zrd | 5.4 | 32.1 | 270.2 | 1505.7 |
| Aciditye (mmol NH3 per g) | 0.403 | 0.399 | 0.391 | 0.359 |
| Ptdf | 65 | 59 | 80 | 71 |
Empirical methods for collected experimental data
As mentioned before, the RSM and in-house optimized RN were employed to predict the catalytic performances of PCZH for isomerization of n-heptanes. All the 32 distinct experiments are displayed in Tables 1 and 2.In the RSM method, the actual responses attained from the DOE were used to build proper mathematical correlations between the input variables and new predicted values. The central composite design was applied for entire sets of experiments and the ANOVA table will be presented for checking the adequacy of the model.
The collected experimental data were used to train the RN. Our in-house procedure is used to optimally train the regularization network and then employ it to provide predictions about the dependency of PCZH performances versus input parameters. The training of the network between the inputs (catalyst molar ratio, temperature and time) and the hidden layer happens in an unsupervised algorithm, while the training between the hidden and output layers (PCZH performances) occurs in a supervised fashion based on the target outputs. The trained networks were employed to give adequate predictions for unseen (test or validation) data, dissimilar from the training data. Such a network can be used for computing outputs for some exemplars outside the training set but inside the training domain (generalization).39
Fig. 5 depicts the typical optimal performances of the in-house RN for both recall and validation purposes using three test (validation) ratios of 0.01, 0.1 and 0.2 (as a 1%, 10% and 20% of total data). These performances are related to the conversion versus temperature (X1) and catalyst molar ratio (X2) (see Table 1). As it was emphasized before, one-to-one correspondence between the training data points and the network centres exist in the optimized RN.
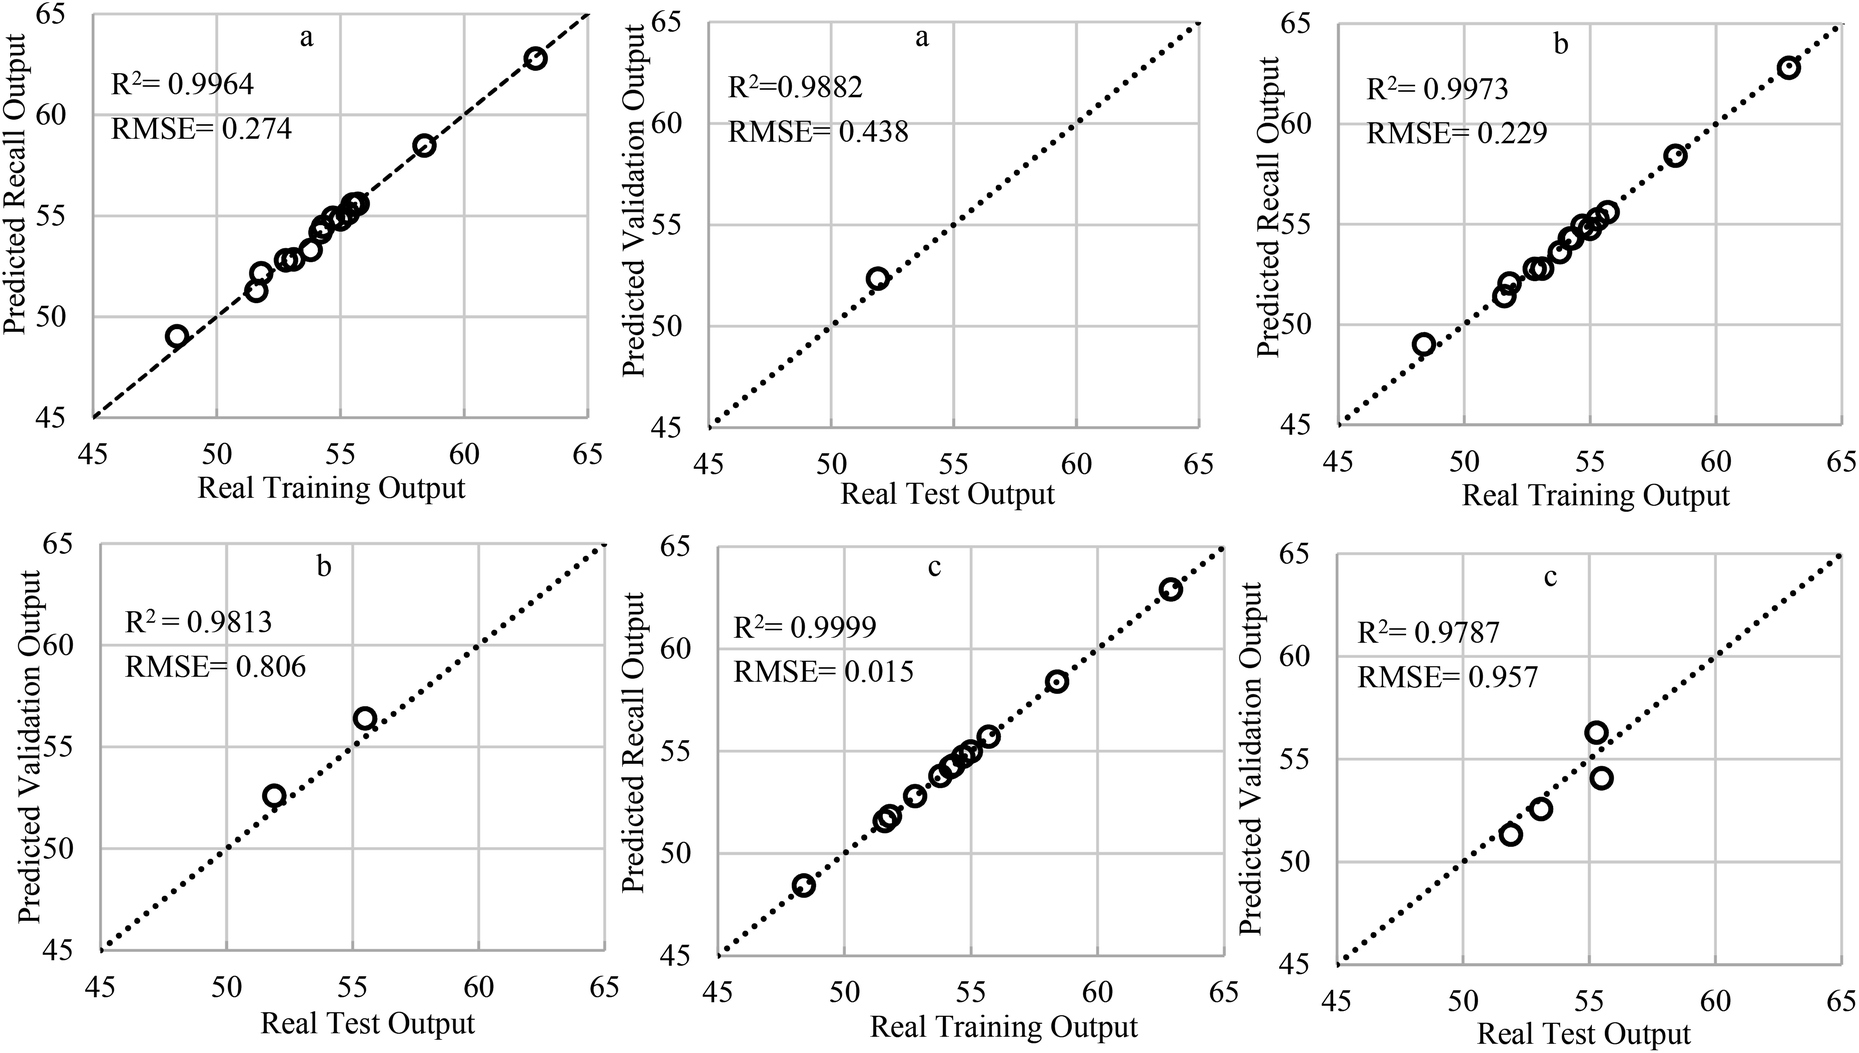 | ||
| Fig. 5 Recall and validation performances of in-house RN for different numbers of training and test exemplars (total number of available data: 16). (a) Test ratio = 0.01 [training data = 15, test data = 1], λ* = 0.00156; σ* = 0.7. (b) Test ratio = 0.1 [training data = 14, test data = 2], λ* = 0.00166; σ*= 0.8. (c) Test ratio = 0.2 [training data = 12, test data = 4], λ* = 0.00012; σ* = 1. | ||
As can be seen, the recall performances of the optimal RN for all test ratios are significant, but relatively fade when the test ratio declined. A close investigation of the correlation coefficient (R2) plus root mean square error (RMSE) can examine this claim. This issue attributed to this fact that employing a greater number of training exemplars avoids excessive over-fitting phenomenon and does not oblige model to pass through each and every data point. In fact, choosing a proper amount of regularization parameters can inhibit the extreme over-fitting and filters out the noise embedded in the training data set. Hence, it is expected that the recall performances slightly deteriorated for noisy data sets (i.e. lower test ratio), because the model attempts to catch the true underlying trend rooted in the noisy data set instead of following the noise. Cross-validation is a model validation technique for evaluating how the results of a statistical analysis will generalize to an independent data set. In the present article, the leave-one-out cross-validation criterion (LOOCV) was employed for choosing the optimal value of the regularization parameter. Further information about this procedure can be found in the literature.28,35,39,43,44 The RN has magnificent performances over unseen data and the optimal value of stabilization prevented the over-fitting phenomena. It should be noted that the stabilization is more necessary for the greater test ratios.
The stabilization technique is not essentially needed in the relatively large population of training data exemplars since it can be assumed that the embedded errors are normally distributed and expectation of any errors will be zero (i.e. errors cancel each other). In such cases, the optimum amount of λ, which will be calculated by the LOOCV criterion is unrealistically extremely small, since this criterion does not kick-in for sufficiently large training data sets. Conversely, when enough samples are not considered, the LOOCV criterion should kick in to filter the noise for confined data sets exemplars.
Fig. 6 displays the typical variation of regularization level (left axis) plus degrees of freedom (right axis) versus the isotropic spread of the Gaussian basis functions. It was expected that the graph of regularization parameter versus isotropic spread presents a clear maximum value which is related to λ* versus σ* (star superscript denotes the optimum value). An approximate degree of freedom (ADF) is defined as a trace of the smoother matrix, which depends on both isotropic spread (σ) and regularization parameter (λ). It has been proved that ADF exhibit the global minimum at the optimum spread.43 Such a minimum is an approximate extent of the ADF, which can be reasonably supported by the noisy data set and can be employed to supply the best value for the isotropic spread (σ*).
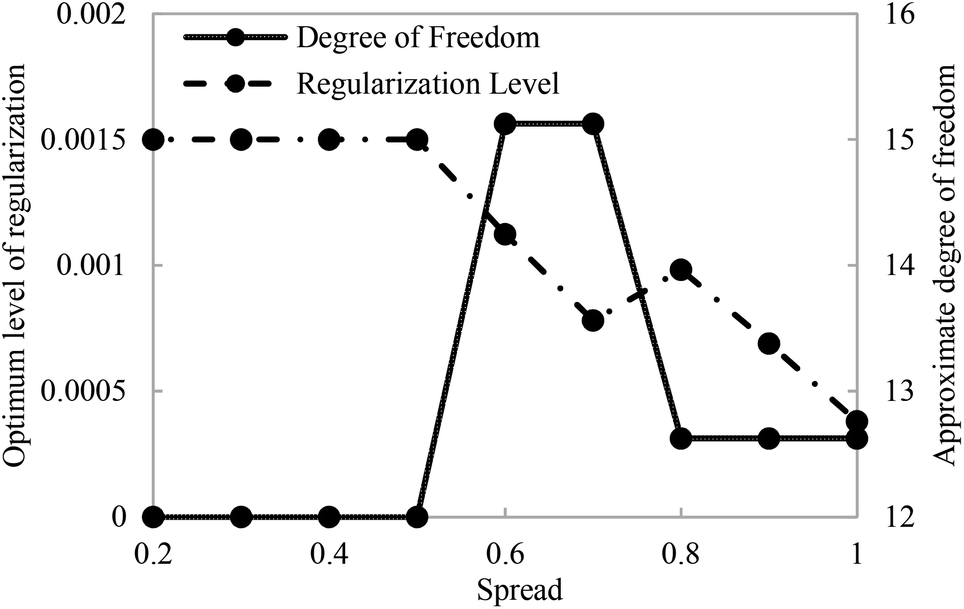 | ||
| Fig. 6 Variations of the degrees of freedom and regularization level with the isotropic spread of the Gaussian basis functions (test ratio = 0.01). | ||
For the ease of comparison, the performance of RSM shown in Fig. 7 is sketched with the same data exemplars used in the optimized RN for constructing Fig. 5. Those who acquainted with the DOE software know that the RSM predicts the PCZH catalyst performances based on rigorous regression models and does not follow such train-and-test procedures. Hence, unlike the RN model, just one plot (predicted versus actual values) is presented for the RSM method. Although the statistical analysis shows that the RN is performed better for the entire test ratios (typically for test ratio 0.1, R2 = 0.9973 and RMSE = 0.229); however, the RSM results are also acceptable (R2 = 0.9574 and RMSE = 0.639).
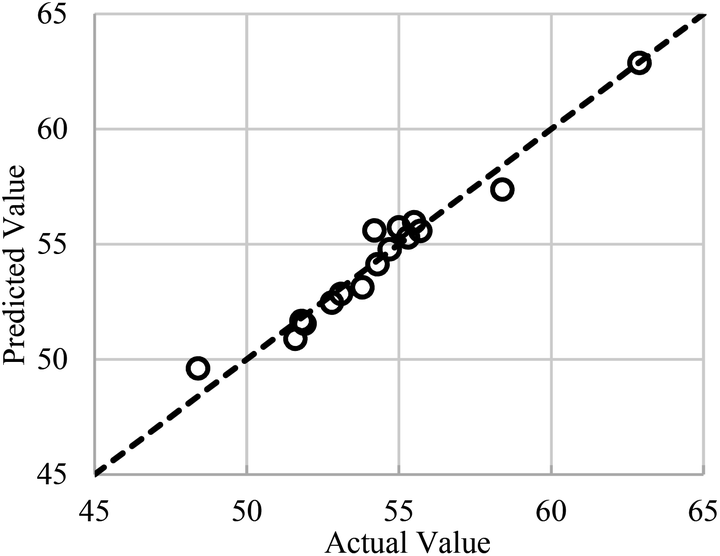 | ||
| Fig. 7 Performances of RSM for conversion versus feed temperature (X1) and catalyst molar ratio (X2). | ||
In the above discussion, it was assured that both optimized RN and RSM can successfully predict the conversion response (as a representative of all other responses).
The final empirical models suggested by the CCD method for both sets of experiments in terms of coded variables are presented in Tables S-1 and S-2 (see ESI).† Positive marks in front of each term represent the synergistic effect and consequence to elevate in the corresponded responses, while negative signs indicate antagonistic effects and decrease the response.33,45 The ANOVA results for fitting the suggested model for entire responses are exhibited in Tables 4 and 5.
| Source | Model | Residual | ||||||||
|---|---|---|---|---|---|---|---|---|---|---|
| Sum of square | dfc | Mean square | F-value | P-value | R2 | Sum of square | df | Mean square | ||
| a All the S. denotes for selectivity.b Significant.c Degree of freedom. | ||||||||||
| Conversion | 147.31 | 9 | 16.37 | 14.99 | 0.0018 | Sig.b | 0.9574 | 6.55 | 6 | 1.09 |
| MOB S.a | 214.58 | 9 | 23.84 | 20.91 | 0.0007 | Sig.b | 0.9691 | 6.84 | 6 | 1.14 |
| MUB S. | 253.82 | 9 | 28.20 | 20.74 | 0.0007 | Sig.b | 0.9689 | 8.16 | 6 | 1.36 |
| i-C7 S. | 913.51 | 9 | 101.50 | 20.40 | 0.0008 | Sig.b | 0.9684 | 29.85 | 6 | 4.97 |
| Crack S. | 714.37 | 9 | 79.37 | 14.27 | 0.0021 | Sig.b | 0.9554 | 33.36 | 6 | 5.56 |
| Hydro S. | 72.01 | 5 | 14.40 | 22.77 | <0.0001 | Sig.b | 0.9193 | 6.32 | 10 | 0.63 |
| RON | 446.01 | 9 | 49.56 | 76.48 | <0.0001 | Sig.b | 0.9784 | 3.89 | 6 | 0.65 |
| Source | Model | Residual | ||||||||
|---|---|---|---|---|---|---|---|---|---|---|
| Sum of square | dfc | Mean square | F-value | P-value | R2 | Sum of square | df | Mean square | ||
| a All the S. denotes for selectivity.b Significant.c Degree of freedom. | ||||||||||
| Conversion | 88.13 | 5 | 17.63 | 14.06 | 0.0016 | Sig.b | 0.9094 | 8.7800 | 7 | 1.2500 |
| MOB S.a | 96.43 | 9 | 10.71 | 9436.89 | <0.0001 | Sig.b | 1.0000 | 0.0034 | 3 | 0.0011 |
| MUB S. | 70.94 | 9 | 7.88 | 138.74 | 0.0009 | Sig.b | 0.9976 | 0.1704 | 3 | 0.0568 |
| i-C7 S. | 274.64 | 9 | 30.52 | 1051.42 | <0.0001 | Sig.b | 0.9997 | 0.0871 | 3 | 0.0290 |
| Crack S. | 263.78 | 9 | 29.31 | 595.29 | 0.0001 | Sig.b | 0.9994 | 0.1477 | 3 | 0.0492 |
| Hydro S. | 3.82 | 5 | 0.7646 | 9.91 | 0.0044 | Sig.b | 0.8762 | 0.5400 | 7 | 0.0771 |
The fitness of various developed models was obtained from the determination of the correlation coefficient (R2). This factor clearly explained the total deviation of the observed value of activity from the mean amount. A practical rule of thumbs for the aforementioned term has suggested a value of 0.75 and a higher extent.46
For the first set of experiments, the minimum and maximum amounts of R2 are 0.9193 and 0.9784 related to hydrogenolysis and RON selectivity, respectively (see Table S-2†). All other R2 are lies between these amounts. Also, the minimum value of 0.8762 and a maximum of 1 belong to hydrogenolysis and MOB selectivity in the second set of experiments (see Table 2). These high amounts of R2 reveal that there is a good agreement between predicted and experimental data which shows RSM has magnificent performances.
The F-value for the model is the test statistic used to determine whether any term in the model is associated with the response, including blocks and factor terms.47 It can be obtained by dividing the model mean square by its residual mean square both of which are reported in Tables 4 and 5. Moreover, the probability that measures the evidence against the null hypothesis is obtained by the p-value of the model. Lower probabilities provide stronger evidence against the null hypothesis.31 A p-value lower than the significance level explains variation in the response while in the higher amount, no clear conclusion can be made for variation in the response and better to find a new model. Usually, a significance level (denoted as α) of 0.05 works well.47 According to Tables 4 and 5, the ANOVA test confirmed the capability of the suggested model by the RSM for all responses including both sets of experiments, since the P-value is higher than Fischer's F-statistics factor and is less than 0.05. A very low probability value for all the models suggested that they were significant throughout the 95% confidence interval. For instance, the F-value for the conversion response in the first and second sets of experiments is 14.99 and 14.06 respectively, regarding a very low corresponding probability value. As emphasized before, the large F-values plus P-values less than 0.05 indicate that the model is significant. In order to consider the significance terms of the suggested model, only the source and the highest F-value of individual model terms corresponding to each response were extracted from the ANOVA table and reported in Table S-3.† These terms will be discussed in the following materials.
To see the overall operation of both methods, generalization performances over the entire input domain will be presented. Fig. 8 maps the entire input domain and also exhibited 16 data points used as training exemplars in the 3D space for feed temperature and catalyst molar ratio in the range of (200–350 °C) and (5–35), respectively versus conversion response. The training data shown in Fig. 8 were employed to create the real underlying surfaces expressing the dependency of conversion to both catalyst molar ratio and feed temperature. The experimental data were measured on Pt-loaded HMS and Cr/Zr (x = 5, 10, 20, and 35)-HMS. Moreover, reactions were carried out in a H2 environment to saturate aromatic products and inhibit coke deposition on the platinated catalysts.
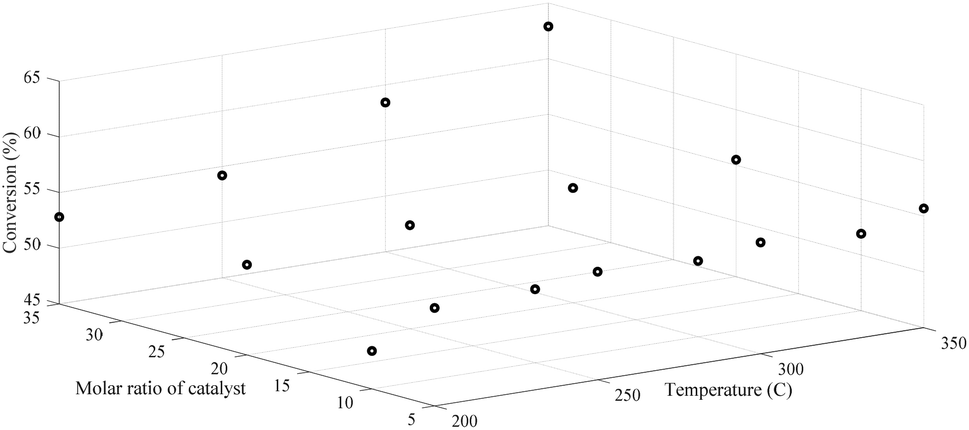 | ||
| Fig. 8 Distribution of conversion versus a molar ratio of catalyst and feed temperature in the 3D space. | ||
Fig. 9 shows the corresponding generalization performances of RN (left) and RSM (right) over 100 × 100 mesh for both sets of experiments (upper: first set, bottom: second set)
 | ||
| Fig. 9 Generalization performances of optimized RN (lefts) plus RSM (rights) for conversion versus catalyst molar ratio, temperature (upper) and time (bottom). | ||
The conversion defined as a fraction of n-C7 transformed into a product. As can be seen clearly, the optimized RN and RSM have similar generalization performances in the first set of experiments (i.e. T and M), but slightly different in the second set of experiments (i.e. t and M) especially in the higher bond of figures. The values of conversion responses (vertical axes) reveal that PCZH(x) is highly active for the conversion of n-C7. In other words, the incorporation of Cr in the Pt–Zr-HMS catalyst structure promotes the catalyst activity. The highest conversion of 63% happens at a maximum temperature of 350 °C and a catalyst molar ratio of Cr/Zr (30). Moreover, the amount of conversion was increased with the increase in temperature in all catalyst molar ratios. For instance, at a constant catalyst ratio of 35, the increase in temperature from 200 to 350 °C leads to around 19% elevation in the conversion response. The global minimum conversion with the amount of 48.5% is observed at a low range of temperature and molar ratio. The statistical analysis shown in Table S-3† reveals that the most effective parameter on conversion against M and T is the catalyst molar ratio (X2) with an F-value of 34.46. The reason is that conversion rates include the transformation of feed into a set of products, some of which are exothermic and some are endothermic reactions. As a result, temperature variation has a two-way effect on their production rate. Moreover, temperature elevation has a positive impact on the increasing by-products reactions such as cracking, hydrogenolysis and aromatic, which consequently raise the overall conversion.
It is obvious that the conversion is sharply increased with the increase in catalyst molar ratio at a constant time on stream. For instance, at t = 72 h, the conversion increased from 51.2 at M = 5 to 57.4 at M = 35. According to our recorded experimental results, the optimized RN generalization performance has a slightly better prediction especially at upper and lower parts of domain exemplars. It should be noted that in the second set of experiments, the temperature keeps constant at 300 °C for all the responses. Again, the ANOVA results (see Table S-3†) exhibited that the catalyst molar ratio with an F-value of 55.36 is more crucial compared to the time on stream. This issue indicates that the catalyst deactivation over time through the coke deposition is very low, the TGA results of which support this claim. According to the TGA results, the amount of coke deposited on the catalysts is as follows: 14.5 wt% (PCZH(5)), 10.2 wt% (PCZH(10)), 4.0 wt% (PCZH(20)), and 2.1 wt% (PCZH(35)). Hence, it is clear that the catalyst structural properties are much more effective than the reaction conditions.
Generally, the isomerization reaction products were categorized into two distinct groups, monobranched (MOB) and multibranched (MUB) isomers. Moreover, selectivity responses defined as an amount of n-C7 transformed into certain products per total amount of n-heptane converted. Fig. 10 depicts the generalization of MOB selectivity versus M, T and t. It can be observed that both optimized RN and RSM have similar performances over the entire domain. According to this figure, the MOB selectivity reduced with the increasing temperature nearly in all amounts of catalyst molar ratio. The global maximum value of MOB (29.6%) is exhibited in the minimum temperature range (200 °C) and relatively large value of Cr/Zr = 30. It seems that the thermodynamic limitation on the production of isomer products is affected by the higher conversion rate to isomer products at a lower temperature. Statistical analysis on Table S-3† indicates that in the RSM model, the quadratic term of X22 with an F-value of 56.18 is significant for the MOB selectivity. Two equal 3D plots related to MOB selectivity versus M and t suggest that PCZH(30) has the highest amount throughout the time domain. Reducing the catalyst molar ratio from 30 to 5 leads to a decrease in the MOB selectivity by 34.7%. It is obvious that time on stream parameter does not have any significant effect on the MOB selectivity, which is in good agreement with the results of Table S-3.†
 | ||
| Fig. 10 Generalization performances of optimized RN (lefts) plus RSM (rights) for MOB selectivity versus catalyst molar ratio, temperature (upper) and time (bottom). | ||
A similar trend of MOB can be found in Fig. 11 for MUB selectivity in which the selectivity decreases with the increase in feed temperature. Again, the maximum value of MUB can be observed in the PCZH(30) at 200 °C. Moreover, the time does not have any significant effect on the MUB selectivity.
 | ||
| Fig. 11 Generalization performances of optimized RN (lefts) plus RSM (rights) for MUB selectivity versus catalyst molar ratio, temperature (upper) and time (bottom). | ||
Our synthesis catalyst has a considerable MUB selectivity compared to other catalysts defined in the open literature.8,48 It is obvious that the development of multibranched isomers due to their bulky configuration is more challenging compared to monobranched ones. Moreover, a relatively immense structure of these molecules postpones or in some cases prevents their formation, desorption, and diffusion within the small pores of the catalyst. If the multibranched isomer produced inside the tiny pores cannot leave, then the cracking process will be inevitable. Generally, the pore volume and also pore diameter have crucial effects on the MOB and MUB selectivity. Scrutinizing of Fig. 10 and 11 reveals that the values of both the MOB and MUB are very close, hence it can be concluded that a balanced fraction of meso and micro pores are formed inside the structure of our synthesized catalyst.
As it was expected, the generalization performance of optimized RN and RSM revealed that i-C7 selectivity is reduced with the temperature elevation (see Fig. 12). Totally, the n-heptane isomerization reaction is gently exothermic; hence, the high temperature is not favourable for isomerization reaction plus improvement in the production rate of n-C7 isomers (i-C7). Such as selectivity to MOB and MUB, the maximum value of i-C7 selectivity is happened over PCZH(30) at minimum temperature of 200 °C.
 | ||
| Fig. 12 Generalization performances of optimized RN (lefts) plus RSM (rights) for i-C7 selectivity versus catalyst molar ratio, temperature (upper) and time (bottom). | ||
Comparison of Fig. 10, 11 and 12 disclose that temperature elevation leads to the reduction of the selectivity to isomerization products (i-C7) as mono branched (MOB) and multi branched (MUB) isomers. Generally, the selectivity of i-C7 reduces with boosting temperature, due to the thermodynamic limit of the isomerization reaction. According to the structural properties reported in Table 3, the molar ratios show a very different trend for silica to zirconium. Specifically, in the transition from the Cr/Zr molar ratio of 20 to 35 (i.e. PCZH(20) to PCZH(35)), the amount of silica to zirconium increases sharply. This indicates that the zirconium content is very low in the prepared catalyst structure, which largely reflects the specific behaviour of PCZH(30). On the other hand, the values obtained from the NH3-TPD and H2-chemisorption analyses show very effective values in the transition from PCZH(20) to PCZH(35) catalyst.
Scrutinizing of Fig. 13 reveals that the generalization performance of optimized RN and RSM methods for crack selectivity versus temperature and catalyst molar ratio are identical, while RN unable to filter out the noise and capture truth hypersurface for the second set of the experiment (λ* = 0.000819; σ* = 0.1). It is pretty clear that LOOCV criterion is successful to stabilize the generalization performance of RN in the case of crack selectivity versus T and M, however, severe oscillations in the same response versus t and M shows that aforementioned criterion severely fails to supply the optimal level of regularization parameter for the regularization network. Besides LOOCV, some other complex techniques can be found in the literature for selecting the optimum value of λ.49 It is obvious that in the absence of an efficient algorithm for successful evaluation of the λ, the calculated values for the optimal spreads have no practical meaning and both factors should be recomputed employing new techniques. The bottom-3D surface of Fig. 13 indicates that visual optimization of regularization level effectively extracts the true underlying trend embedded in the training data when the appropriate value of λ* = 0.01 and σ* = 0.9 are substituted as the regularization parameter and Gaussian isotropic spread.
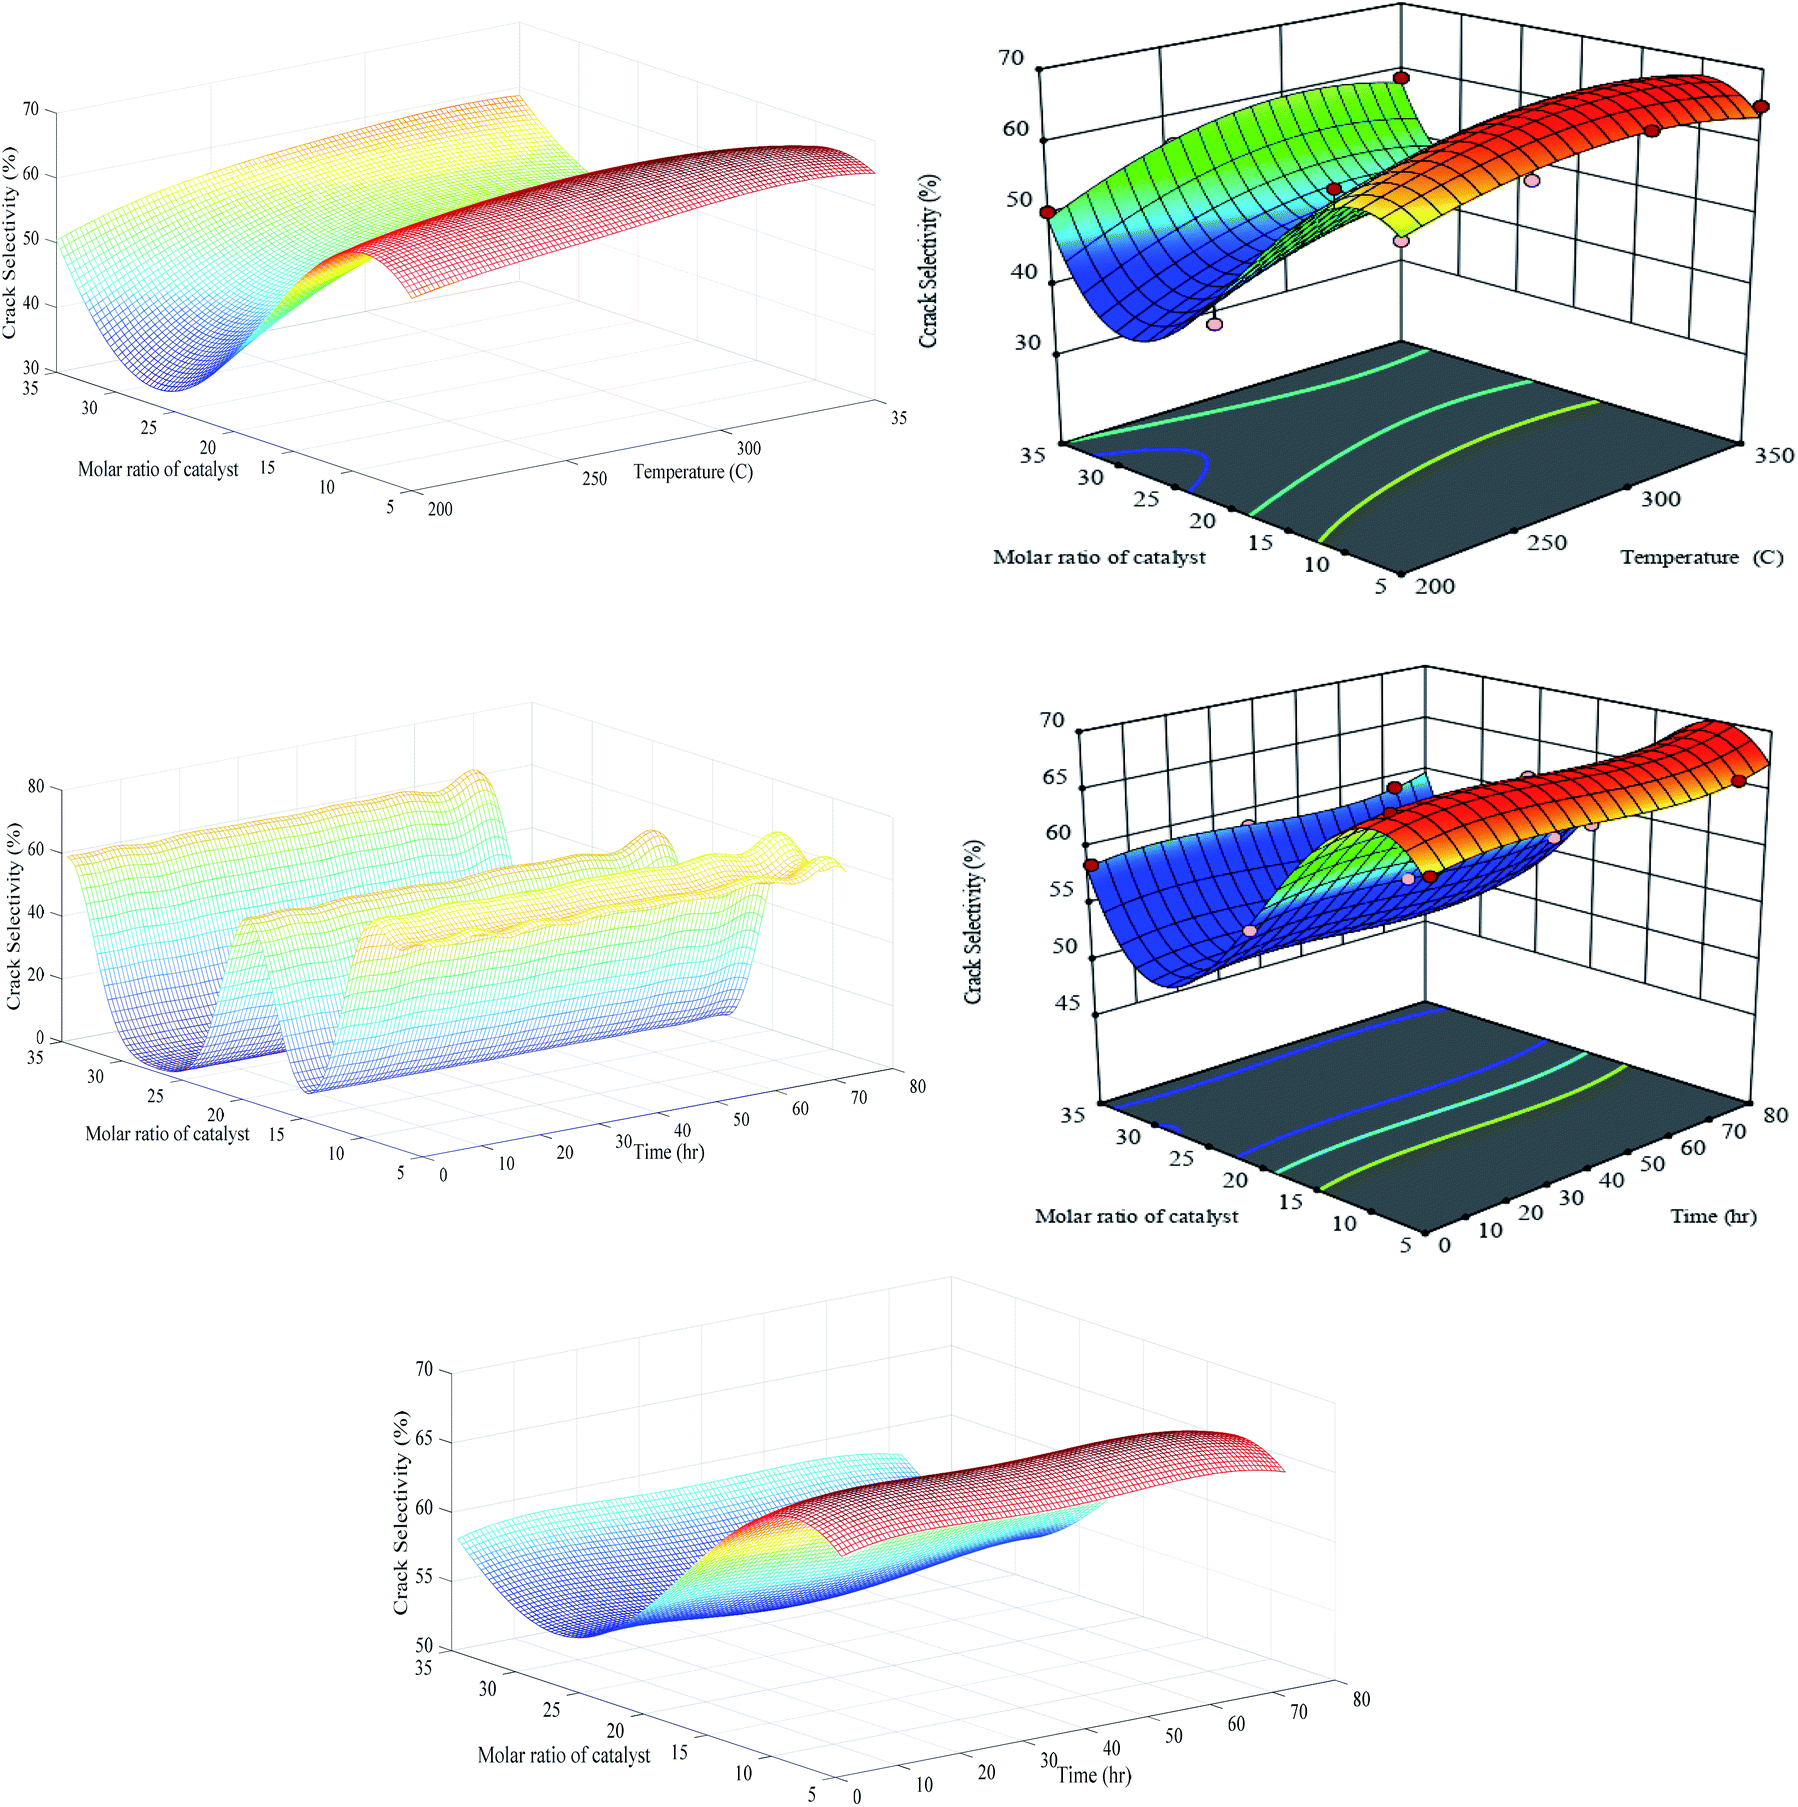 | ||
| Fig. 13 Generalization performances of optimized RN (lefts) plus RSM (rights) for crack selectivity versus catalyst molar ratio, temperature (upper) and time (bottom). | ||
Generalization performance of Fig. 13 shows that the global minimum crack selectivity of 35% occurs at PCZH(30) and a minimum temperature of 200 °C. This catalyst exhibits also better catalytic selectivity to isomer products and lower selectivity to undesired products as cracking, hydrogenolysis and aromatic products than others.8,48 Decreasing molar ratio form PCZH(30) to PCZH(5) at all temperature causes an increase in cracking selectivity. In other words, incorporating chromium into Pt–Zr-HMS decreases the cracking selectivity.
As can be seen, the crack selectivity variation versus temperature and time follows the same trend. Moreover, generalization performances verify that the impact of catalyst molar ratio is completely significant against other variables (see Table S-3†). The isomerization and the cracking reactions are two competing reactions on the acidic sites; however, the cracking reaction at high temperatures is the dominant reaction. Accordingly, it can be concluded that proper equilibrium between acidic and metallic sites as well as ease of transport of reactants into the pores with appropriate size can have a significant effect on the selectivity to cracking products.
Aromatization and cracking occur at high temperatures, which means that aromatization and hydrocracking are competitive reactions, which implies that temperature and catalytic acidity have positive effects on this competition.
According to Fig. 14, the generalization performances of optimized RN in the first set of experiments for hydrogenolysis selectivity is slightly better than RSM since the hypersurface of RSM oscillates in the negative quantities. It is quite clear that the LOOCV criterion is relatively successful to stabilize the generalization performance of the optimal regularization network when a sufficient number of training exemplars are recruited. The hydrogenolysis selectivity is sharply increased by temperature elevation especially in the range of 280–350 °C, for instance, at constant Cr/Zr = 5, around 150 °C increase in the temperature leads to promotion from 0.5 to 5.8% in hydrogenolysis selectivity. The statistical analysis from Table S-3† shows that the temperature variable is significant compared to the catalyst molar ratio, which is in good agreement with results shown in Fig. 14. Moreover, elapsing time does not have any considerable change in the hydrogenolysis selectivity. Hydrogenolysis is controlled by the metal function and is not affected by the presence or absence of acidic sites. The dehydrogenated carbon species are intermediate for hydrogenolysis reaction, which, if they are highly dehydrogenated, becomes a coke precursor. This indicates that the sites responsible for both reactions are the same. The observed results confirm that molar ratios are more effective than environmental conditions such as temperature and time.
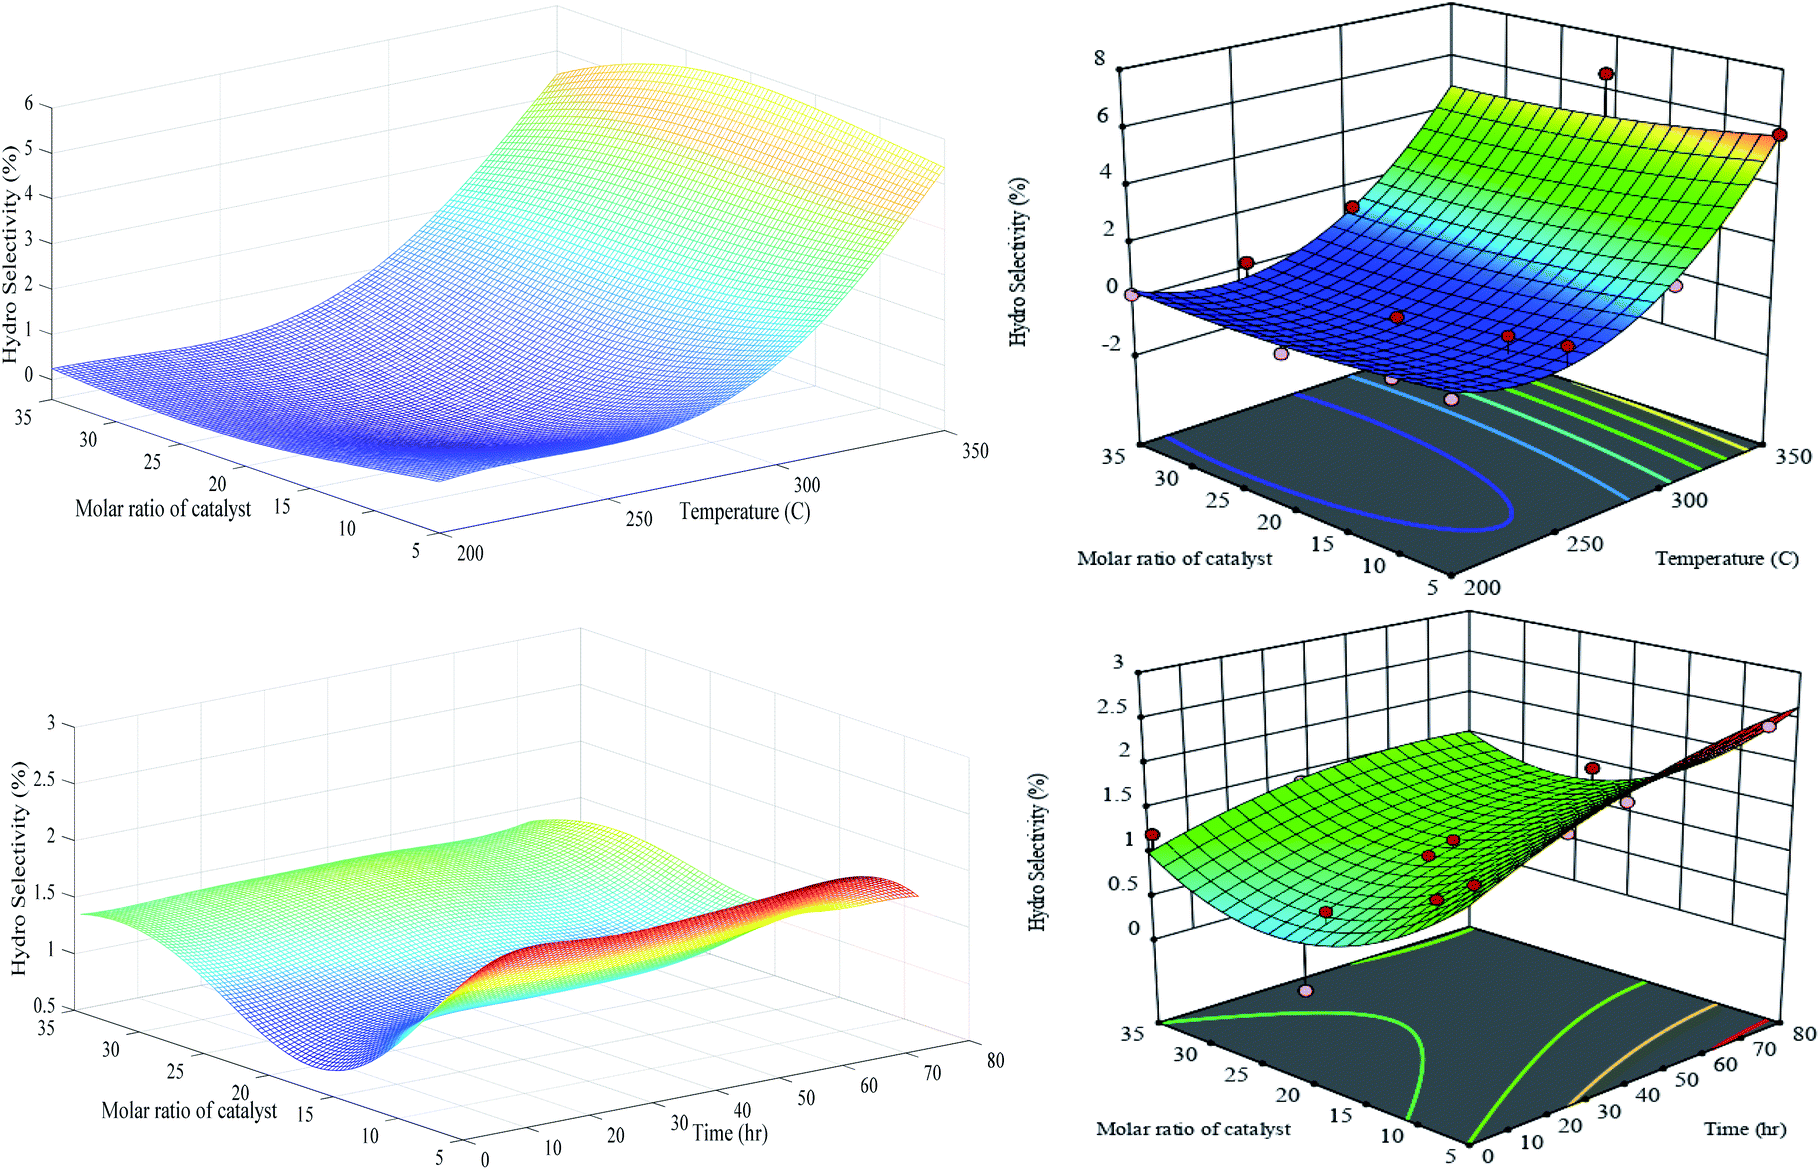 | ||
| Fig. 14 Generalization performances of optimized RN (lefts) plus RSM (rights) for hydro selectivity versus catalyst molar ratio, temperature (upper) and time (bottom). | ||
Our synthesized PCZH catalysts, form very low aromatization products (between 0 and 2% selectivity), so we do not present them here. Due to the abundant existence of mesoporosity in HMS, the hydrogen transfer reactions form olefinic and cyclic intermediates are accelerated, hence the yields of aromatics plus cracking are promoted.
The results show that our catalyst has a good performance for cracking selectivity. Although, aromatic compounds have relatively high-octane numbers and also display a positive effect on RON, but due to toxic emissions, the presence of these constituents in the gasoline is not allowed from environmental points of view.16 Regarding this aspect, our prepared catalysts fulfil this purpose and produce very low aromatization products.
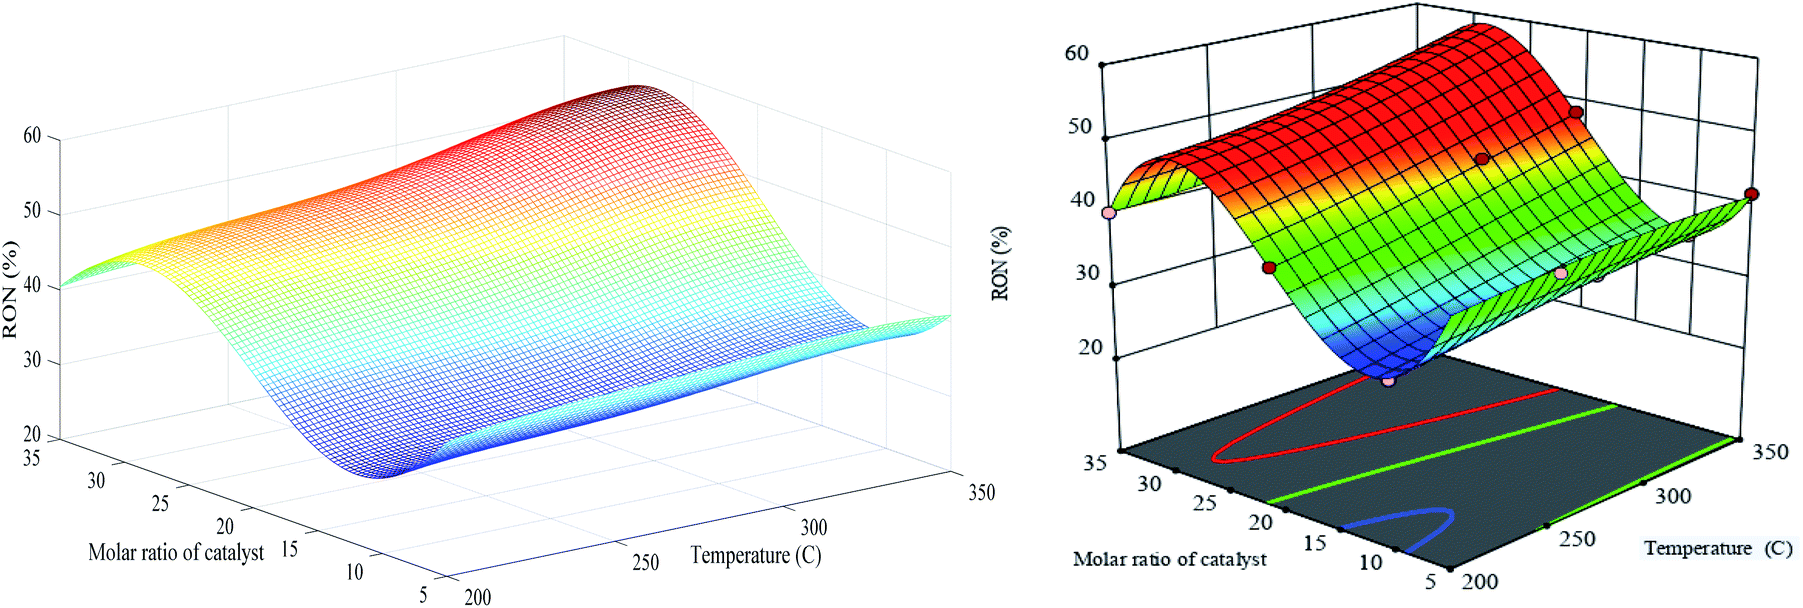
Similar 3D performances of the optimized RN and RSM for the RON are presented in Fig. 15. The RON has an increasing trend with the temperature elevation and also, the PCZH(30) shows the maximum RON with the amount of 59%. At a constant molar ratio of 30%, the increase in temperature from 200 to 350 °C leads to 18% elevation in the RON. Both Fig. 15 and Table S-3† show that the catalyst molar ratio is more significant than other parameters.
 | ||
| Fig. 15 Generalization performances of optimized RN (lefts) plus RSM (rights) for RON selectivity versus catalyst molar ratio and temperature. | ||
These consequences were also not surprising since these molar ratios affect the acidity of catalyst samples and hence the generation of products with high octane numbers alter considerably. In addition, the effect of platinum dispersion cannot be ignored in the production of isomeric products with high octane numbers.
Conclusion
The aim of the present study was to investigate a new solid catalyst for n-heptane isomerization to boost the research octane number. In this way, the collections of the Pt–Cr/Zr(x)-HMS catalysts with various Cr/Zr molar ratios were prepared for isomerization purposes. The effect of diverse amounts of Cr/Zr on the activity and different kinds of selectivity in the temperature extent of 200–350 °C and time on stream of 1–72 h were analysed. Around 32 different experiment runs were suggested using the Design-Expert software. The optimized in-house regularization network plus surface response methodology were recruited to find the relationship between activity and selectivity of prepared catalyst samples versus influencing preparation parameters of catalyst molar ratio, feed temperature and time. Moreover, the predictive and generalization capabilities of both modelling techniques were compared together. Based on the obtained results, the following conclusions can be drawn:(1) XRD patterns of prepared catalysts show the good dispersion of Cr and Zr into the structure of catalyst.
(2) The incorporation of Cr in the Pt–Zr-HMS catalyst structure promotes catalyst activity. The amount of conversion increased with the increase in temperature in all catalyst molar ratios and maximum conversion of 63% happens at PCZH(30) and T = 200 °C.
(3) All MOB, MUB and i-C7 selectivity reduced with the increase in temperature nearly in all amounts of catalyst molar ratio. The global maximum value of MOB (29.6%), MUB (32%) and i-C7 (66%) was observed at a minimum temperature of 200 °C and PCZH(30). The existence of equilibrium between acidic and metallic sites in the prepared catalyst plus ease of movement reactants inside the pores has a profound effect on the selectivity of cracking products. Moreover, the PCZH(30) shows the minimum cracking selectivity.
(4) Hydrogenolysis selectivity elevates with the increase in temperature considerably, but is not sensitive to the variation in the catalyst molar ratio. Moreover, the generation of high-octane numbers (59%) for PCZH(30) is the consequence of proper acidity of catalyst and platinum dispersion. TGA results indicated that catalyst deactivation over time through the coke deposition is very low. Moreover, prepared catalyst form very low aromatization products, which are very suitable in the environmental aspect of view.
The firm mathematical structure of RN accompanied by superior training and validation at different data point exemplars exhibits its ability for the construction of interpolation hyper-surface. Moreover, the remarkable generalization performances disclose that the RN equipped with an efficient algorithm of LOOCV can effectively sift the noise and find the true underlying trend rooted in the experimental data sets. According to ANOVA, except for hydrogenolysis selectivity, the molar ratio of Cr/Zr has a more significant effect than temperature and time on the conversion and selectivity of prepared catalysts. Based on the statistical analysis, the optimized RN has a slightly better performance than the RSM.
Conflicts of interest
There are no conflicts to declare.Acknowledgements
Authors gratefully acknowledged to Dr Mohammad Hasan Peyrovi, Faculty of Chemistry Science and Petroleum and University of Shahid Beheshti to provide some facility for the initial synthesis of catalysts. I would also like to thank Mr Abolfazl Hosseini, that his thesis helped me give an overview of the work.Notes and references
- B. Huang, P. Bai, M. Neurock and R. J. Davis, Appl. Catal., A, 2017, 546, 149–158 CrossRef CAS.
- N. A. A. Fatah, S. Triwahyono, A. A. Jalil, A. Ahmad and T. A. T. Abdullah, Appl. Catal., A, 2016, 516, 135–143 CrossRef CAS.
- L. Gao, Z. Shi, U. J. Etim, P. Wu, W. Xing and Y. Zhang, et al., Fuel, 2019, 252, 653–665 CrossRef CAS.
- M. D. Smolikov, V. A. Shkurenok, D. I. Kir'yanov and A. S. Belyi, Catal. Today, 2019, 329, 63–70 CrossRef CAS.
- L. Gao, Z. Shi, U. J. Etim, P. Wu, D. Han and W. Xing, et al., Microporous Mesoporous Mater., 2019, 277, 17–28 CrossRef CAS.
- S. U. Lee, E. S. Kim, T. W. Kim, J. R. Kim, K. E. Jeong, S. Lee and C. U. Kim, J. Ind. Eng. Chem., 2020, 83, 366–374 CrossRef CAS.
- A. Martins, J. M. Silva and M. F. Ribeiro, Appl. Catal., A, 2013, 466, 293–299 CrossRef CAS.
- T. D. Pope, J. F. Kriz, M. Stanciulescu and J. Monnier, Appl. Catal., A, 2002, 233, 45–62 CrossRef CAS.
- P. Liu, X. Zhang, Y. Yao and J. Wang, React. Kinet., Mech. Catal., 2010, 100, 217–226 CAS.
- Y. Nie, S. Shang, X. Xu, W. Hua, Y. Yue and Z. Gao, Appl. Catal., A, 2012, 433, 69–74 CrossRef.
- Y. Xia and R. Mokaya, J. Mater. Chem., 2004, 14, 863–870 RSC.
- C. Lin, H. Pan, Z. Yang, X. Han, P. Tian and P. Li, et. al., Ind. Eng. Chem. Res., 2020, 59, 6424–6434 CrossRef.
- N. Parsafard, M. H. Peyrovi and N. Parsafard, Chin. Chem. Lett., 2017, 28, 546–552 CrossRef CAS.
- M. H. Peyrovi, N. Parsafard and P. Peyrovi, Ind. Eng. Chem. Res., 2014, 53, 14253–14262 CrossRef CAS.
- N. Parsafard, M. H. Peyrovi and M. Jarayedi, Energy Fuels, 2017, 31, 6389–6396 CrossRef CAS.
- N. Parsafard, M. H. Peyrovi and M. Rashidzadeh, Microporous Mesoporous Mater., 2014, 200, 190–198 CrossRef CAS.
- M. H. Peyrovi, N. Parsafard and H. R. Anajafi, Chem. Phys. Lett., 2018, 713, 32–38 CrossRef CAS.
- N. Igarashi, S. Kidani, R. Ahemaito, K. Hashimoto and T. Tatsumi, Microporous Mesoporous Mater., 2005, 81, 97–105 CrossRef CAS.
- M. L. Occelli, S. Biz and A. Auroux, Appl. Catal., A, 1999, 183, 231–239 CrossRef CAS.
- S. Lim, Y. Yang, D. Ciuparu, C. Wang, Y. Chen and L. Pfefferle, et al., Top. Catal., 2005, 34, 31–40 CrossRef CAS.
- Y. Gucbilmez, T. Dogu and S. Balci, Catal. Today, 2005, 100, 473–477 CrossRef CAS.
- M. Selvaraj, P. K. Sinha, K. Lee and I. Ahn, Microporous Mesoporous Mater., 2005, 78, 139–149 CrossRef CAS.
- Q. Zhang, W. Yang, X. Wang, Y. Wang, T. Shishido and K. Takehira, Microporous Mesoporous Mater., 2005, 77, 223–234 CrossRef CAS.
- S. Gontier and A. Tuel, Appl. Catal., A, 1996, 143, 125–135 CrossRef CAS.
- T. Hamoule, M. H. Peyrovi, M. Rashidzadeh and M. R. Toosi, Catal. Commun., 2011, 16, 234–239 CrossRef CAS.
- N. Parsafard, M. H. Peyrovi and N. Parsafard, React. Kinet., Mech. Catal., 2017, 120, 231–246 CrossRef CAS.
- N. Teslić, N. Bojanić, D. Rakić, A. Takači, Z. Zeković, A. Fišteš, M. Bodroža-Solarov and B. Pavlić, Chem. Eng. Process., 2019, 143, 107634–107644 CrossRef.
- A. G. Asil, A. N. Pour and S. Mirzaei, Chem. Prod. Process Model., 2019, 14, 20180022 Search PubMed.
- N. A. Eleburuike, W. A. W. A. Bakar, R. Ali and M. F. Omar, RSC Adv., 2016, 6, 104082–104093 RSC.
- J. M. Avramović, A. V. Veličković, O. S. Stamenković, K. M. Rajković, P. S. Milić and V. B. Veljković, Energy Convers. Manage., 2015, 105, 1149–1156 CrossRef.
- S. M. Mousavi, A. Niaei, D. Salari, P. N. Panahi and M. Samandari, Environ. Technol., 2013, 34, 1377–1384 CrossRef CAS PubMed.
- A. Hafizi, A. Ahmadpour, M. Koolivand-Salooki, M. M. Heravi and F. F. Bamoharram, J. Ind. Eng. Chem., 2013, 19, 1981–1989 CrossRef CAS.
- S. Mirzaei, A. Ahmadpour, A. Shahsavand, H. Rashidi and A. Arami-Niya, Ind. Eng. Chem. Res., 2020, 59, 1875–1887 CrossRef CAS.
- L. Ma, E. Lv, L. Du, J. Lu and J. Ding, Energy Convers. Manage., 2016, 122, 411–418 CrossRef CAS.
- A. G. Asil and A. Shahsavand, J. Nat. Gas Sci. Eng., 2014, 21, 791–804 CrossRef.
- S. Haykin, Neural Networks: A Comprehensive Foundation, Prentice Hall PTR, 1994 Search PubMed.
- T. Poggio and F. Girosi, Science, 1990, 247, 978–982 CrossRef CAS PubMed.
- F. Girosi, M. Jones and T. Poggio, Neural Comput., 1995, 7, 219–269 CrossRef.
- A. G. Asil, A. N. Pour and S. Mirzaei, Heat Mass Transfer, 2018, 54, 2975–2986 CrossRef.
- T. Poggio and F. Girosi, A theory of networks for approximation and learning, Massachusetts INST of TECH Cambridge Artificial Intelligence LAB, 1989 Search PubMed.
- M. S. Hamdy and G. Mul, Appl. Catal., B, 2015, 174, 413–420 CrossRef.
- M. K. Trivedi, A. Branton, D. Trivedi and G. Nayak, Journal of Powder Metallurgy & Mining, 2015, 4, 1 Search PubMed.
- A. Shahsavand and A. Ahmadpour, Comput. Chem. Eng., 2005, 9, 2134–2143 CrossRef.
- A. Shahsavand and M. P. Chenar, J. Membr. Sci., 2007, 297, 59–73 CrossRef CAS.
- A. R. Khataee, A. Karimi, R. D. C. Soltani, M. Safarpour, Y. Hanifehpour and S. W. Joo, Appl. Catal., A, 2014, 488, 160–170 CrossRef CAS.
- A. H. Fauzi and N. A. Amin, Energy Convers. Manage., 2013, 76, 818–827 CrossRef.
- H. Soleimanzadeh, A. Niaei, D. Salari, A. Tarjomannejad, S. Penner and M. Grünbacher, et al., J. Environ. Manage., 2019, 238, 360–367 CrossRef CAS PubMed.
- G. Kinger, D. Majda and H. Vinek, Appl. Catal., A, 2002, 225, 301–312 CrossRef CAS.
- M. N. Shahrak, A. Shahsavand and A. Okhovat, Chem. Eng. Res. Des., 2013, 91, 51–62 CrossRef.
Footnote |
| † Electronic supplementary information (ESI) available. See DOI: 10.1039/d0ra04313c |
| This journal is © The Royal Society of Chemistry 2020 |