
 Open Access Article
 This Open Access Article is licensed under a Creative Commons Attribution-Non Commercial 3.0 Unported Licence
Fabrication of paper microfluidic devices using a toner laser printer†
James S. Nga and
Michinao Hashimoto *abc
*abc
aPillar of Engineering Product Development, Singapore University of Technology and Design, 8 Somapah Road, Singapore, 487372, Singapore. E-mail: hashimoto@sutd.edu.sg; Tel: +65 6499 4867
bSUTD-MIT International Design Centre, Singapore University of Technology and Design, 8 Somapah Road, Singapore 487372, Singapore
cDigital Manufacturing and Design Centre, Singapore University of Technology and Design, 8 Somapah Road, Singapore 487372, Singapore
First published on 12th August 2020
Abstract
This paper describes a method to fabricate microfluidic paper-based analytical devices (μPADs) using a toner laser printer. Multiple methods have been reported for the fabrication of μPADs for point-of-care diagnostics and environmental monitoring. Despite successful demonstrations, however, existing fabrication methods depend on particular printers, in-house instruments, and synthetic materials. In particular, recent discontinuation of the solid wax printer has made it difficult to fabricate μPADs with readily available instruments. Herein we reported the fabrication of μPADs using the most widely available type of printer: a toner laser printer. Heating of printed toner at 200 °C allowed the printed toner to reflow, and the spreading of the hydrophobic polymer through the filter paper was characterized. Using the developed μPADs, we conducted model colorimetric assays for glucose and bovine serum albumin (BSA). We found that heating of filter paper at 200 °C for 60 min caused the pyrolysis of cellulose in the paper. The pyrolysis resulted in the formation of aldehydes that could interfere with molecular assays involving redox reactions. To overcome this problem, we confirmed that the removal of the aldehyde could be readily achieved by washing the μPADs with aqueous bleach. Overall, the developed fabrication method should be compatible with most toner laser printers and will make μPADs accessible in resource-limited circumstances.
Introduction
This paper describes a method to fabricate microfluidic paper-based analytical devices (μPADs)1–7 using a commercially available toner laser printer. Wax printing is arguably the gold standard to fabricate μPADs,8–17 but it requires a specific model of commercial printers and cartridges (e.g., ColorQube Series, FujiXerox, Japan). At present, the manufacturer has discontinued the production of some models of the wax printers (e.g., ColorQube 8000 series), and the solid wax cartridges are not readily available. In this work, we developed a method to fabricate μPADs using a toner laser printer and filter paper. We identified the conditions for the printed toners to penetrate through the filter paper by thermal reflow and confirmed that the fabricated μPADs were applicable to perform representative colorimetric assays. The principle of the fabrication should be compatible with most toner printers. Our method alleviates the dependence on solid wax printers by offering an alternative route to fabricate μPADs.Fabrication of μPADs has been demonstrated in various methods, such as wax printing,8–21 inkjet printing,22–24 screen printing,7,25–28 photolithography.1,29–33 These μPADs were used to perform analytical assays for point-of-care diagnostics and environmental monitoring.2,18,19,28,34–36 Such methods of fabrication required particular materials (synthetic hydrophobic precursor37–39 and photoresist1,32) and equipment (wax printer,20,21,40–45 inkjet printer,22,23 laser,39,45 mask aligner,1 and UV lamp32,33,37,38) to create the devices. Fabrication of μPAD has been initially demonstrated via photolithography, while direct printing of hydrophobic materials has been developed as alternative routes. Direct material printing would require adequate physical properties of the inks (e.g., viscosity, surface tension, particle sizes) to avoid the clogging of the nozzles.46,47 Screen printing additionally requires manual processes to pattern hydrophobic materials using masks or stencils.25,26 We summarized the existing methods to fabricate μPAD (Table 1). Overall, photolithography offers better control to pattern hydrophobic materials (i.e., the channel width of ∼250 μm) than the direct printing of hydrophobic materials (e.g., wax printing, inkjet printing, and screen printing) with the trade-off of increased complexity in the fabrication process. Wax printing, for example, suffers from an uncontrolled flow of wax in the paper, which results in a large variation of the printed and obtained channel widths. Nevertheless, wax printing is widely employed for the fabrication of μPAD due to simplicity.
| Method | Equipment | Materials | Resolution (μm) | Fabrication time (min) | Challenges | Ref. |
|---|---|---|---|---|---|---|
| Wax printing | Wax printers | Solid wax | 561 ± 45 (ref. 8) | ∼5 (ref. 8) | Resolution, uncontrolled printing and reflow. Availability of wax printers | 8–21 |
| Inkjet printing | Inkjet printers | Formulated liquid ink | 590 (ref. 24) | >8 (ref. 24) | Resolution, customization of ink and printer | 22–24 |
| Screen printing | Customized masks | Wax, hydrophobic agents | 650 ± 71(ref. 25) | N/A | Resolution, mask fabrication, manual wax transfer | 7,25–28 |
| Photolithography | UV lamp | Photoresist | 256 ± 20 (ref. 31) | ∼30 (ref. 31) | Relatively complex fabrication with multiple steps | 1,29–33 |
Recent discontinuation of the widely used solid wax printer (ColorQube 8000 series) posed difficulty to perform rapid prototyping of μPAD. To address this problem, we investigated the use of an alternative printer for the fabrication of μPAD. An office toner printer is a good candidate due to its broad availability. While the use of a toner printer has been demonstrated for the fabrication of μPAD,48 the previous work did not report the pyrolysis of the cellulose paper leading to the formation of aldehyde that may interfere in colorimetric assays. To address this problem, we reported a simple method to remove aldehydes from the filter paper by washing with a laboratory bleach. Using the fabricated device, we performed colorimetric assays on 96-well PADs for the analysis of glucose and protein concentrations with a color scanner. This method of fabrication using a toner printer allows for quick and simple prototyping of point-of-care devices with low-cost equipment and materials. We believe that the reported technique can be carried out in a remote setting without the need for a cleanroom or laboratory, making the method of fabrication available to a wide range of users.
Results and discussions
The scope of the research
The objective of this research is to develop a method to fabricate μPAD using instruments and materials alternative to the wax printer and the solid ink. Ideal methods to fabricate μPAD meet the following criteria: (1) the material forming hydrophobic walls can be digitally patterned using readily available instruments, (2) the patterning process is simple and reproducible without manual processes involving stencils or masks, and (3) the patterning resolution is on the order of hundred micrometers. We chose toner as a material to fabricate hydrophobic patterns on the filter paper. Toner can be readily patterned using a laser printer; an office printer with a resolution of 600 dots per inch (dpi) prints the dot with a diameter of ∼42 μm. The patterns can be designed with a computer graphic software, and the printing can be performed at high speed (as high as 50 A4-sized pages per minute for the particular printer and the setting we used).Toner consists of different types of polymers (such as styrene acrylates and polyesters),49,50 and it has been used for the fabrication of microfluidic devices. The use of toner was reported in the fabrication of polydimethylsiloxane (PDMS) microchip as a master on a polyester film using a photocopier.51 Disposable microchips for electrophoresis were made using toner.52 Toner was patterned directly or indirectly onto polyester,53–55 glass,56 and elastomers57 to fabricate devices. Most commercial toners are proprietary, and the melting point (that determines the penetration temperature of the toner) is specific to the materials used. The composition of the toner used in the current experiment has been provided by the material safety data sheet (MSDS) of the manufacturer (Table S1†); the toner consisted of 80–90% of the polyester-based resin. The penetration of the polymers in the toner inks generally requires a longer duration of heating than solid wax inks. Our preliminary study suggested heating the paper at long duration may result in the pyrolysis of the cellulose comprising the filter paper. To this end, the objective of the current study was also to identify the methods to remove the product of pyrolysis that may interfere the application of the fabricated μPADs.
Fabrication of μPADs with a toner laser printer
First, we validated the feasibility of using a toner as a material to fabricate the hydrophobic barriers of μPAD. The toner used in the current work consists mostly of the polyester-based resin and additives (Table S1†). The standard fusing temperature of toner was reported to be 125–145 °C.58 We printed the toner on the filter paper and studied the conditions for the penetration of the hydrophobic polymers at 150 °C, 200 °C and 250 °C for up to 60 min (Fig. S1, ESI†). At 150 °C, the penetration of the toner did not take place within 60 min. At 250 °C, the filter paper became charred within 20 min. We, therefore, selected 200 °C as the heating temperature. The device was heated for 20, 40, and 60 min. We added red ink to ensure the penetration of hydrophobic barriers; the images of the back side of the paper suggested that the hydrophobic barriers did not form at 20 and 40 min. The red ink was confined within the defined region when the filter paper was heated for 60 min, suggesting the full penetration of the hydrophobic polymers. Overall, we chose the heating conditions at 200 °C for 60 min. The printed toner laterally spread while they vertically penetrated through the filter paper. To characterize the spreading of the toner, we printed the straight patterns of microchannels on the filter papers (Fig. 1A). Eight separate channels were fabricated to determine the degree of spreading by thermal reflow. Before heating, the width of the printed channels on the filter paper was consistent with the CAD-designed widths of 100–800 μm (Fig. 1B). The filter papers were heated at 200 °C on a hotplate for 60 min. One sheet of aluminum foil was placed on the hotplate below the sample, and another sheet aluminum foil was placed above the sample to facilitate uniform heating. An aqueous solution containing red food dye (cochineal red) was placed at the center of the patterned well to visualize the channels, and the widths of the channels were measured at the front side and the back side. With the design width of 400 μm, we obtained the minimum channel width of 24 ± 19 μm (front) and 411 ± 29 μm (back). For the channel widths below 400 μm, the spread toner merged and closed the channel on the back side. In those cases, the flow of the ink was not observed at the front side of the paper, and the channel width was characterized as zero on both sides (Fig. 1C). The cross-sectional images also suggested that the red ink did not flow through the channels when the design widths were 100–300 μm (Fig. 2A–C), and they formed channels with the design widths greater than 400 μm (Fig. 2D–H). These polymers spread radially from the printed toner, causing the width of the channels to be wider at the back side than at the front side. The experiments also suggested there were no upper limits in the attainable channel width.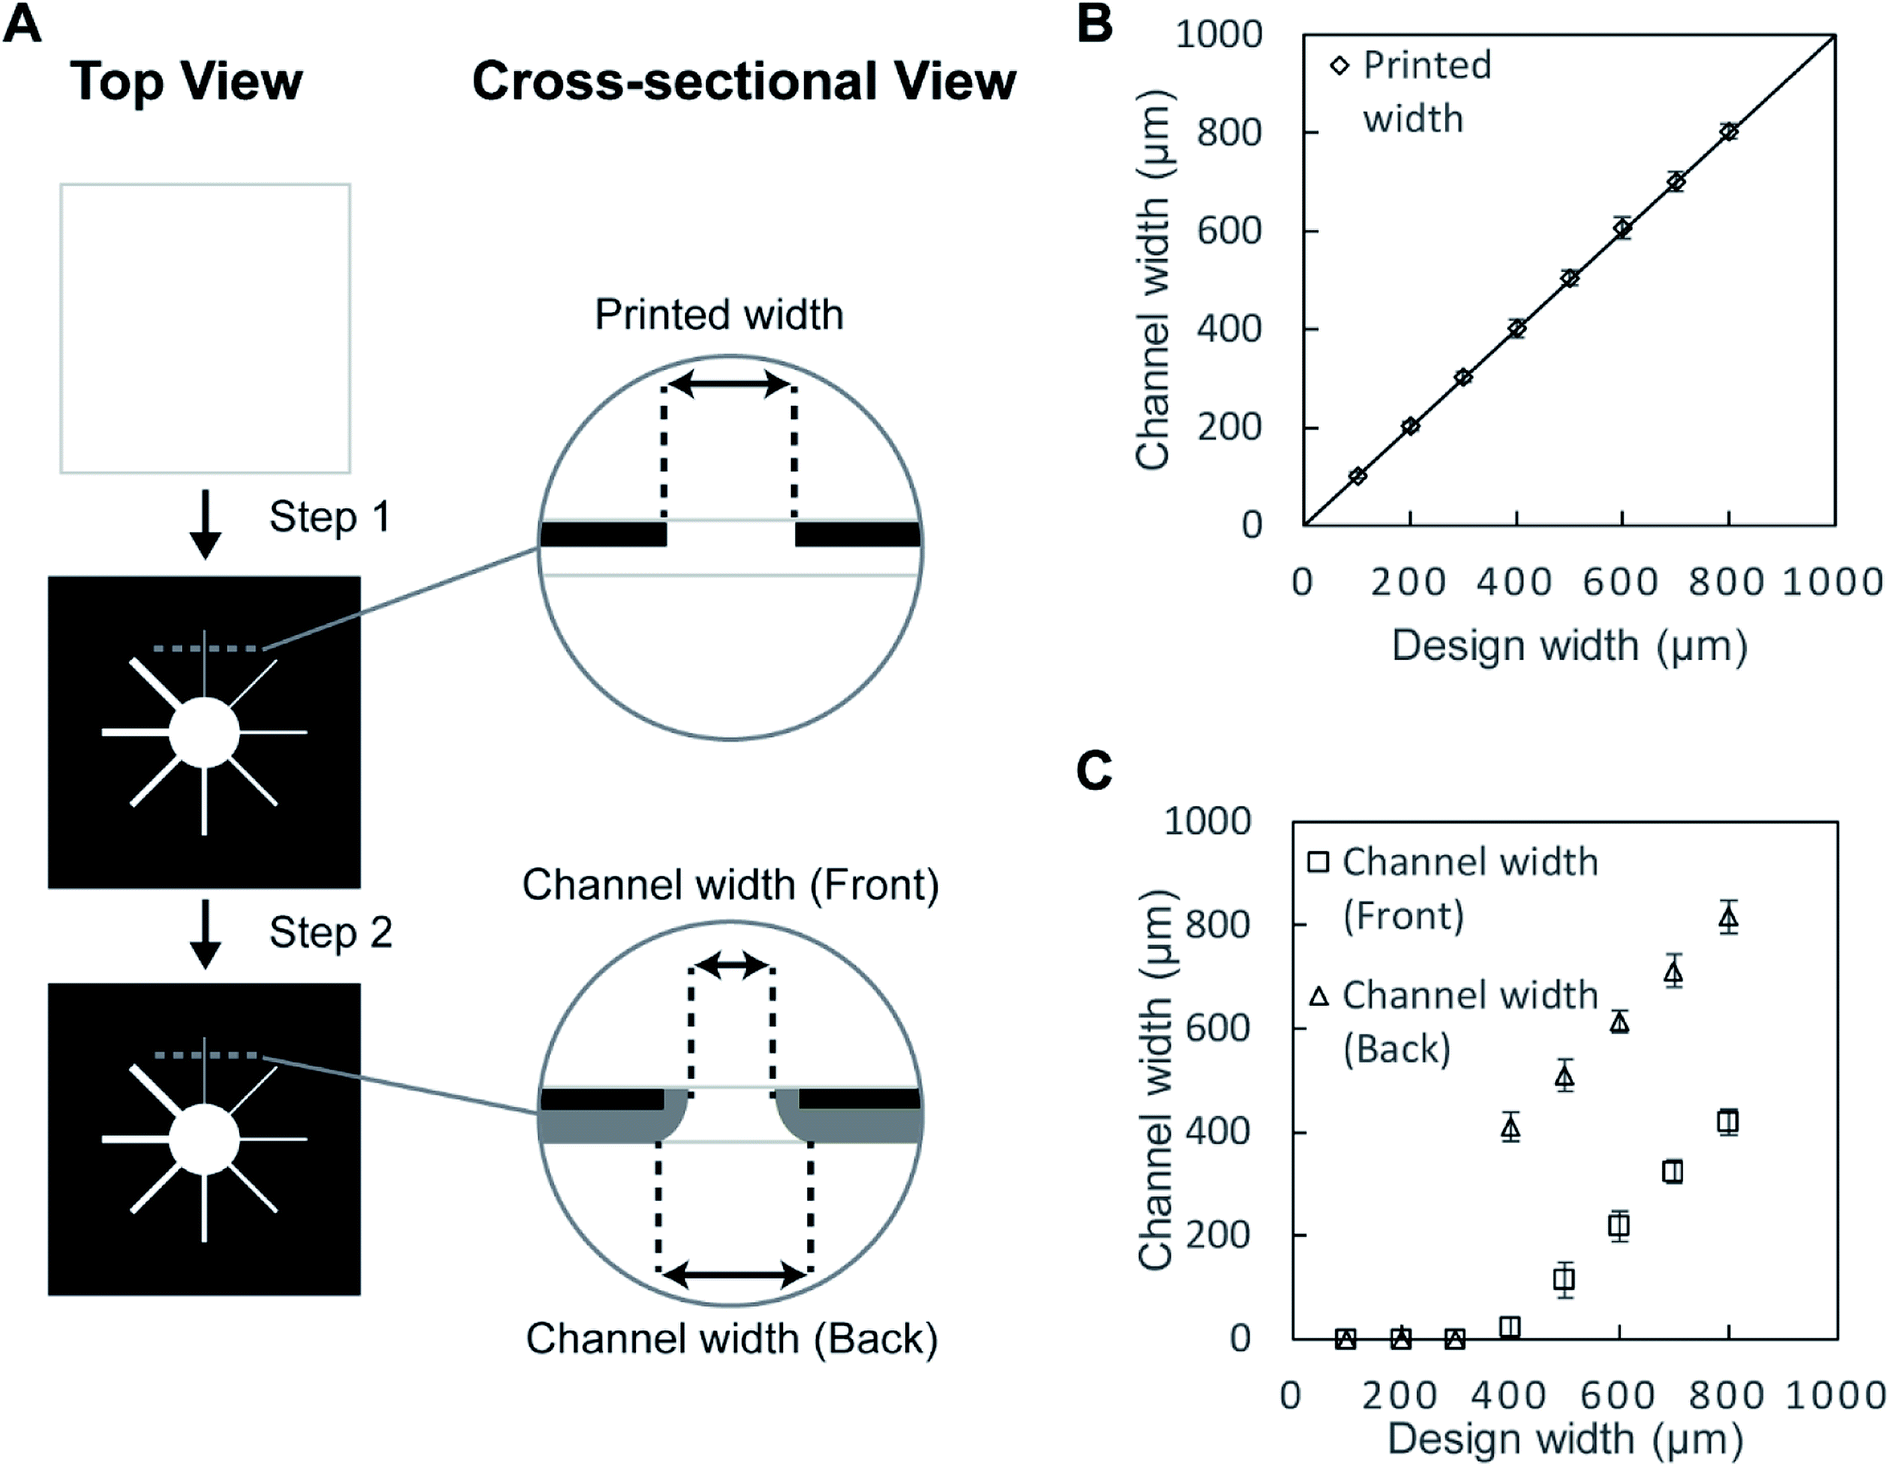 | ||
| Fig. 1 (A) Schematic illustration of the fabrication of the toner-based μPAD; the top view and the cross-sectional view of the filter paper during the fabrication are presented (Step 1) Toner was printed on a filter paper to create the patterns of the microchannels. (Step 2) The patterned filter paper was then heated on a hotplate at 200 °C for 60 min to create hydrophobic patterns. (B) A plot showing the width of the toner gap at the front side before the reflow of the toner (with respect to the design width) (n = 4). (C) A plot of the actual channel widths measured from the front and back of the paper after the reflow of the toner (with respect to the design width) (n = 4). | ||
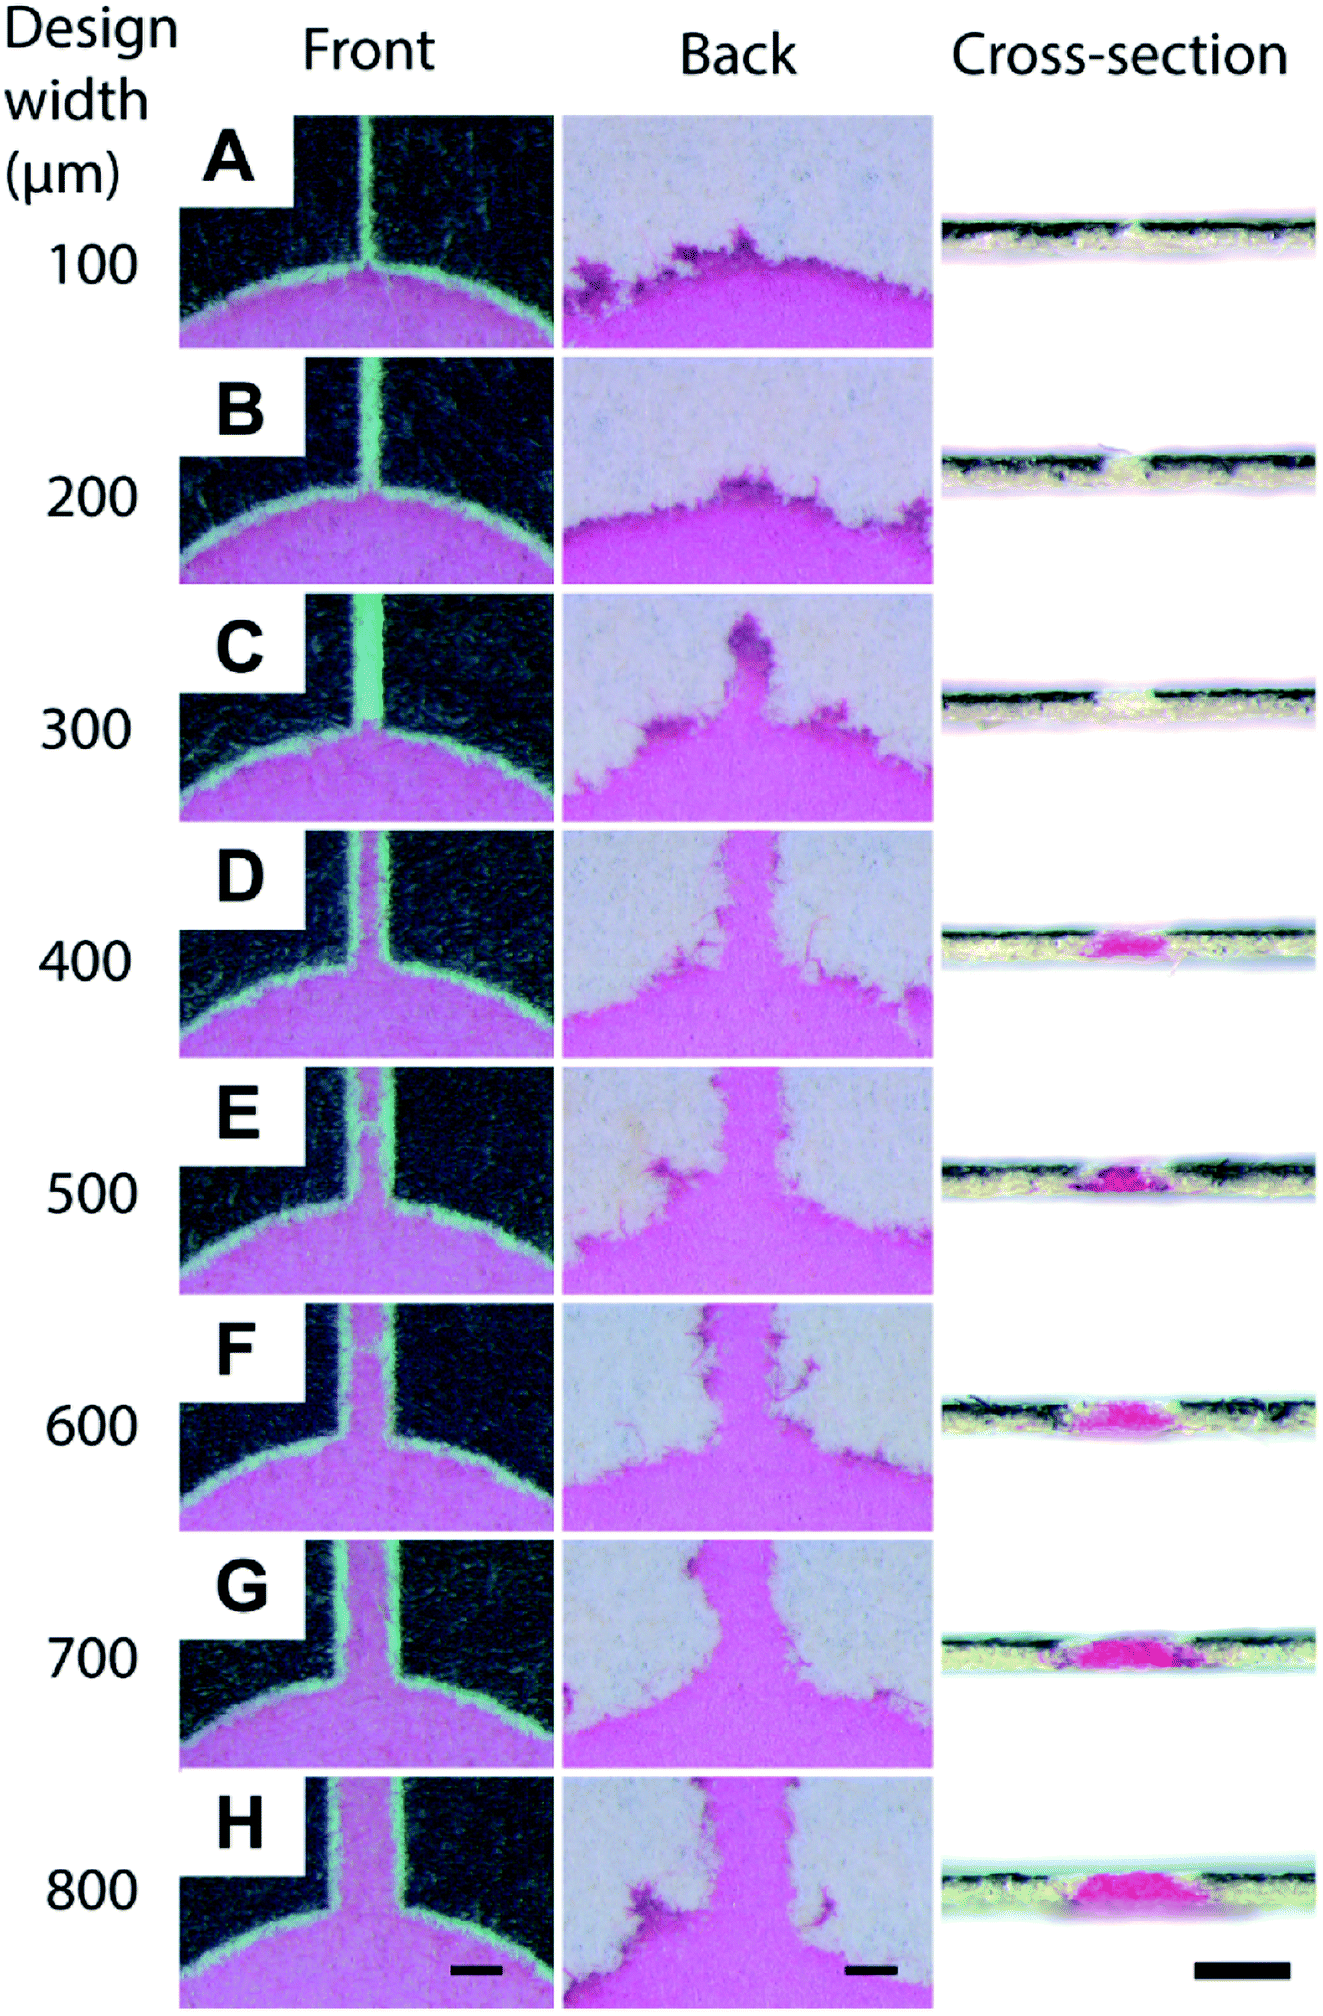 | ||
| Fig. 2 Dimensions of the toner-based channels. A solution containing red dye was deposited at the center of the eight microchannels (described in Fig. 1). The fluid flow along the hydrophilic region of the microchannel due to capillary action was visualized in red. Optical micrographs were taken at the front, the back, and the cross-section of the microchannels. The designed widths of the channels were (A) 100 μm, (B) 200 μm, (C) 300 μm, (D) 400 μm, (E) 500 μm, (F) 600 μm, (G) 700 μm, (H) 800 μm. Scale bar = 500 μm. | ||
To study the hydrophobicity of the heated toner in the filter paper, we measured the contact angle of D.I. water on the surface of the toner. The printed toner was heated at 200 °C for 60 min and washed as defined in the fabrication protocol. We placed droplets of the D.I. water (∼2 μL) at the surface of the filter paper covered with the toner and measured the contact angles. The average contact angle was 120.8° ± 2.9° (n = 4) (Fig. S2, ESI†), suggesting successful hydrophobic patterning. The droplets of the D.I. water remained spherical on the surface of the paper at least for 10 min without compromising the surface condition of the filter paper.
Once we demonstrated the ability to create hydrophobic channels by the toner, we printed various designs of microchannels on the filter paper and visualized the channels with the colored food dyes. Eight-way-channels was created with increasing channel widths from 500 μm to 4000 μm (Fig. 3A). This type of channel may be used in multiplex sensing of analytes. The channels can be patterned with Y-shaped branches (Fig. 3B), and with multiple inlets (Fig. 3C). These channels may be applicable to mix multiple reagents in μPAD. 96-well paper plates were also patterned using a toner (Fig. 3D); Such μPADs could be used for high throughput chemical assays.
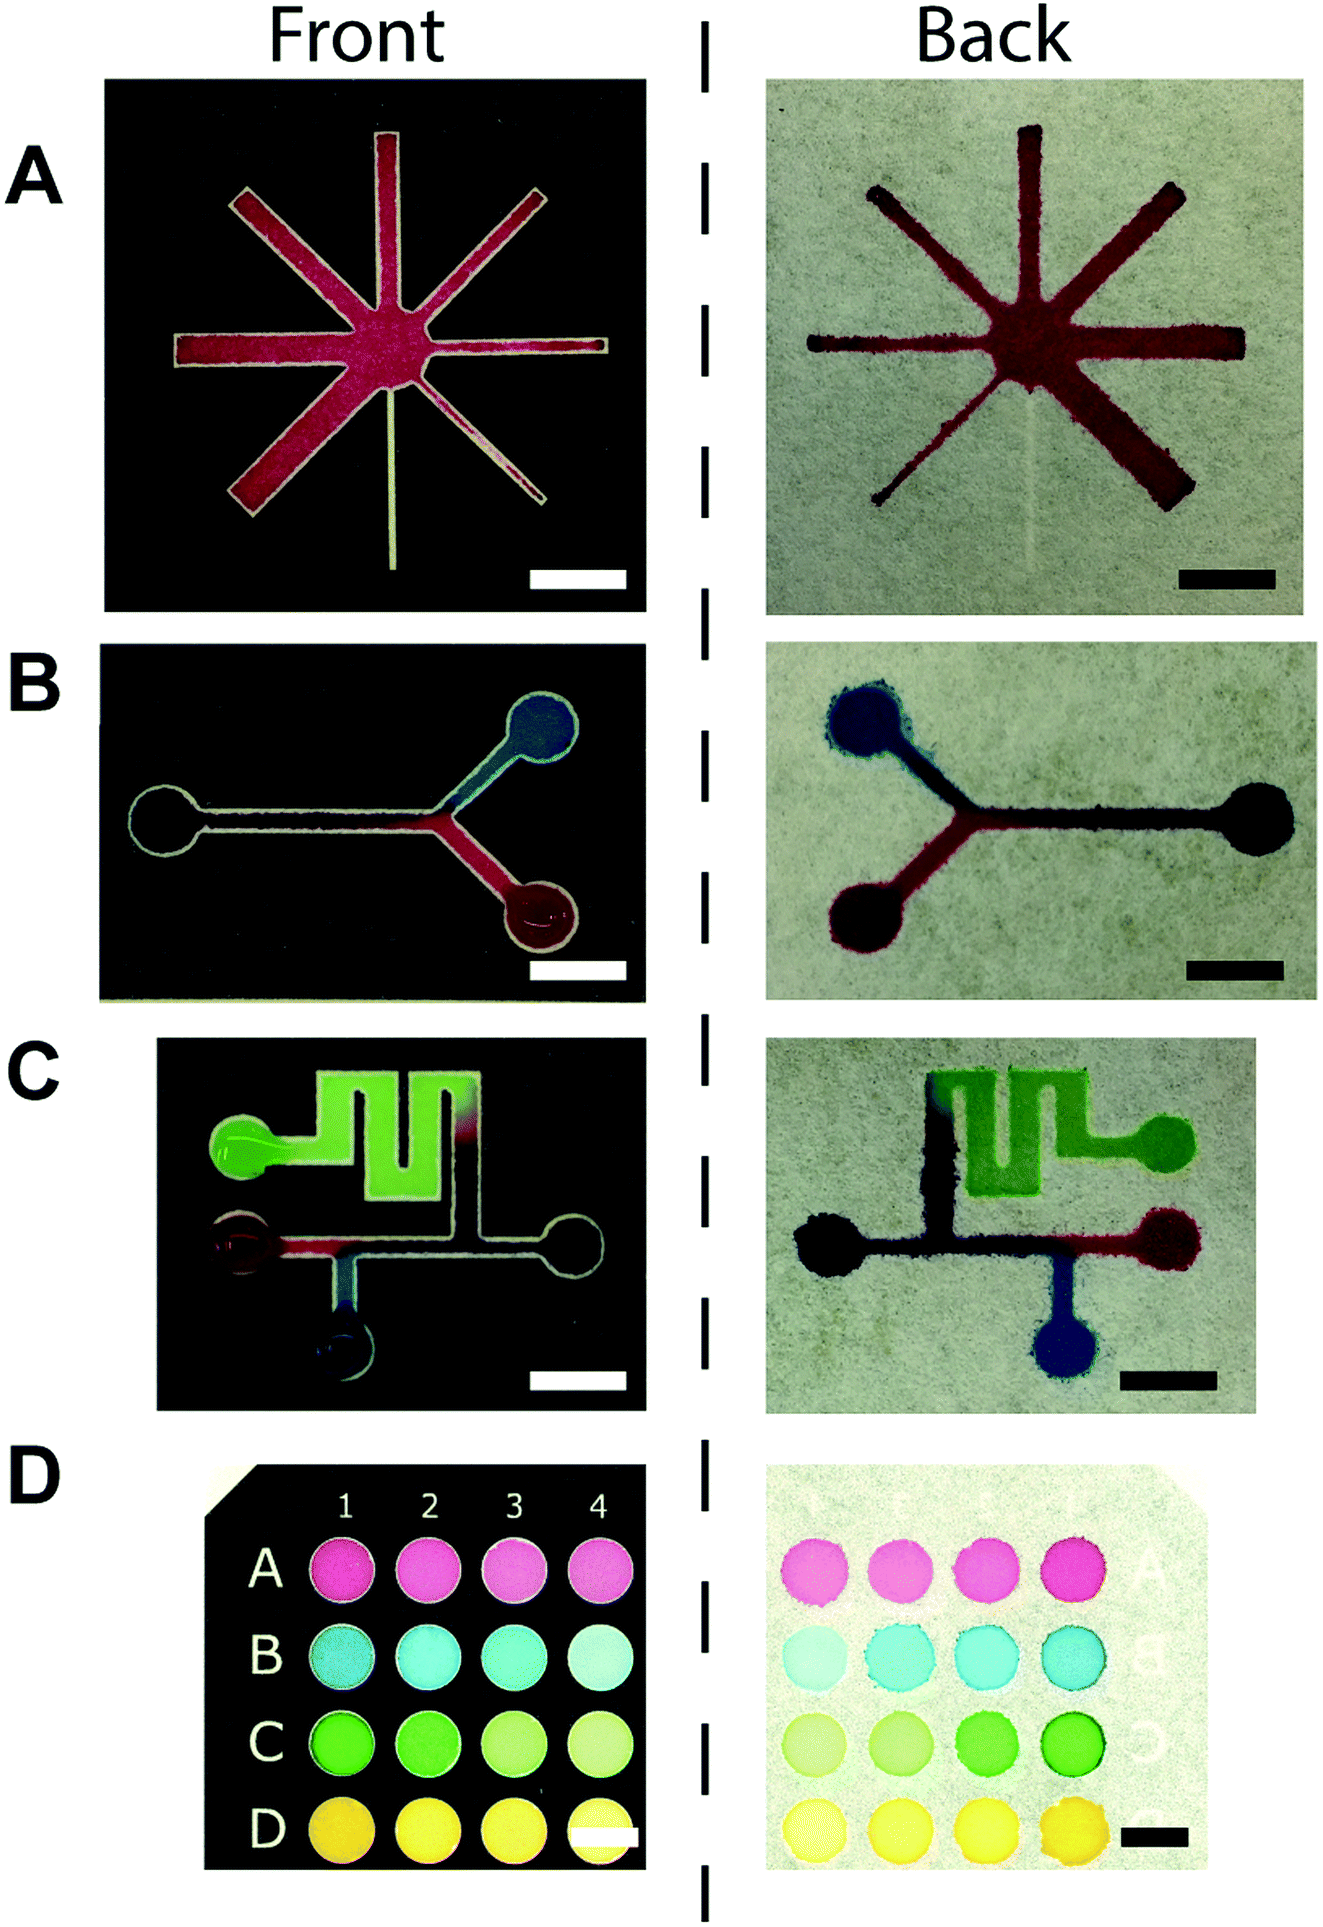 | ||
| Fig. 3 Examples of toner-based μPAD patterned on the filter paper. (A) A well with eight channels. (B) A Y-shaped channel. (C) A channel with multiple regions for the reagents. (D) A 16-well paper plate. Scale bars = 10 mm. | ||
Colorimetric assays
We performed colorimetric assays using the scanned RGB images of the 96-well PAD. To determine the signal to analyze, we measured the absorbance spectrum (400–700 nm) of each well using a plate reader. When we identified an obvious peak in the absorbance spectrum (such as Fig. S3, ESI†), we calculated the intensity of the color at the peak wavelength from the corresponding RGB values using the conversion equation.59 When there was no distinct peak in the measured absorbance spectrum, we observed the colors and the intensity of RGB channels manually; we chose a single color channel that gave the most substantial change in the intensity for the analysis.To demonstrate the use of the toner-based μPADs, we performed two representative colorimetric assays. First, we measured the concentration of glucose with Benedict's solution.60 Benedict's solution showed the color change from blue to orange due to the formation of copper(I) (Cu+) ions (Fig. 4A). Preliminary scanning suggested that there was no obvious peak in the absorbance spectrum of the 96-well PAD, and we chose the blue (B) channel in the RGB image to analyze the data because it gave more pronounced changes in the intensity than the red (R) and green (G) channels. At and above 10 mg mL−1 of glucose solution, the intensity of the B channel (in the RGB image) decreased as the concentration of glucose increased (Fig. 4B). The glucose concentrations of 0–1 mg mL−1 were not detected by Benedict's solution using our μPAD. The fabricated μPAD should be, nevertheless, applicable for the measurement of glucose present in physiological samples such as urine.61 Secondly, we performed a colorimetric assay of bovine serum albumin (BSA) with tetrabromophenol blue (TBPB). To perform the assay, we added 5 μL of TBPB to the 96-well paper plate and dried, followed by the addition of 5 μL of BSA. The binding of BSA to TBPB resulted in a color change from yellow to blue (Fig. 4C).62 Scanning with a plate reader suggested that there was an absorbance peak around 620 nm, and we used the conversion equation to identify the color intensity at 620 nm from the RGB images.59 Our colorimetric assay was not sensitive to the concentration of BSA below 200 μg mL−1 (or 3 μM) (Fig. 4D). This threshold is comparable to the clinically relevant protein concentration of 7.5 μM (or 500 μg mL−1) measured by commercial dipsticks that detects proteins at ≥250 μg mL−1.63 The detection limit of the fabricated μPAD would be applicable for the detection of proteins present in the urine sample in the condition such as proteinuria.63
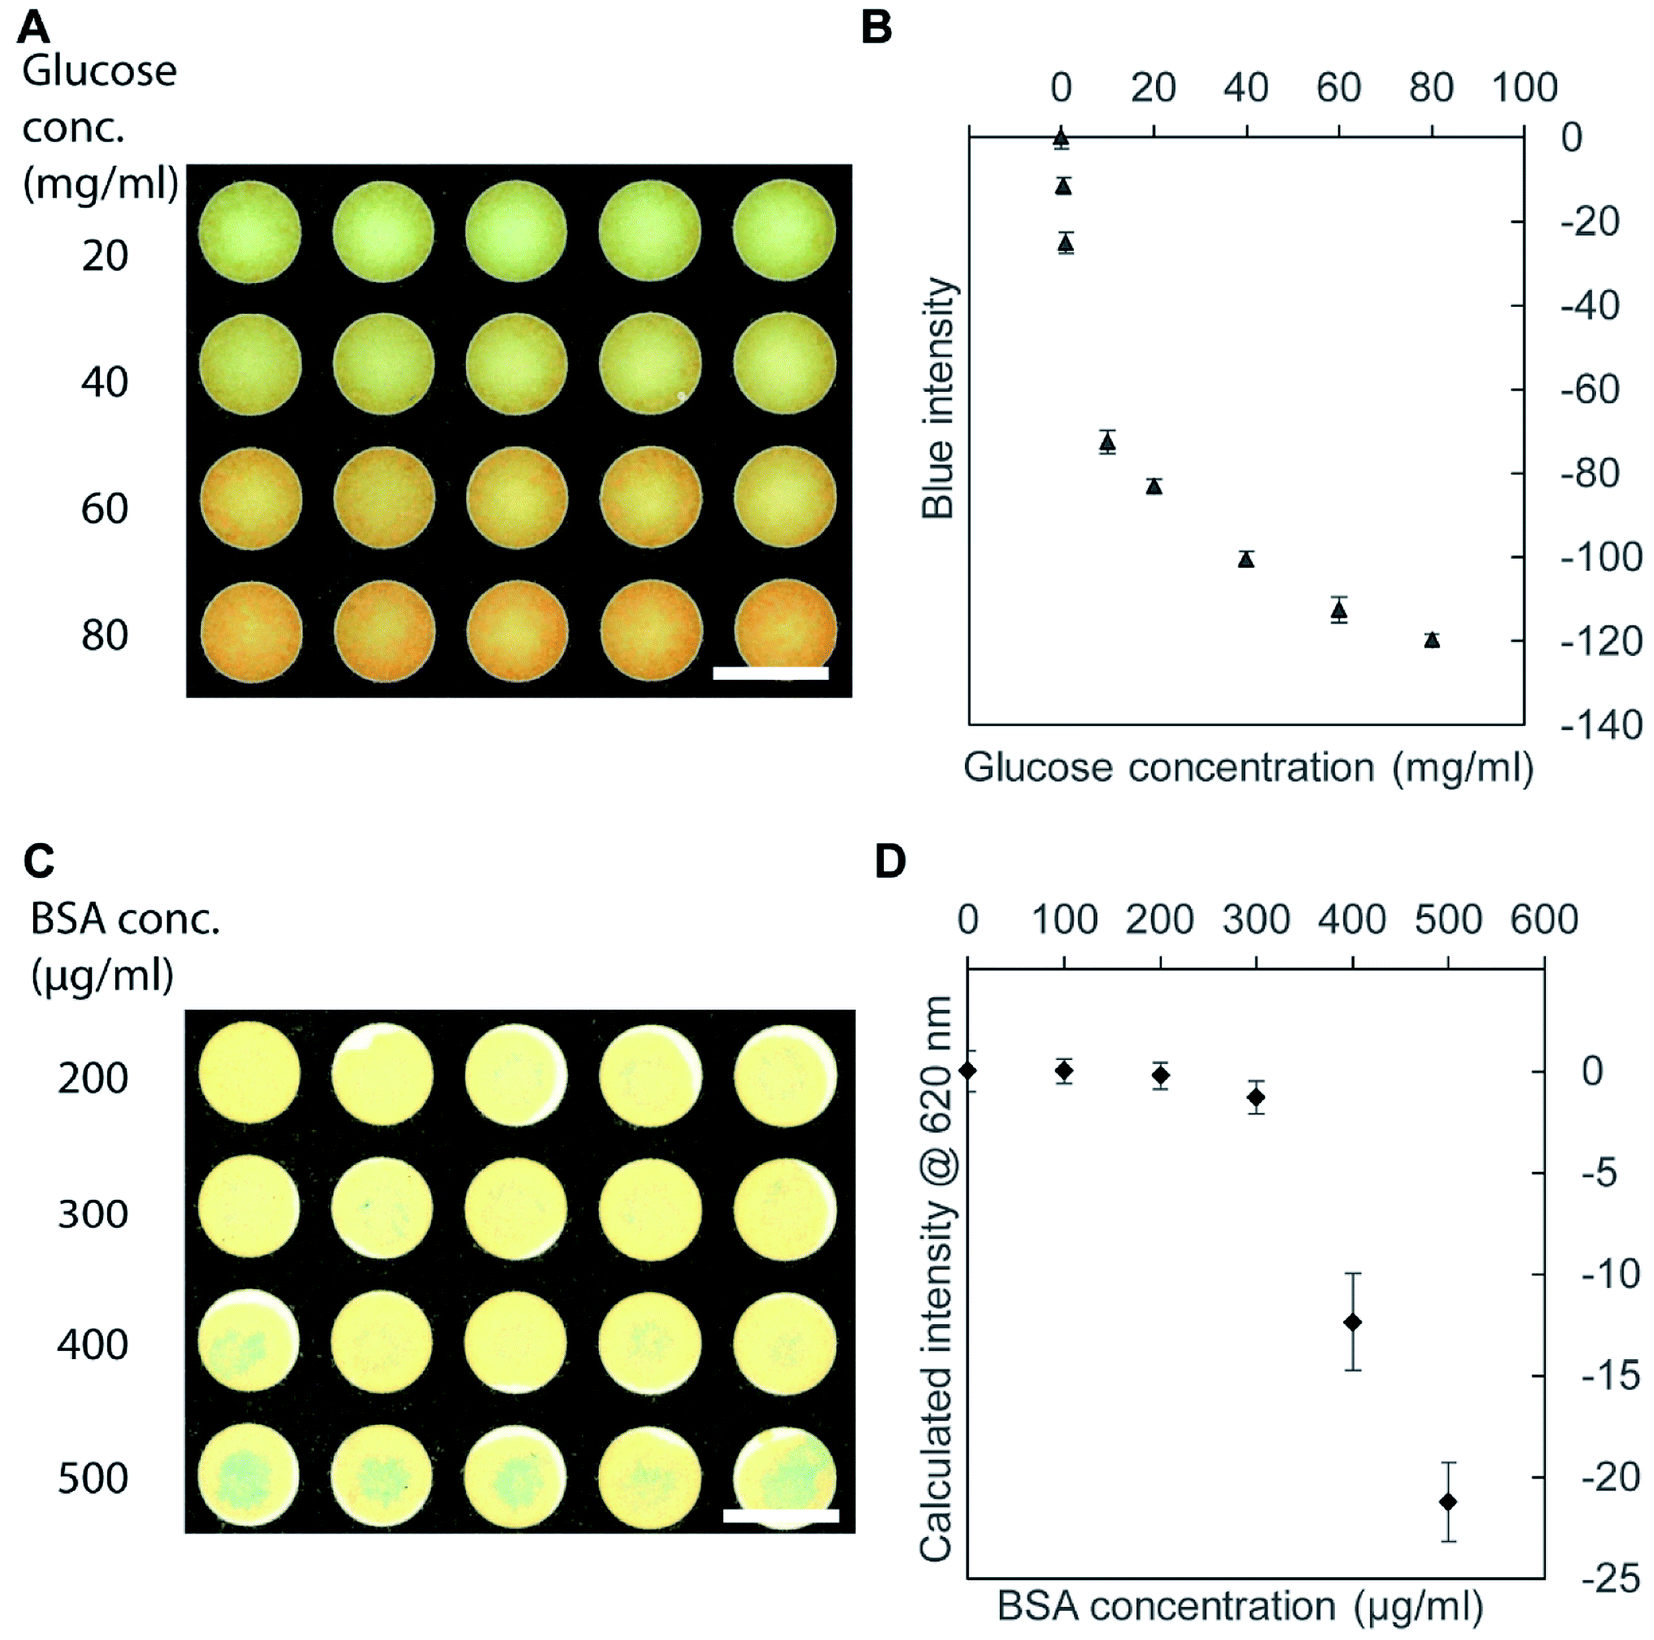 | ||
| Fig. 4 Colorimetric assay using the 96-well paper plate. (A) Samples of glucose (1.0–80.0 mg mL−1) showing the color change to orange with Benedict's solution on the 96-well paper plate. (B) A plot showing the blue intensity from the RGB image of the μPAD with respect to the concentration of glucose (n = 4). (C) Samples of BSA (100–500 μg mL−1) showing the color change due to the formation of blue tetrabromophenol blue (TBPB) complex. (D) A plot showing the calculated intensity at 620 nm estimated from the RGB image of the μPAD with respect to the concentration of BSA (n = 4). Scale bar = 10 mm. | ||
Pyrolysis of the filter paper and cleaning
Unlike wax printing, the reflow of the polymers required heating at 200 °C for 60 min for the particular toner we used. This duration of heating resulted in the pyrolysis of cellulose contained in the filter paper. It has been reported that the pyrolysis of cellulose results in the formation of aldehydes such as glyceraldehyde and hydroxy-acetaldehyde.64 Because aldehydes serve as a reducing agent, they would interfere with assays involving redox reactions. For example, a bicinchoninic acid (BCA) assay is commonly used to quantify the protein concentration in an aqueous sample. Proteins (such as cysteine, cystine, tryptophan, tyrosine) can reduce Cu2+ to Cu+, and two molecules of BCA chelate one Cu+ ion to form an intense purple complex.65 However, Cu2+ would be reduced to Cu+ by aldehydes present in the filter paper. Similarly, Benedict's test also depends on the reduction of Cu2+ to Cu+, which would be interrupted in the presence of aldehydes. To this end, the pyrolysis of the cellulose can interfere with colorimetric assays, and a reliable method to remove aldehydes from the heated filter paper would be necessary.To remove the aldehydes from the filter paper, we investigated various cleaning agents and solvents. The methods must be simple and low-cost, and it can be achieved using readily available materials. We tested readily available solvents such as ethanol and acetone to wash the μPAD; the treatment with ethanol and acetone immediately resulted in the dissolution of the hydrophobic barriers. Washing with D.I. water was not effective for the removal of the aldehydes, as apparent from the color change with the BCA assay (Fig. 5A). We selected a common lab bleach containing sodium hypochlorite (5.25% w/w) to wash the filter paper. In the manufacturing of office papers, chlorinated chemicals are used to treat the papers to remove lignin and enhance white color. Bleach contains sodium hypochlorite as the cleaning agent to whiten paper. In light of the availability and safety, the laboratory bleach would be a suitable material for this purpose. The bleach can be discarded to the sink after the use. Sodium hypochlorite acted as an oxidizing agent to oxidize the aldehydes effectively; the treatment with sodium hypochlorite also did not compromise the integrity of the hydrophobic barriers, which was experimentally confirmed from the containment of the aqueous samples within the well (Fig. 5A). To clean the filter paper, we soaked the paper in the bleach for 60 min without disturbance, such as ultrasonication of the bleach solution.
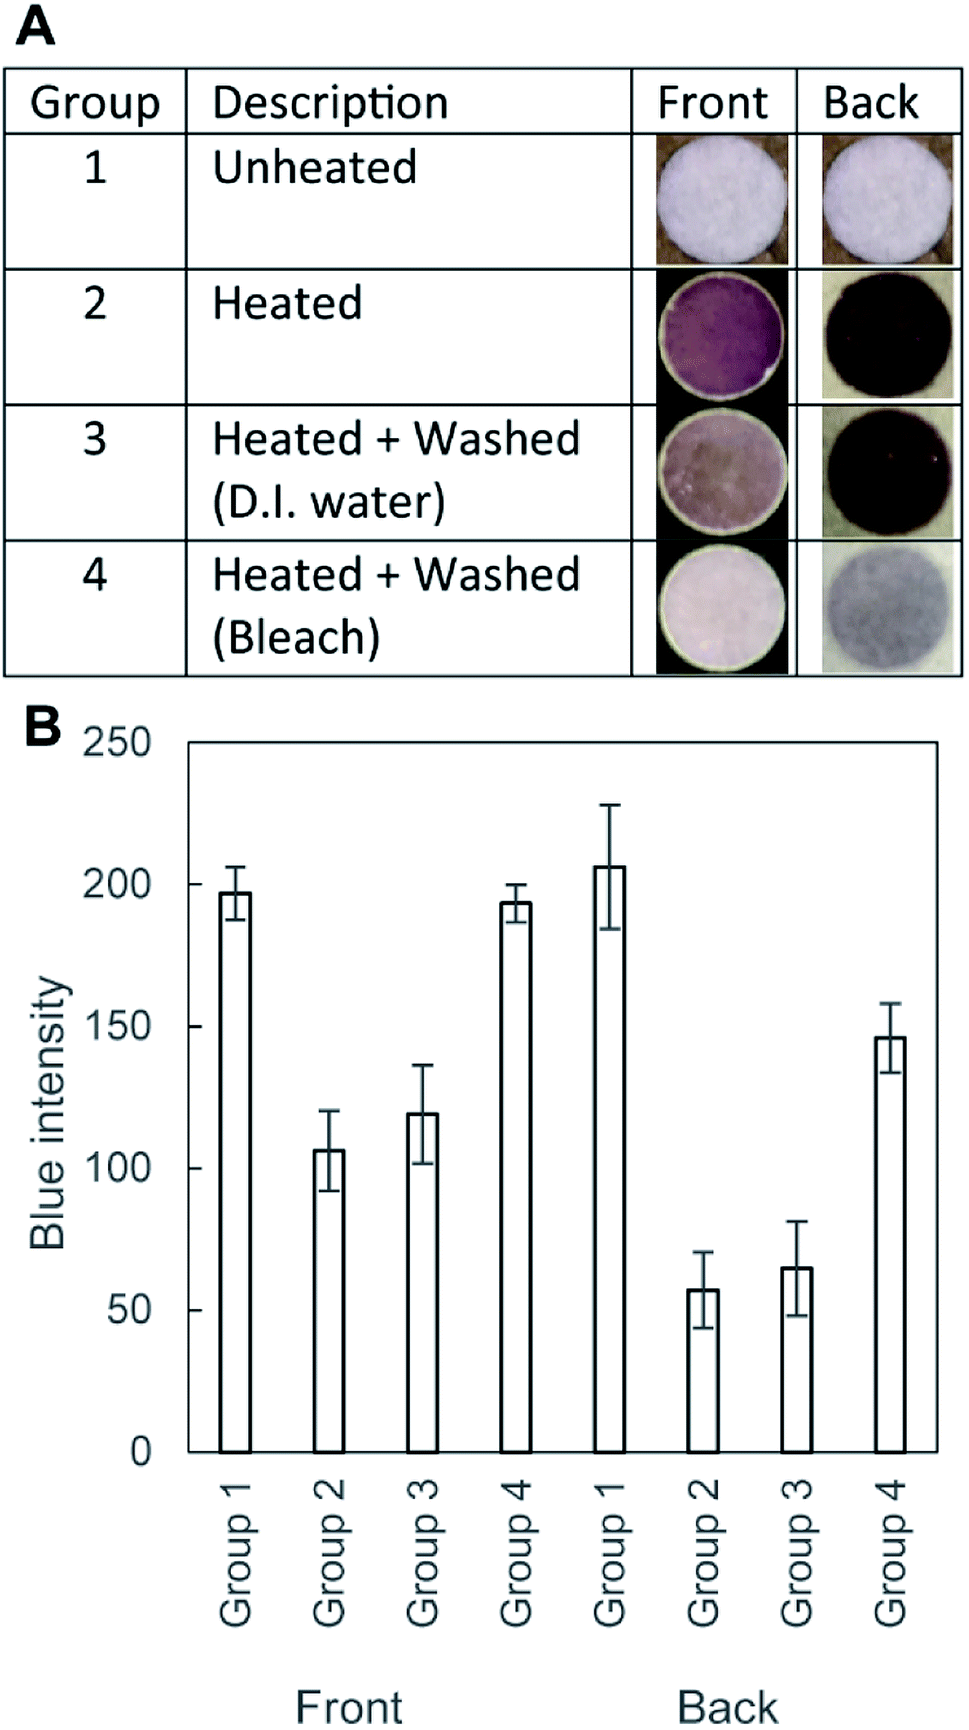 | ||
| Fig. 5 (A) Optical images of the wells of cellulose papers added with 10 μL of BCA assay and treated with D.I water (Group 3) and bleach (Group 4). Four groups of the cellulose samples were studied. Group 1: unheated pristine filter paper, Group 2: heated on a hot plate at 200 °C for 60 min, Group 3: heated and washed in D.I. water, and Group 4: heated and treated with bleach. Both the front side and the backside were shown for each group. (B) A graph showing the blue intensity of the wells. The lower blue intensity indicated the darker color of the well, suggesting the presence of the aldehydes in the well that produced the BCA complex via reduction of Cu2+ (n = 4). | ||
In order to show the effect of bleach in the removal of aldehydes from the filter paper, we performed the BCA assay. BCA was added to each well to determine the color change. If the reducing agents (i.e., aldehydes) were present in the well, the paper would form purple complexes. Fig. 5A shows four different groups of the filter paper tested the BCA assay reagents. Group 1 (unheated) remained white, suggesting the absence of any reducing agents before heating. Group 2 (heated and unwashed) should contain aldehydes due to pyrolysis, which was supported by the purple coloration. Group 3 (heated and washed with D.I. water) was comparable to Group 2, suggesting that the washing with D.I. water was not effective in removing the aldehydes. Group 4 (heated and washed with the bleach) showed the reduction of the color; the paper was soaked in the bleach solution for 60 min, following by the rinsing with D.I. water for 30 min. Fig. 5B summarized the results of the image analysis of the four groups of the samples. We analyzed the blue channel of the RGB images; all three channels (red, green, and blue) exhibited similar variations of the intensity. The lower blue intensity indicated the darker color of the well, suggesting the presence of the BCA complex. The graph indicated that heating resulted in the reduced blue intensity, and the intensity was not reverted by washing only with D.I. water. The blue intensity was reverted by the treatment with bleach. Crucially, the change of color was different between the front side and the back side of the filter paper. The back side was directly in contact with the hot plate during the heating, which presumably resulted in a higher degree of pyrolysis than the front side (indicated by the smaller value of the blue intensity). In contrast, the blue intensity of the μPAD washed with bleach (193 ± 6.6, Group 4) was comparable to that of the unheated cellulose paper (Group 1, 197 ± 9.2) at the front side of the μPAD. This observation suggested that the treatment with bleach would be effective in removing the aldehydes and enhance the capability to perform colorimetric assays at the front side of the μPAD.
To highlight the effect of washing, we carried out Benedict's test with three substrates: (1) unheated device, (2) heated device, and (3) heated and bleach-washed device (Fig. 6A). The average values of the intensity were comparable between the unheated device (i.e., pristine filter paper) and the heated and washed devices (Fig. 6B). The heated μPAD (without washing) exhibited extra coloration that lowered the blue intensity of the well. The two groups (unheated and heated and bleach-washed) exhibited nearly the same blue intensity. These experiments suggested that the common laboratory bleach was sufficient to revert the condition of the cellulose heated at 200 °C for 60 min. The method of washing was simple (i.e., soaking the patterned filter paper in the bleach for 60 min and in D.I. water for 30 min) and equipment-free. We note that the washing of the filter paper by bleach increased the duration of fabrication by 90 min in our protocol, with the total fabrication time of 150 min. The main objective of this paper was to highlight the fabrication of μPAD using a toner printer and to discuss the associated problem of pyrolysis. The duration of fabrication could be shortened with different types of toners (i.e., materials and colors), which require further investigation. We highlighted the importance of the treatment of the cellulose substrates when the fabrication required a long duration of heating at high temperatures, which might otherwise limit the applicability of the devices.
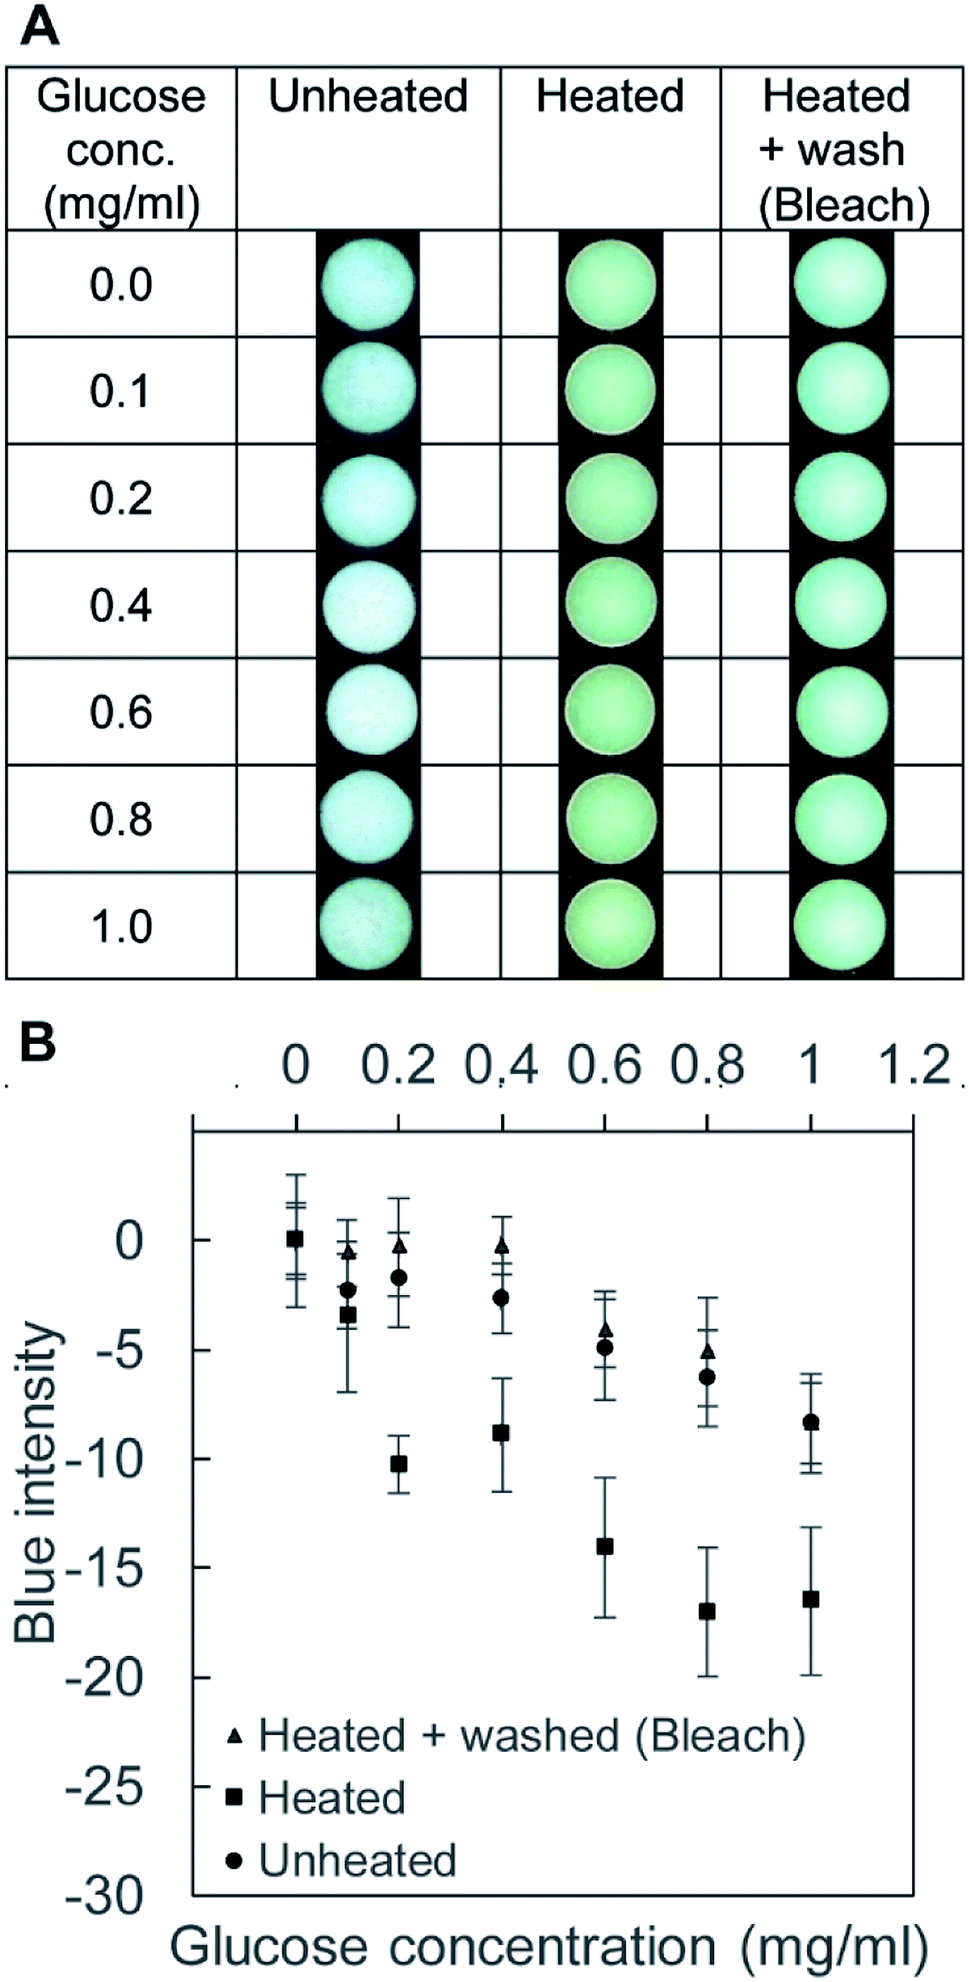 | ||
| Fig. 6 Benedict's test in toner-based μPAD. (A) The images of the paper wells in three conditions of the cellulose wells: (1) unheated (negative control for aldehydes), (2) heated, and (3) heated and washed with the bleach. (B) Graph of the blue intensities in the wells with respect the concentration of glucose. The coloration in the group of heated samples suggested the presence of the aldehydes from pyrolysis, which was effectively removed by washing the μPAD with the aqueous solution of the bleach (n = 4). | ||
Conclusion
In this work, we developed a method to fabricate μPAD using a toner laser printer. We confirmed that the polyester resin within the toner imparted hydrophobic patterns at 200 °C for 60 min and allowed the fabrication of μPAD with various designs. Thermal reflow of toner provided a platform to conduct colorimetric assays on 96-well paper plates. The devices were used to analyze the concentration of the glucose and BSA down to 1 mg mL−1 (5.6 mM) and 200 μg mL−1 (3 μM), respectively. Importantly, we discussed that the heating of the cellulose at high temperatures resulted in pyrolysis and formation of aldehydes, which would interfere with colorimetric assays involving redox reactions. The removal of aldehydes was effectively carried out by the washing with laboratory bleach containing sodium hypochlorite (5.25% w/w). Overall, we demonstrated a rapid prototyping method of μPADs using a widely available laser toner printer and addressed the associated problems of the pyrolysis of cellulose. With the discontinuation of wax printers, such a fabrication method shall benefit the research community requiring μPAD.Experimental section
Fabrication of μPAD using a toner printer
Patterns of the hydrophobic channels with a toner (black features) on a filter paper (white background) were drawn using computer-aided design (CAD) software (Adobe Illustrator, Adobe Inc., California, USA). The patterns were printed once on the Whatman filter paper (Grade 1, United Scientific Equipment, Singapore) using the Canon multifunction laser printer (IR ADV-C5255; Canon, Tokyo, Japan) set to the default parameters in monochrome for printing. After printing, the filter papers were heated on a hotplate (Thermo Scientific, Massachusetts, USA) at 200 °C for 60 min. The toner reflowed and spread through the thickness of the paper. The patterned paper was removed from the hotplate and allowed to cool at room temperature. Cross-sectional images of the filter paper were taken using Leica M125 stereomicroscope (Leica Microsystems, Wetzlar, Germany) and Basler acA2040 CMOS sensor (Basler AG, Ahrensburg, Germany) under 5.0× magnification.Contact angle measurements
Contact angle measurements were conducted with Kino Optical Contact Angle & Interface Tension Meter (USA KINO Industry Co., Ltd, Boston, Massachusetts, USA). Toner was printed on the filter paper and then heated on the hotplate at 200 °C for 60 min. The entire filter paper was cleaned as described in the section of Cleaning of the filter paper. A droplet of D.I. water (2 μL) was placed on the filter paper patterned with toner. The contact angle was analyzed in CAST3 US KINO software using the sessile drop method (n = 4).Reagents and instruments
Colorimetric data from the images were scanned with the Canon multifunction laser printer (IR ADV-C5255; Canon, Tokyo, Japan). The reagents in 96-well paper plates were heated with VWR natural convection oven model VWRU414005-115 (VWR, Singapore) for the glucose assay. Tetrabromophenol blue (TBPB), Benedict's solution and D-glucose (Sigma Aldrich, Singapore, Singapore), bicinchoninic acid kit (Thermo Scientific, Singapore, Singapore) and bovine serum albumin (BSA) (Goldbio, Singapore, Singapore) were of analytical grade and used as purchased. Glucose and BSA solutions were prepared using 18.2 MΩ cm ultrapure water (Milli-Q, Millipore, Billerica, MA, USA).Glucose assay (Benedict's test)
A 96-well paper plate was fabricated by printing a toner on a filter paper, followed by heating on a hotplate. The 96-well paper was designed with the standard dimension and a diameter of 6.9 mm for each well. Benedict's solution was used to determine the glucose concentration of the sample. 10 μL of Benedict's solution was added to each well and air-dried for 10 min. Subsequently, 10 μL of the glucose sample was added to each well. The control wells were added with D.I. water that did not contain glucose. The 96-well paper plates were heated in an oven for 30 min at 90 °C. The 96-well plate was scanned with Sunrise microplate reader (Tecan, Switzerland) under the default setting to identify the absorbance in the visible light range (400–700 nm). The dried paper wells were then scanned with Canon multifunction printer in full color at the resolution of 600 × 600 dpi. RGB intensities from the front of the circular wells were and analyzed with ImageJ (National Institutes of Health, USA), and the blue intensity was analyzed with the background subtraction. The same assay was also conducted with the 96-well papers treated with the bleach solution.Protein (BSA) assay
Citrate buffer solution of 250 mM (Sigma Aldrich, Singapore, Singapore) was adjusted by adding dropwise 1.0 M of hydrochloric acid (HCl) (Sigma Aldrich, Singapore, Singapore) to obtain the solution with pH = 1.8. TBPB of 3.3 mM solution (0.3 mL) was prepared in 95% ethanol over the citrate buffer solution. 1 μL of TBPB and 1 μL of citrate acid buffer were added to each well, air-dried, and 5 μL of BSA solution was added and dried at room temperature. The control wells were added with D.I. that did not contain BSA. The 96-well plate was scanned with Sunrise microplate reader (Tecan, Switzerland) under the default setting to identify the absorbance in the visible light range (400–700 nm). The dried 96-well papers were scanned with Canon multifunction printer in full color, 600 × 600 dpi. The intensities of each color channel at the front side of the circular wells were analyzed with background subtraction with Image J (National Institutes of Health, USA). The formation of TBPB complex resulted in a blue color with a peak absorbance at 620 nm.59 The intensity of the color at 620 nm was estimated using eqn (1).| Calculated intensity at 620 nm = 1.0R + 0.3843G | (1) |
Cleaning of the filter paper
Toner was printed on pristine filter papers patterned with 96 wells. Individual circular wells were cut out and served as a negative control for filter paper without aldehydes (Group 1). The printed 96-well paper plates were then heated to 200 °C for 60 min as a positive control for filter paper with aldehydes (Group 2). 96-well paper plate from Group 2 was soaked in D.I. water for 60 min and dried in the oven at 60 °C (Group 3). Another 96-well paper plate from Group 2 was soaked in bleach at 25 °C for 60 min, rinsed with D.I. water for 30 min to remove the bleach and dried in the oven at 60 °C (Group 4). 10 μL of BCA solution (Pierce™ BCA Protein Assay Kit, Thermo Fisher Scientific, Singapore) was added to each well on the 96-well paper plates from each group, and air-dried for 10 min after the color had stabilized. Colorimetric data from the images were scanned with the Canon multifunction laser printer. The color intensities of the RGB images at the front and back sides of the circular wells were analyzed with Image J, and the blue intensity was plotted.Conflicts of interest
There are no conflicts to declare.Acknowledgements
J. S. N. acknowledges the SUTD Fellowship awarded by Ministry of Education (MOE). M. H. acknowledges the research grant from SUTD-MIT International Design Centre (IDC) (IDG11900101), and Digital Manufacturing and Design (DManD) Centre (RGDM1620503).References
- A. W. Martinez, S. T. Phillips, M. J. Butte and G. M. Whitesides, Angew. Chem., Int. Ed., 2007, 46, 1318–1320 CrossRef CAS PubMed.
- J. C. Jokerst, J. A. Adkins, B. Bisha, M. M. Mentele, L. D. Goodridge and C. S. Henry, Anal. Chem., 2012, 84, 2900–2907 CrossRef CAS PubMed.
- K. Tenda, R. Ota, K. Yamada, T. G. Henares, K. Suzuki and D. Citterio, Micromachines, 2016, 7, 1–2 CrossRef PubMed.
- S. Atabakhsh and S. Jafarabadi Ashtiani, Microfluid. Nanofluidics, 2019, 23, 69 CrossRef.
- J. Sitanurak, N. Fukana, T. Wongpakdee, Y. Thepchuay, N. Ratanawimarnwong, T. Amornsakchai and D. Nacapricha, Talanta, 2019, 205, 120113 CrossRef CAS PubMed.
- Q. Wu, J. He, H. Meng, Y. Wang, Y. Zhang, H. Li and L. Feng, Talanta, 2019, 204, 518–524 CrossRef CAS PubMed.
- J. Aksorn and S. Teepoo, Talanta, 2020, 207, 120302 CrossRef CAS PubMed.
- E. Carrilho, A. W. Martinez and G. M. Whitesides, Anal. Chem., 2009, 81, 7091–7095 CrossRef CAS PubMed.
- M. Santhiago and L. T. Kubota, Sens. Actuators, B, 2013, 177, 224–230 CrossRef CAS.
- D. Sechi, B. Greer, J. Johnson and N. Hashemi, Anal. Chem., 2013, 85, 10733–10737 CrossRef CAS PubMed.
- M. Santhiago, C. S. Henry and L. T. Kubota, Electrochim. Acta, 2014, 130, 771–777 CrossRef CAS.
- X. Li and X. Y. Liu, Microfluid. Nanofluid., 2014, 16, 819–827 CrossRef CAS.
- H. Wang, Y. J. Li, J. F. Wei, J. R. Xu, Y. H. Wang and G. X. Zheng, Anal. Bioanal. Chem., 2014, 406, 2799–2807 CrossRef CAS PubMed.
- T. G. Silva, W. R. de Araujo, R. A. A. Muñoz, E. M. Richter, M. H. P. Santana, W. K. T. Coltro and T. R. L. C. Paixão, Anal. Chem., 2016, 88, 5145–5151 CrossRef CAS PubMed.
- J. Park and J.-K. Park, Sens. Actuators, B, 2017, 246, 1049–1055 CrossRef CAS.
- S. Cinti, C. Minotti, D. Moscone, G. Palleschi and F. Arduini, Biosens. Bioelectron., 2017, 93, 46–51 CrossRef CAS PubMed.
- P. Preechakasedkit, W. Siangproh, N. Khongchareonporn, N. Ngamrojanavanich and O. Chailapakul, Biosens. Bioelectron., 2018, 102, 27–32 CrossRef CAS PubMed.
- Y. Panraksa, W. Siangproh, T. Khampieng, O. Chailapakul and A. Apilux, Talanta, 2018, 178, 1017–1023 CrossRef CAS PubMed.
- M. Ueland, L. Blanes, R. V. Taudte, B. H. Stuart, N. Cole, P. Willis, C. Roux and P. Doble, J. Chromatogr. A, 2016, 1436, 28–33 CrossRef CAS PubMed.
- A. N. Ramdzan, M. I. G. S. Almeida, M. J. McCullough and S. D. Kolev, Anal. Chim. Acta, 2016, 919, 47–54 CrossRef CAS PubMed.
- V. Hamedpour, R. Leardi, K. Suzuki and D. Citterio, Analyst, 2018, 143, 2102–2108 RSC.
- K. Abe, K. Suzuki and D. Citterio, Anal. Chem., 2008, 80, 6928–6934 CrossRef CAS PubMed.
- A. Apilux, Y. Ukita, M. Chikae, O. Chailapakul and Y. Takamura, Lab Chip, 2013, 13, 126–135 RSC.
- X. Li, J. Tian, G. Garnier and W. Shen, Colloids Surf., B, 2010, 76, 564–570 CrossRef CAS PubMed.
- W. Dungchai, O. Chailapakul and C. S. Henry, Analyst, 2011, 136, 77–82 RSC.
- Y. Sameenoi, P. N. Nongkai, S. Nouanthavong, C. S. Henry and D. Nacapricha, Analyst, 2014, 139, 6580–6588 RSC.
- N. Liu, J. Xu, H.-J. An, D.-T. Phan, M. Hashimoto and W. S. Lew, J. Micromech. Microeng., 2017, 27, 104001 CrossRef.
- S. Nouanthavong, D. Nacapricha, C. S. Henry and Y. Sameenoi, Analyst, 2016, 141, 1837–1846 RSC.
- W. Dungchai, O. Chailapakul and C. S. Henry, Anal. Chem., 2009, 81, 5821–5826 CrossRef CAS PubMed.
- M. F. Mora, C. D. Garcia, F. Schaumburg, P. A. Kler, C. L. A. Berli, M. Hashimoto and E. Carrilho, Anal. Chem., 2019, 91, 8298–8303 CrossRef CAS PubMed.
- A. W. Martinez, S. T. Phillips, B. J. Wiley, M. Gupta and G. M. Whitesides, Lab Chip, 2008, 8, 2146–2150 RSC.
- X. Chen, J. Chen, F. Wang, X. Xiang, M. Luo, X. Ji and Z. He, Biosens. Bioelectron., 2012, 35, 363–368 CrossRef CAS PubMed.
- H. Asano and Y. Shiraishi, Anal. Chim. Acta, 2015, 883, 55–60 CrossRef CAS PubMed.
- L. Wang, W. Chen, D. Xu, B. S. Shim, Y. Zhu, F. Sun, L. Liu, C. Peng, Z. Jin, C. Xu and N. A. Kotov, Nano Lett., 2009, 9, 4147–4152 CrossRef CAS PubMed.
- A. Apilux, W. Dungchai, W. Siangproh, N. Praphairaksit, C. S. Henry and O. Chailapakul, Anal. Chem., 2010, 82, 1727–1732 CrossRef CAS PubMed.
- Y. Lin, D. Gritsenko, S. Feng, Y. C. Teh, X. Lu and J. Xu, Biosens. Bioelectron., 2016, 83, 256–266 CrossRef CAS PubMed.
- D. Lin, B. Li, J. Qi, X. Ji, S. Yang, W. Wang and L. Chen, Sens. Actuators, B, 2020, 303, 127213 CrossRef CAS.
- T. M. G. Cardoso, F. R. de Souza, P. T. Garcia, D. Rabelo, C. S. Henry and W. K. T. Coltro, Anal. Chim. Acta, 2017, 974, 63–68 CrossRef CAS PubMed.
- T. Nurak, N. Praphairaksit and O. Chailapakul, Talanta, 2013, 114, 291–296 CrossRef CAS PubMed.
- J. Zhou, B. Li, A. Qi, Y. Shi, J. Qi, H. Xu and L. Chen, Sens. Actuators, B, 2020, 305, 127462 CrossRef.
- X. Sun, B. Li, A. Qi, C. Tian, J. Han, Y. Shi, B. Lin and L. Chen, Talanta, 2018, 178, 426–431 CrossRef CAS PubMed.
- J. Qi, B. Li, X. Wang, Z. Zhang, Z. Wang, J. Han and L. Chen, Sens. Actuators, B, 2017, 251, 224–233 CrossRef CAS.
- B. Li, Z. Zhang, J. Qi, N. Zhou, S. Qin, J. Choo and L. Chen, ACS Sens., 2017, 2, 243–250 CrossRef CAS PubMed.
- J. Han, A. Qi, J. Zhou, G. Wang, B. Li and L. Chen, ACS Sens., 2018, 3, 1789–1794 CrossRef CAS PubMed.
- J. Qi, B. Li, X. Wang, L. Fu, L. Luo and L. Chen, Anal. Chem., 2018, 90, 11827–11834 CrossRef CAS PubMed.
- S. M. Bidoki, D. M. Lewis, M. Clark, A. Vakorov, P. A. Millner and D. McGorman, J. Micromech. Microeng., 2007, 17, 967–974 CrossRef CAS.
- J. Wang, R. N. Monton, X. Zhang, C. D. M. Filipe, R. Pelton, M. R. N. Monton, X. Zhang, C. D. M. Filipe, R. Pelton and J. D. Brennan, Lab Chip, 2014, 14, 691–695 RSC.
- R. Ghosh, S. Gopalakrishnan, R. Savitha, T. Renganathan and S. Pushpavanam, Sci. Rep., 2019, 9, 7896 CrossRef PubMed.
- R. L. Williams, Forensic Sci. Int., 1983, 22, 85–95 CrossRef CAS.
- S. Kiatkamjornwong and P. Pomsanam, J. Appl. Polym. Sci., 2003, 89, 238–248 CrossRef CAS.
- A. Tan, K. Rodgers, J. P. Murrihy, C. O'Mathuna and J. D. Glennon, Lab Chip, 2001, 1, 7–9 RSC.
- G. R. Duarte, W. K. Coltro, J. C. Borba, C. W. Price, J. P. Landers and E. Carrilho, Analyst, 2012, 137, 2692–2698 RSC.
- W. K. Coltro, J. A. da Silva and E. Carrilho, Electrophoresis, 2008, 29, 2260–2265 CrossRef CAS PubMed.
- C. Lucio do Lago, H. D. Torres da Silva, C. A. Neves, J. G. Alves Brito-Neto and J. A. Fracassi da Silva, Anal. Chem., 2003, 75, 3853–3858 CrossRef PubMed.
- A. L. Liu, F. Y. He, Y. L. Hu and X. H. Xia, Talanta, 2006, 68, 1303–1308 CrossRef CAS PubMed.
- C. L. do Lago, C. A. Neves, D. Pereira de Jesus, H. D. da Silva, J. G. Brito-Neto and J. A. Fracassi da Silva, Electrophoresis, 2004, 25, 3825–3831 CrossRef CAS PubMed.
- N. Bao, Q. Zhang, J.-J. Xu and H.-Y. Chen, J. Chromatogr. A, 2005, 1089, 270–275 CrossRef CAS PubMed.
- A. Fogden and T. Pettersson, J. Imaging Sci. Technol., 2006, 50(2), 202–215 CrossRef.
- D. Bruton, Color Science, http://www.physics.sfasu.edu/astro/color/spectra.html Search PubMed.
- S. R. Benedict, J. Biol. Chem., 1909, 5, 485–487 CAS.
- E. O. S. R. Benedict, J. Biol. Chem., 1921, 48, 51 Search PubMed.
- Y.-j. Wei, K.-a. Li and S.-y. Tong, Talanta, 1996, 43, 1–10 CrossRef CAS PubMed.
- M. eSasaki, M. J. Pugia, D. R. Parker, K. Kuromoto, I. Furukawa and I. Konishi, J. Clin. Lab. Anal., 1999, 13, 246–250 CrossRef.
- Y.-c. Lin, J. Cho, G. A. Tompsett, P. R. Westmoreland and G. W. Huber, J. Phys. Chem., 2009, 113, 20097–20107 CAS.
- P. K. Smith, R. I. Krohn, G. T. Hermanson, A. K. Mallia, F. H. Gartner, M. D. Provenzano, E. K. Fujimoto, N. M. Goeke, B. J. Olson and D. C. Klenk, Anal. Biochem., 1985, 150, 76–85 CrossRef CAS PubMed.
Footnote |
| † Electronic supplementary information (ESI) available. See DOI: 10.1039/d0ra04301j |
| This journal is © The Royal Society of Chemistry 2020 |