 Open Access Article
Synthesis of magnetic core–shell Fe3O4@PDA@Cu-MOFs composites for enrichment of microcystin-LR by MALDI-TOF MS analysis†
Zhijian Li ab,
Congcong Gonga,
Panpan Huoa,
Chunhui Deng
 *c and
Shouzhi Pu*a
aJiangxi Key Laboratory of Organic Chemistry, Jiangxi Science and Technology Normal University, Nanchang 330013, PR China. E-mail: lizhijianhdd@163.com; pushouzhi@tsinghua.org.cn
bShanghai Key Laboratory of Atmospheric Particle Pollution and Prevention, Department of Environmental Science and Engineering, Fudan University, Shanghai 200433, China
cFudan University, Shanghai 200438, China. E-mail: chdeng@fudan.edu.cn
First published on 5th August 2020
Abstract
Microcystin-LR (MC-LR) is a toxin released from cyanobacteria in eutrophicated water. MC-LR is the most abundant and the most toxic among microcystins. In this work, core–shell structured copper-based magnetic metal–organic framework (Fe3O4@PDA@Cu-MOFs) composites were synthesized via a solvothermal reaction and a sol–gel method. The Fe3O4@PDA@Cu-MOFs composites showed ultra-high surface area, strong magnetic response and outstanding hydrophilicity. The Fe3O4@PDA@Cu-MOFs composites combined with matrix-assisted laser desorption/ionisation time-of-flight mass spectrometry (MALDI-TOF-MS) were used to analyse the content of MC-LR in real water samples. Under the optimised conditions, our proposed method exhibited good linearity within a concentration range of 0.05–4 μg L−1 and good detection even at low limits (0.015 μg L−1). The method was also successfully applied to analyse traces of MC-LR with quantitative recoveries for the real water samples in the range from 98.67% to 106.15%. Furthermore, it was characterized by high sensitivity, short operation time, being environmental friendly and having the ability to analyse other pollutants in the environment.
1 Introduction
In recent years, because of climate change and the increase of industrial and agricultural activities, environmental problems such as eutrophication of water bodies and cyanobacteria blooms have been causes for concern in water environments.1–3 For example, since the 1980's, cyanobacterial blooms have frequently occurred in China, and they have affected the quality of drinking water used by people.4–6 Additionally, they can produce several classes of toxins such as nodularin and microcystins.7 Among the microcystins group, microcystin-LR (MC-LR) is one of the most toxic and commonly present toxins.8,9 MC-LR can cause various diseases including skin allergies, acute gastroenteritis, diarrhoea, vomiting, pulmonary oedema and damage to the liver.10 The World Health Organization (WHO) has assigned the tolerance limit concentration of 1 μg L−1 for MC-LR in drinking water.To ensure water quality, several methods and techniques have been applied for MC-LR detection in water. Some of them are colorimetric aptamer assay,11–13 high-performance liquid chromatography (HPLC),14 enzyme-linked immunosorbent assay,15,16 fluorescence biosensor immunoassay,17,18 electrochemical.19–21 Although these methods can detect exceedingly low levels of MC-LR, they always require harmful solvents and time-consuming, skilled and complex operating procedures. For example, HPLC is more precise than the other methods, but they require expensive equipment, operation complexity and long analysis time. Recently, matrix-assisted laser desorption/ionisation time-of-flight mass spectrometry (MALDI-TOF MS) has been widely applied for the detection and analysis of various compounds such as proteins,22,23 peptides,22,24 and small molecules25,26 because it is a rapid, simple and sensitive technique. However, the detection limit of MALDI-TOF MS is high and this makes it unsuitable as per the WHO advisory level for drinking water.27 Hence, a simple, rapid and efficient method for enriching MC-LR in drinking water by MALDI-TOF MS analysis is developed.
A variety of functionalised nanomaterials with high surface area and inner pores such as mesoporous carbon,28 graphene19 and mesoporous silica29 have been applied to the enrichment of MC-LR in water samples and for environment analysis. In the meantime, metal–organic frameworks (MOFs) have been developed rapidly and attracted specific interests in separation of sample due to their outstand property. MOFs are a class of hybrid inorganic–organic porous crystalline materials formed by combining metal ions and organic ligands. They have attracted considerable attention because of their ultra-high surface areas, mesoporous structures, aromatic organic ligands and functional tenability. Thus, MOFs have been widely applied in various fields including gas storage and separation, drug delivery, catalysis, gas sensors, and adsorption and chromatographic techniques.30,31
Herein in this work, we designed and synthesized Fe3O4@PDA@Cu-MOFs by modifications step by step. Fe3O4 was employed to fast separation. Poly-dopamine (PDA) not only acted as the linker between Cu-MOFs and Fe3O4 but also increased the hydrophilicity. Cu-MOFs was constructed via coordination of copper ion and 1,3,5-benzenetricarboxylic acid. Cu-MOFs were linked to the surface of PDA by self-assembly. On the basis of boric Cu2+ specific affinity for carboxyl and amino groups, Fe3O4@PDA@Cu-MOFs was used as a substrate for enrichment of MC-LR and directly for MALDI-TOF MS analysis.
2 Experimental section
2.1. Chemicals and materials
Iron(III) chloride hexahydrate (Fe3Cl·6H2O), dopamine hydrochloride, 1,3,5-benzenetricarboxylic acid and N,N-dimethyformamide (DMF) were obtained from Sigma-Aldrich (St. Louis, MO, USA). Copper(II) acetate (Cu(Ac)2), ethanol, sodium acetate (NaAc) and glycol were purchased from Sinopharm Chemical Reagent Co., Ltd (Shanghai, China). Microcystin-LR, tris(hydroxymethyl)aminomethane (Tris) and α-cyano-4-hydroxycinnamic acid (CHCA) were purchased from Sigma-Aldrich (St. Louis, MO, USA). Trifluoroacetic acid (TFA) and acetonitrile (ACN) were purchased from Merck (Darmstadt, Germany). Distilled water was purified by a Milli-Q system (Milford, MA, USA). Other chemicals were of analytical grade and were commercially available.2.2. Synthesis of Fe3O4@PDA@Cu-MOFs microspheres
Fe3O4 microspheres were synthesised by a solvothermal reaction according to previous methods. Briefly, 0.675 g of FeCl3·6H2O and 1.8 g of NaAc were dissolved in 75 mL of ethylene glycol and stirred for 30 min at room temperature to obtain a homogeneous mixture. Subsequently, the mixture was shifted to a 200 mL Teflon-lined stainless steel autoclave and hydrothermally treated at 200 °C for 16 h. After cooling to room temperature, the obtained magnetic particles were collected by a magnetic field and rinsed several times with deionised water and ethanol. The final products were dried in a vacuum.Then, magnetic core–shell Fe3O4@PDA particles were synthesized accordingly to a previously reported procedure. First, 0.1 g of Fe3O4 particles was dispersed in a mixture containing 40 mL of H2O and 40 mL of ethanol. The mixed solution was sonicated for 10 min. Subsequently, 0.05 g of Tris and 0.32 g of dopamine hydrochloride were added to the mixed solution, and the mixture was stirred for 16 h at room temperature. Then, the Fe3O4@PDA particles were collected using a magnet and rinsed several times with deionised water and ethanol. The obtained products were dried in vacuum at 50 °C for 12 h.
To prepare Fe3O4@PDA@Cu-MOFs, 0.075 g of Fe3O4@PDA particles were dispersed in 40 mL of DMF and sonicated for 10 min followed by an addition of 0.01 g of Cu(Ac)2·H2O and 0.12 g of 1,3,5-benzenetricarboxylic acid. The mixture was heated at 70 °C for 45 min. Finally, the Fe3O4@PDA@Cu-MOFs particles were collected by a magnet, washed thrice with ethanol and then dried in a vacuum for 12 h at 50 °C.
2.3. Characterisations and measurements
Transmission electron microscopy (TEM) was applied to characterise the morphology using a JEOL 2011 microscope (JEOL, Japan) at 200 kV. Scanning electronic microscopy (SEM) was performed using a Philips XL30 electron microscope (Netherlands) at 20 kV. Fourier transform infrared (FT-IR) spectra were collected on a Nicolet Fourier spectrophotometer (USA) using KBr pellets. Powder X-ray diffraction (XRD) was used to observe the composition and crystallisation of Fe3O4@PDA@Cu-MOFs using a Bruker D4 X-ray diffractometer with Ni-filtered Cu Kα radiation (40 kV, 40 mA) (Germany). Nitrogen adsorption–desorption isotherms were performed on a Micromeritics Tristar 3000 analyser (USA) at 77 K. The Brunauer–Emmett–Teller (BET) method was applied to calculate the specific surface area of the sample. X-ray photoelectron spectra (XPS) were collected on an RBD 147 upgraded PHI 5000C ESCA system with a dual X-ray source (Shimadzu Corp). A Mg Kα (1253.6 eV) anode and a hemispherical energy analyser were used in the measurement. All the binding energies were referenced to the 1s peak at 284.8 eV of the surface adventitious carbon.2.4. Enrichment of MC-LR using Fe3O4@PDA@Cu-MOFs
A series of MC-LR standard solutions (0.01, 0.05, 0.1, 0.5, 1, 2, 4, 8 and 16 μg L−1) were prepared and 1 mg of Fe3O4@PDA@Cu-MOFs composite was added to 1 mL of ultra-pure water to obtain a 1 mg mL−1 solution of Fe3O4@PDA@Cu-MOFs composites. Then, 20 μL of the 1 mg mL−1 Fe3O4@PDA@Cu-MOFs solution and 80 μL of different concentrations MC-LR solutions was mixed and vibrated for 30 min. Subsequently, the Fe3O4@PDA@Cu-MOFs composites enriched with MC-LR were collected by a magnet. The Fe3O4@PDA@Cu-MOFs composites were washed by elution.2.5. MALDI-TOF MS analysis
All the MALDI-TOF MS experiments were recorded on a 5800 MALDI-TOF MS (Applied Biosystems, Framingham, MA, USA) equipped with a Nd:YAG laser (383 nm) in positive reflector mode. The instrument was operated at an acceleration voltage of 20 kV. The parameters of MALDI-TOF MS were set as follows: laser intensity, 60%; mass range, 700–1500 m/z. A ground-steel sample target with 384 spots was utilised, and 1 μL of the eluate was deposited on the MALDI plate and dried at room temperature. After that, 1 μL of the CHCA solution was deposited onto the layer of the eluate and dried. The MALDI plate was analysed by MALDI-TOF MS.2.6. Analysis of MC-LR real water sample
To further confirm their superior enrichment efficiency for MC-LR, Fe3O4@PDA@Cu-MOFs microspheres were applied to real water sample. The real water samples were obtained from the Poyang Lake in China. The real water sample was centrifuged for 5 min at 10![[thin space (1/6-em)]](https://www.rsc.org/images/entities/char_2009.gif) 000 rpm to remove large particles. 20 μL of the 1 mg mL−1 Fe3O4@PDA@Cu-MOFs composite was added 80 μL real water sample mixed and vibrated for 30 min, after the enriched MC-LR were separated by magnet, followed by washing with deionized water (50 μL) three times to remove other compounds. The obtained Fe3O4@PDA@Cu-MOFs-MC-LR was eluted with 10 μL for 10 min. Finally, the eluted MC-LR was directly transferred onto plate for MALDI-TOF MS analysis.
000 rpm to remove large particles. 20 μL of the 1 mg mL−1 Fe3O4@PDA@Cu-MOFs composite was added 80 μL real water sample mixed and vibrated for 30 min, after the enriched MC-LR were separated by magnet, followed by washing with deionized water (50 μL) three times to remove other compounds. The obtained Fe3O4@PDA@Cu-MOFs-MC-LR was eluted with 10 μL for 10 min. Finally, the eluted MC-LR was directly transferred onto plate for MALDI-TOF MS analysis.
3 Results and discussion
Scheme 1 describes the synthesis route of the Fe3O4@PDA@Cu-MOFs microspheres. First, strongly magnetic Fe3O4 nanoparticles were synthesised through a hydrothermal reaction. Then, the PDA layer was decorated onto the surface of Fe3O4 because it contains hydroxyl and amino groups that can combine with metal ions. Subsequently, the Cu-MOFs were modified onto the surface of Fe3O4@PDA by using sol–gel method. Because PDA has good hydrophilicity and excellent dispersibility, it not only improved the hydrophilicity but also acted as the linker between Cu-MOFs and Fe3O4. Finally, the Fe3O4@PDA@Cu-MOFs composites were used as adsorbent for the enrichment of MC-LR in water samples on the basis of the reaction of Cu2+ with carboxyl and amino groups.The morphologies and size of Fe3O4, Fe3O4@PDA and Fe3O4@PDA@Cu-MOFs were characterised by SEM and TEM. As shown in Fig. 1a, the TEM image of Fe3O4 revealed that the average particle size of Fe3O4 was approximately 100 nm. The Fe3O4@PDA microspheres showed a typical core–shell structure with a PDA shell of approximately 15 nm (Fig. 1b). The TEM images of Fe3O4@PDA@Cu-MOFs in Fig. 1c show that Cu-MOFs are coated on the surface of Fe3O4@PDA. The TEM images of Fe3O4@PDA@Cu-MOFs indicate that the thickness of the Cu-MOFs shell is approximately 20 nm. Moreover, the SEM observation shows that Fe3O4@PDA@Cu-MOFs have spherical morphology (Fig. S1†).
Fig. S2† shows the FT-IR spectra of Fe3O4, Fe3O4@PDA and Fe3O4@PDA@Cu-MOFs. In all the samples, the peaks at 3398 cm−1 and 557 cm−1 were assigned to the O–H stretching vibration of hydroxyl groups and Fe–O–Fe stretching vibration of Fe3O4.32 For Fe3O4@PDA, the bands at 1385 cm−1 and 1588 cm−1 were attributed to the C–N stretching vibration and C![[double bond, length as m-dash]](https://www.rsc.org/images/entities/char_e001.gif) C vibration of the aromatic ring indicating the successful formation of PDA on the surface of Fe3O4 (Fig. S2b†). Besides, relative to the Fe3O4@PDA composites, the FT-IR spectra of Fe3O4@PDA@Cu-MOFs show other adsorption bands at 1400 cm−1 and 3418 cm−1, which could be because to the O–H stretching vibration and O–H bending vibration of carboxyl groups from Cu-MOFs.
C vibration of the aromatic ring indicating the successful formation of PDA on the surface of Fe3O4 (Fig. S2b†). Besides, relative to the Fe3O4@PDA composites, the FT-IR spectra of Fe3O4@PDA@Cu-MOFs show other adsorption bands at 1400 cm−1 and 3418 cm−1, which could be because to the O–H stretching vibration and O–H bending vibration of carboxyl groups from Cu-MOFs.
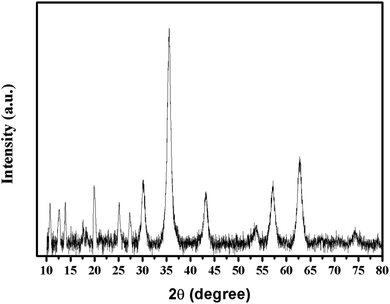
The XRD pattern of Fe3O4@PDA@Cu-MOFs is shown in Fig. 2. The peaks at 2θ = 30.4°, 35.6°, 43.3°, 53.7°, 57.3° and 62.7° can be indexed to the (220), (311), (400), (422), (511) and (440) reflections of the cubic Fe3O4 phase, respectively, (JCPDS card no. 190629).33 Moreover, the peaks at 2θ = 10.7°, 12.6°, 13.9°, 19.9°, 25.1° and 27.3° can be indexed to the (222), (331), (422), (731), (751) and (440) planes of Cu-MOFs, respectively.34
XPS was used to examine the compositions of the surface elements and electronic state of Fe3O4@PDA@Cu-MOFs. As shown in Fig. 3a, O, Cu and C could be observed, but no peaks that corresponded to Fe appeared, thereby, proving that the magnetic Fe3O4 core was well encapsulated inside the core–shell microspheres by PDA@Cu-MOFs. The C 1s spectrum of Fe3O4@PDA@Cu-MOFs (Fig. 3c) exhibited peaks at 284.6 eV, 287.3 eV and 289.2 eV, which can be attributed to C![[double bond, length as m-dash]](https://www.rsc.org/images/entities/char_e001.gif) C, C
C, C![[double bond, length as m-dash]](https://www.rsc.org/images/entities/char_e001.gif) O and O–C
O and O–C![[double bond, length as m-dash]](https://www.rsc.org/images/entities/char_e001.gif) O, respectively. The XPS peaks of Cu 2p that centred at 933.7 eV and 953.6 eV (Fig. 3b) can be assigned to Cu 2p3/2 and Cu 2p1/2, respectively. In addition, two characteristic peaks centred at 943.4 eV and 938.8 eV, which could be attributed to the satellite peaks of Cu 2p.35 The peaks of O 1s at 529.7 eV and 531.5 eV could be ascribed to the lattice oxygen (C–O) and O–H of Cu-MOFs, respectively (Fig. 3d). The mass percentages of C, O, N and Cu were determined to be 66.75%, 24.50%, 4.54% and 4.21%, respectively. These results indicate that Cu-MOFs were successful decorated onto the surface of Fe3O4@PDA.
O, respectively. The XPS peaks of Cu 2p that centred at 933.7 eV and 953.6 eV (Fig. 3b) can be assigned to Cu 2p3/2 and Cu 2p1/2, respectively. In addition, two characteristic peaks centred at 943.4 eV and 938.8 eV, which could be attributed to the satellite peaks of Cu 2p.35 The peaks of O 1s at 529.7 eV and 531.5 eV could be ascribed to the lattice oxygen (C–O) and O–H of Cu-MOFs, respectively (Fig. 3d). The mass percentages of C, O, N and Cu were determined to be 66.75%, 24.50%, 4.54% and 4.21%, respectively. These results indicate that Cu-MOFs were successful decorated onto the surface of Fe3O4@PDA.
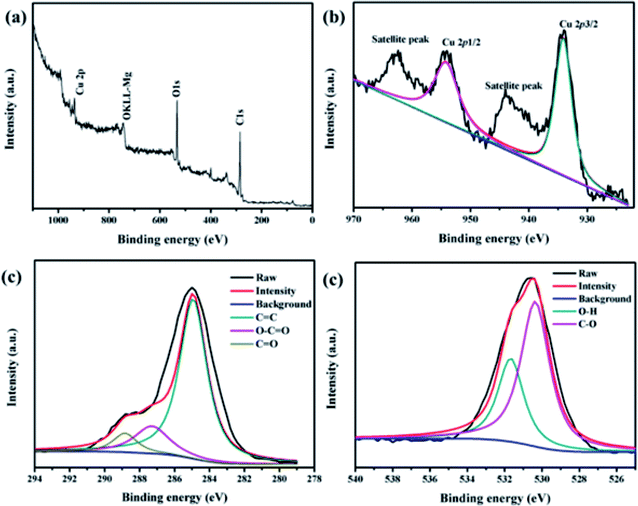 | ||
| Fig. 3 XPS spectra of the Fe3O4@PDA@Cu-MOFs composites: (a) wide XPS survey spectrum, (b) Cu 2p, (c) C 1s and (d) O 1s. | ||
The inner architectures of the Fe3O4@PDA@Cu-MOFs composites were investigated by nitrogen adsorption–desorption isotherm analysis. As exhibited in Fig. 4a, Fe3O4@PDA@Cu-MOFs gave rise to a type-IV curve, which indicated that the Fe3O4@PDA@Cu-MOFs composites had a mesoporous structure. The Brunauer–Emmett–Teller (BET) surface area and total pore volume of the Fe3O4@PDA@Cu-MOFs composites were calculated to be 70.4 m2 g−1 and 0.055 cm3 g−1, respectively. The pore size distributions derived from the adsorption branches of the isotherms by using the Barrett–Joyner–Halenda (BJH) model displayed a mean pore size of approximately 3.2 nm (Fig. 4b). Taken together, these results indicate that the Fe3O4@PDA@Cu-MOFs composites had large surface area and a mesoporous structure.
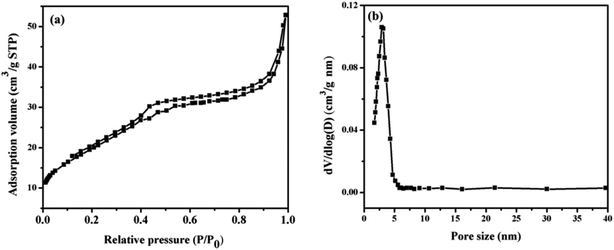 | ||
| Fig. 4 Nitrogen adsorption–desorption isotherms (a) and pore size distributions of the Fe3O4@PDA@Cu-MOFs composites (b). | ||
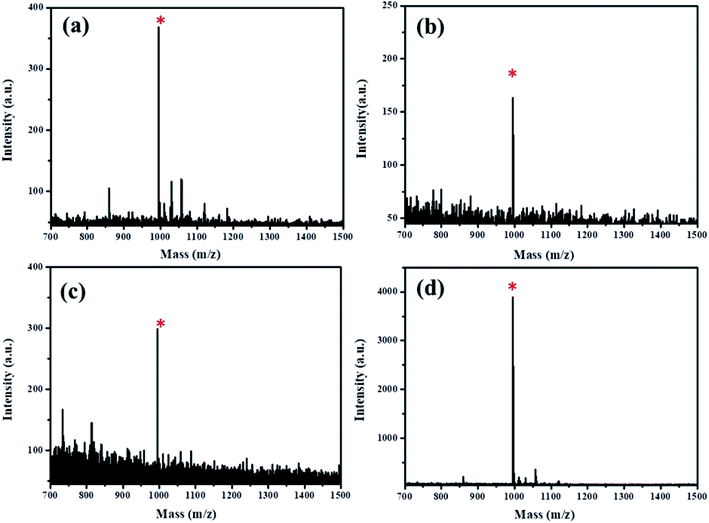
Eluents have a considerable effect on desorption from the Fe3O4@PDA@Cu-MOFs adsorbent. Three common eluents were used to investigate the effect of elution of MC-LR (i.e. 50% CAN-0.1% TFA (v![[thin space (1/6-em)]](https://www.rsc.org/images/entities/char_2009.gif) :
:![[thin space (1/6-em)]](https://www.rsc.org/images/entities/char_2009.gif) v), 0.25 M NH4HCO3 and 0.4 M NH3·H2O). Fig. 5 shows that the effect of elution of MC-LR desorbed by 0.25 M NH4HCO3 were higher than 50% CAN-0.1% TFA and 0.4 M NH3·H2O under the same condition. These results suggest that 0.25 M NH4HCO3 is the optimising eluent for desorption of MC-LR from the enriched by Fe3O4@PDA@Cu-MOFs composites. Therefore, ammonium bicarbonate eluents were used in the following experiments.
v), 0.25 M NH4HCO3 and 0.4 M NH3·H2O). Fig. 5 shows that the effect of elution of MC-LR desorbed by 0.25 M NH4HCO3 were higher than 50% CAN-0.1% TFA and 0.4 M NH3·H2O under the same condition. These results suggest that 0.25 M NH4HCO3 is the optimising eluent for desorption of MC-LR from the enriched by Fe3O4@PDA@Cu-MOFs composites. Therefore, ammonium bicarbonate eluents were used in the following experiments.
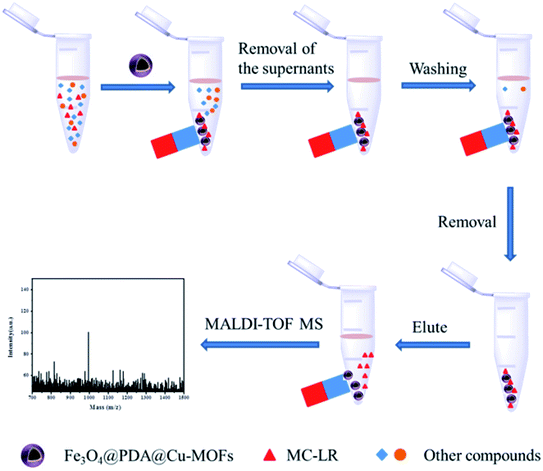
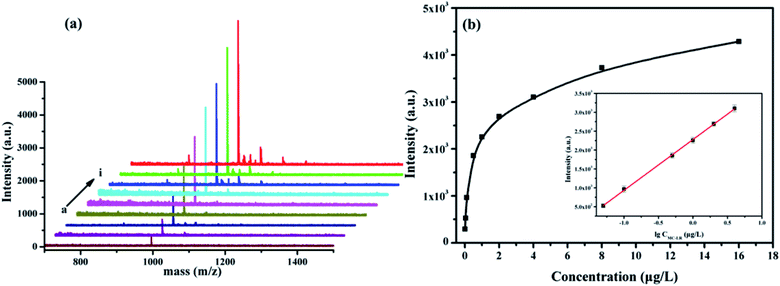
The enrichment procedure for MC-LR by using the Fe3O4@PDA@Cu-MOFs composites is shown in Scheme 2. The MALDI-TOF MS signal intensity of 1 μg L−1 MC-LR is shown in Fig. S3a,† the signal intensity is 365. After enrichment by the Fe3O4@PDA@Cu-MOFs composites, the signal intensity is 3754 (Fig. S3b†), the results indicate that an enrichment factor of about 10. Under the optimised eluent condition, the Fe3O4@PDA@Cu-MOFs composites for enrichment and detection MC-LR were studied. As shown in Fig. 6a, the mass signal intensities increased with the increase MC-LR concentration. The result showed that the signal intensity of MC-LR had good linearity (R2 = 0.997) with the logarithm of MC-LR concentration from 0.05 μg L−1 to 4 μg L−1. The linear regression equation was determined to be Y = 2279.07 + 1344.52![[thin space (1/6-em)]](https://www.rsc.org/images/entities/char_2009.gif) log
log![[thin space (1/6-em)]](https://www.rsc.org/images/entities/char_2009.gif) CMC-LR (μg L−1). The limit of detection (LOD) was 0.015 μg L−1 (LOD = 3σ/k, k is the slope of the calibration curve and σ is the standard deviation), which was lower than the maximum limit of MC-LR in drinking water specified by WHO. As depicted in Table S1,† our method afforded better results than others methods, which were previously reported.
CMC-LR (μg L−1). The limit of detection (LOD) was 0.015 μg L−1 (LOD = 3σ/k, k is the slope of the calibration curve and σ is the standard deviation), which was lower than the maximum limit of MC-LR in drinking water specified by WHO. As depicted in Table S1,† our method afforded better results than others methods, which were previously reported.
To evaluate the applicability of the present method in real water samples, the MC-LR content in real water samples was determined by MALDI-TOF MS before and after enrichment using the Fe3O4@PDA@Cu-MOFs composites (Fig. S4†). MC-LR was not detected in the mass spectrum of the water sample before treatment with the Fe3O4@PDA@Cu-MOFs composites (Fig. S4a†). In contrast, MC-LR was detected after treatment with the Fe3O4@PDA@Cu-MOFs composites (Fig. S4b†), which indicated that the Fe3O4@PDA@Cu-MOFs composites could successfully enrich the MC-LR content in real water samples. According to the established calibration equations, the recoveries were 98.68–106.2% for MC-LR (Table 1). These results demonstrate that the Fe3O4@PDA@Cu-MOFs composites have great potential to be used for the analysis of MC-LR in real water samples by MALDI-TOF MS spectroscopy.
| Analyte | Added (μg L−1) | Found (μg L−1) | Recovery (%) | RSD (n) |
|---|---|---|---|---|
| MC-LRs | 1 | 1.062 | 106.2 | 6.1 |
| 2 | 2.010 | 100.5 | 8.2 | |
| 4 | 3.947 | 98.68 | 6.6 |
4 Conclusions
In summary, Fe3O4@PDA@Cu-MOFs composites were successfully synthesised via a solvothermal reaction and a sol–gel method. The Fe3O4@PDA@Cu-MOFs composites exhibited excellent hydrophilicity, high surface area, strong magnetism and a mesoporous structure. They were applied as adsorbents for the enrichment of low-concentration MC-LR in real water samples and directly for MALDI-TOF MS analysis. This method earned good linear range, low detection limit and intermediate precision for MC-LR, indicating that the Fe3O4@PDA@Cu-MOFs composites can used as suitable sorbents for MC-LR in water. All the above results indicated that Fe3O4@PDA@Cu-MOFs composites as adsorbent have great promise in environmental field.Conflicts of interest
There are no conflicts to declare.Acknowledgements
This work was financially supported by the Science and Technology Research Project of Education Department of Jiangxi Province and the Natural Science Foundation of Jiangxi Province (20171ACB20025, GJJ190615). We was also grateful for the Shanghai Key Laboratory of Atmospheric Particle Pollution and Prevention (FDLAP19004).Notes and references
- N. L. McLellan and R. A. Manderville, Toxicol. Res., 2017, 6, 391–405 CrossRef CAS PubMed
.
- Z. Svirčev, D. Drobac, N. Tokodi, B. Mijović, G. A. Codd and J. Meriluoto, Arch. Toxicol., 2017, 91, 621–650 CrossRef PubMed
.
- X. Yan, X. Xu, M. Wang, G. Wang, S. Wu, Z. Li, H. Sun, A. Shi and Y. Yang, Water Res., 2017, 125, 449–457 CrossRef CAS PubMed
.
- B. Qin, G. Zhu, G. Gao, Y. Zhang, W. Li, H. W. Paerl and W. W. Carmichael, Environ. Manag., 2010, 45, 105–112 CrossRef PubMed
.
- G. A. Codd and P. B. Nunn, Toxicon, 2019, 168, 93–94 CrossRef CAS PubMed
.
- Y. Zhou, J. Yuan, J. Wu and X. Han, Toxicol. Lett., 2012, 212, 48–56 CrossRef CAS PubMed
.
- J. Ma, Y. Li, H. Duan, R. Sivakumar and X. Li, Chemosphere, 2018, 192, 305–317 CrossRef CAS PubMed
.
- R. Yang, D. Song, S. Fang, Y. Liu, X. Zhou, F. Long and A. Zhu, Biosens. Bioelectron., 2018, 121, 27–33 CrossRef CAS PubMed
.
- S. Karthikeyan, D. D. Dionysiou, A. F. Lee, S. Suvitha, P. Maharaja, K. Wilson and G. Sekaran, Catal. Sci. Technol., 2016, 6, 530–544 RSC
.
- M. J. Brophy, A. L. Mackie, Y. Park and G. A. Gagnon, Environ. Sci.: Processes Impacts, 2019, 21, 659–666 RSC
.
- X. Li, R. Cheng, H. Shi, B. Tang, H. Xiao and G. Zhao, J. Hazard. Mater., 2016, 304, 474–480 CrossRef CAS PubMed
.
- A. Sassolas, G. Catanante, D. Fournier and J. L. Marty, Talanta, 2011, 85, 2498–2503 CrossRef CAS PubMed
.
- A. C. Neumann, X. Wang, R. Niessner and D. Knopp, Anal. Methods, 2016, 8, 57–63 RSC
.
- L. Spoof, K. Karlsson and J. Meriluoto, J. Chromatogr. A, 2001, 909, 225–236 CrossRef CAS
.
- J. Zhang, J. Lei, R. Pan, C. Leng, Z. Hu and H. Ju, Chem. Commun., 2011, 47, 668–670 RSC
.
- Z.-L. Xu, S.-L. Ye, L. Luo, X. Hua, J.-X. Lai, X.-P. Cai, Q.-W. Liang, H.-T. Lei, Y.-M. Sun, Y.-p. Chen and X. Shen, Sci. Total Environ., 2020, 708, 134614 CrossRef CAS PubMed
.
- Y. Zhang, Y. Lai, X. Teng, S. Pu, Z. Yang, P. Pang, H. Wang, C. Yang, W. Yang and C. J. Barrow, Anal. Methods, 2020, 12, 1752–1758 RSC
.
- Y. Zhang, Z. Zhu, X. Teng, Y. Lai, S. Pu, P. Pang, H. Wang, C. Yang, C. J. Barrow and W. Yang, Talanta, 2019, 202, 279–284 CrossRef CAS PubMed
.
- L. Tang, X. Ouyang, B. Peng, G. Zeng, Y. Zhu, J. Yu, C. Feng, S. Fang, X. Zhu and J. Tan, Nanoscale, 2019, 11, 12198–12209 RSC
.
- K. Abnous, N. M. Danesh, M. A. Nameghi, M. Ramezani, M. Alibolandi, P. Lavaee and S. M. Taghdisi, Biosens. Bioelectron., 2019, 144, 111674 CrossRef CAS PubMed
.
- T. Guan, W. Huang, N. Xu, Z. Xu, L. Jiang, M. Li, X. Wei, Y. Liu, X. Shen, X. Li, C. Yi and H. Lei, Sens. Actuators, B, 2019, 294, 132–140 CrossRef CAS
.
- M. Zhao, C. Deng and X. Zhang, ACS Appl. Mater. Interfaces, 2013, 5, 13104–13112 CrossRef CAS PubMed
.
- A. Maus, R. Mignon and F. Basile, Anal. Biochem., 2018, 545, 31–37 CrossRef CAS PubMed
.
- L. Ling, C. Xiao, S. Wang, L. Guo and X. Guo, Talanta, 2019, 200, 236–241 CrossRef CAS PubMed
.
- Z. Li, Q. Liu, X. Lu, C. Deng, N. Sun and X. Yang, Talanta, 2019, 194, 329–335 CrossRef CAS PubMed
.
- H. Zhao, Y. Li, J. Wang, M. Cheng, Z. Zhao, H. Zhang, C. Wang, J. Wang, Y. Qiao and J. Wang, ACS Appl. Mater. Interfaces, 2018, 10, 37732–37742 CrossRef CAS PubMed
.
- S. Liu, C. Deng and X. Zhang, Talanta, 2016, 154, 183–189 CrossRef CAS PubMed
.
- W. Teng, Z. Wu, J. Fan, H. Chen, D. Feng, Y. Lv, J. Wang, A. M. Asiri and D. Zhao, Energy Environ. Sci., 2013, 6, 2765–2776 RSC
.
- W. Teng, Z. Wu, D. Feng, J. Fan, J. Wang, H. Wei, M. Song and D. Zhao, Environ. Sci. Technol., 2013, 47, 8633–8641 CrossRef CAS PubMed
.
- C. Hu, M. He, B. Chen, C. Zhong and B. Hu, J. Chromatogr. A, 2013, 1310, 21–30 CrossRef CAS PubMed
.
- A. Amiri, R. Tayebee, A. Abdar and F. Narenji Sani, J. Chromatogr. A, 2019, 1597, 39–45 CrossRef CAS PubMed
.
- Y. Deng, C. Deng, D. Qi, C. Liu, J. Liu, X. Zhang and D. Zhao, Adv. Mater., 2009, 21, 1377–1382 CrossRef CAS
.
- X. Lou and L. Archer, Adv. Mater., 2008, 20, 1853–1858 CrossRef CAS
.
- M. Zhao, X. Zhang and C. Deng, Chem. Commun., 2015, 51, 8116–8119 RSC
.
- Z. Wang, M. Gui, M. Asif, Y. Yu, S. Dong, H. Wang, W. Wang, F. Wang, F. Xiao and H. Liu, Nanoscale, 2018, 10, 6629–6638 RSC
.
Footnote |
| † Electronic supplementary information (ESI) available. See DOI: 10.1039/d0ra04125d |
| This journal is © The Royal Society of Chemistry 2020 |


