
 Open Access Article
 This Open Access Article is licensed under a Creative Commons Attribution-Non Commercial 3.0 Unported Licence
Biguanide–transition metals complexes as potential drug for hyperglycemia treatment †‡
Stephanny Villamizar-Delgado ab,
Laura M. Porras-Osorioa,
Octavio Piñerosa,
Javier Ellenac,
Norman Balcazarde,
Ruben E. Varela-Mirandaa and
Richard F. D'Vries*a
ab,
Laura M. Porras-Osorioa,
Octavio Piñerosa,
Javier Ellenac,
Norman Balcazarde,
Ruben E. Varela-Mirandaa and
Richard F. D'Vries*a
aFacultad de Ciencias Básicas, Universidad Santiago de Cali, Calle 5 #62-00, Cali, Colombia. E-mail: richard.dvries00@usc.edu.co
bSão Carlos Institute of Chemistry, University of São Paulo, CEP 13.566-590, São Carlos, SP, Brazil
cSão Carlos Institute of Physics, University of São Paulo, CEP 13.566-590, São Carlos, SP, Brazil
dMolecular Genetics Group, Universidad de Antioquia, Calle 70, No 52-21, A. A. 1226, Medellin, Colombia
eDepartment of Physiology and Biochemistry, School of Medicine, Universidad de Antioquia, Calle 70, No 52-21, A. A. 1226, Medellin, Colombia
First published on 16th June 2020
Abstract
Coordination compounds of Cu(II), Ni(II), Co(II), and Zn(II) with a type of biguanide (known commercially as metformin) have been synthesized and characterized using spectroscopic techniques (FT-IR, UV/VIS), X-ray diffraction techniques and thermal analysis. For all compounds, single crystals were obtained for single-crystal X-ray diffraction. For the first time, an octahedral cobalt compound with the formula [Co(C4H11N5)3]Cl2·2H2O that crystallizes in the monoclinic space group C2/c with one molecule in the asymmetric unit has been obtained. Also, a novel nickel compound with the formula [Ni(C4H11N5) (C4H10N5)]Cl·H2O that crystallizes in the monoclinic space group P21/c with two molecules in the asymmetric unit was obtained. Finally, we obtained copper and zinc compounds that crystallize in the monoclinic space groups P21/n and P21/c with the general formula [Cu(C4H11N5)2]Cl2·H2O and [Zn(C4H12N5)Cl3], respectively. A structural and supramolecular analysis was developed for all compounds using Hirshfeld surface analysis and electrostatic potential maps. The cell viability of the obtained compounds was evaluated in C2C12 (ATCCCRL-1772™) mouse muscle cells and HepG2 (ATCC HB-8065™) human liver carcinoma cells by the MTT assay to determine the potential of the compounds as new safe drugs. The results demonstrate that the compounds exhibit low cytotoxicity at doses less than 250 μg mL−1 with a cell viability greater than 80%.
Introduction
About 100 million people worldwide have type II diabetes (T2D), making it one of the most common chronic diseases.1 Diabetes is characterized by a high concentration of glucose in the blood (hyperglycemia) due to the excessive production of liver glucose and resistance to peripheral insulin.2 Currently, the underlying causes of these physiological behaviors are not well understood, but diabetes is known to be associated with both genetic and acquired factors, such as unhealthy eating habits, stress, hypertension, obesity, sedentary lifestyle, and metabolic syndrome.1 Of these, hyperglycemia is considered the leading risk factor for the development of diabetic complications.Currently, one of the most widely used pharmaceutical compounds to control hyperglycemia in patients with T2D is metformin hydrochloride (a biguanide derivative) due to its effectiveness and good safety profile.3 However, it is also associated with adverse side effects, including lactic acidosis, and can cause serious problems in patients with cardiovascular, renal, hepatic, and pulmonary disease.4
One pharmaceutical alternative for the treatment of diabetes, metabolic syndrome, cancer, bacterial, fungal and viral infections, and other diseases is the use of metallo-drugs.5 Metallo-drugs are pharmacological compounds that contain an organic molecule coordinated to a metallic center.6 In this sense, different metallo-drugs complexes form from metfomin are obtained and tested its biological activity against different microorganism.7,8 Also, are reported patents that involve the metformin and metals as chromium and vanadium in the treatment of T2D and metabolism disorders.9 In other hand, has been demonstrated the activity of different metallo-drugs based in V(V/IV), Cr(III), Mo(VI), W(VI), Zn(II), Cu(II), and Mn(III) in the treatment of diabetes and metabolic syndromes.10 This type of compound can act in two different ways: (i) the metal–organic complex exhibits the biological activity over a biological target, and (ii) the complex act as a carrier to transport the organic molecule to the active site and produce the therapeutic activity. In both cases, the synergic action of the components improves the biological activity while minimizing the side effects.
Our research group has focused on the development of new molecules and metallo-drugs as pharmaceutical alternatives for the treatment of multiples diseases, such as T2D and metabolic syndrome.11–13 Several attempts to obtain metformin–metal complexes have been reported, but in most cases, the structural data could not be obtained, and in others, an incomplete structural analysis was performed.7,14–16
To address these shortcomings, this work focuses on the synthesis, characterization, and structural study of complexes based on metformin and transition metals, including Co(II), Cu(II), Ni(II), and Zn(II). We aim to make a first close-up of the cytotoxic activity in order to propose new therapeutic alternatives in the treatment of T2D and metabolic syndrome.
Experimental section
General information
The following reagents and solvents were commercially available and used as supplied without further purification: metformin hydrochloride U. S. P. (Metf) (Harman Finochem Limited); CoCl2·6H2O (99%, Sigma-Aldrich); CuCl2·2H2O (99%, Sigma-Aldrich); NiSO4·6H2O (99%, Sigma-Aldrich); and ZnCl2·6H2O (99%, Sigma-Aldrich). Chemical and reagents used in cell culture included phosphate-buffered saline 1× (PBS) (Gibco, Carlsbad, CA, USA), low glucose Dulbecco's Modified Eagle's Medium (LGDMEM) (Sigma-Aldrich, St. Louis, MO, USA), high glucose Dulbecco's Modified Eagle's Medium (HGDMEM) (Sigma-Aldrich, St. Louis, MO, USA), RPMI 1640 Medium (Sigma-Aldrich, St. Louis, MO, USA), fetal bovine serum (FBS) (Invitrogen, Carlsbad, CA, USA), penicillin–streptomycin (P/S) 10![[thin space (1/6-em)]](https://www.rsc.org/images/entities/char_2009.gif) 000 U mL−1 (Invitrogen, Carlsbad, CA, USA), glutamine (Gibco, Carlsbad, CA, USA), and the methyl thiazole tetrazolium (MTT) assay (Amresco, Solon, OH, USA).
000 U mL−1 (Invitrogen, Carlsbad, CA, USA), glutamine (Gibco, Carlsbad, CA, USA), and the methyl thiazole tetrazolium (MTT) assay (Amresco, Solon, OH, USA).
Thermogravimetric analysis (TGA) was performed in a TA instrument (Discovery SDT 650) under the following conditions: 25–900 °C temperature range, under nitrogen (100 mL min−1 flow) atmosphere, and 20 °C min−1 heating rate. Fourier-transform infrared spectrophotometry (FTIR) spectra were recorded from KBr pellets in the 4000–250 cm−1 range on a Shimadzu IRAffinity-1.
Synthesis of the [Co(C4H11N5)3]Cl2·2H2O complex (compound 1)
In a flat-bottomed flask, 10 mL of methanolic solutions of the Mfn ligand (C4H12N5Cl) (33 mg, 0.2 mmol) were mixed with 1.2 equivalents of NaOH and 5 mL of cobalt(II) chloride (CoCl2·6H2O) (23 mg, 0.1 mmol). The reaction mixture was refluxed for 60 minutes. The resulting solution was concentrated and cooled to room temperature. Cubic reddish crystals were obtained by slow evaporation after 4 weeks (yield = 61.57%). Elemental anal. calcd for [Co(C4H11N5)3]Cl2·2H2O (C12H37N15O2Cl2Co): C, 26.05; H, 6.74; N, 37.97. Found: C, 25.86; H, 6.02; N, 37.21.Synthesis of the [Ni(C4H11N5) (C4H10N5)]Cl·H2O complex (compound 2)
In a flat-bottomed flask, 4 mL of a solution of the Mfn ligand (C4H12N5Cl) (66 mg 0.4 mmol) were mixed with 4 mL of aqueous nickel(II) sulfate solution (NiSO4·6H2O) (47 mg, 0.2 mmol) and 53 mg of NaOH (1.3 mmol). The reaction mixture was stirred for 60 minutes at room temperature. The resulting solution was cooled to room temperature and filtered to separate the orange solid (crystalline powder) obtained. The obtained solid was dissolved in water, and HCl was added dropwise until dissolution. The compound was recrystallized by slow evaporation to obtain prism orange crystals (yield = 53.70%). Elemental anal. calcd for [Ni(C4H11N5)(C4H10N5)]Cl·H2O (C8H23N10OClNi): C, 26.01; H, 6.27; N, 37.91. Found: C, 25.67; H, 5.81; N, 37.03.Synthesis of the [Cu(C4H11N5)2]Cl2·2H2O complex (compound 3)
In a flat-bottomed flask, 4 mL of an aqueous solution of the Mfn ligand (C4H12N5Cl) (33 mg, 0.2 mmol) were mixed with 4 mL of an aqueous solution of copper(II) chloride (CuCl2·2H2O) (200 mg, 1.17 mmol) and 1.2 equivalents of NaOH. The reaction mixture was stirred for 60 minutes at room temperature. The resulting solution was concentrated, cooled to room temperature, and filtered to obtain a purple solid. The solid was dissolved in water and recrystallized by slow evaporation to obtain purple needless crystals (yield = 88.02%). Elemental anal. calcd for [Cu(C4H11N5)2]Cl2·2H2O (C8H26N10OCl2Cu): C, 22.41; H, 6.11; N, 32.66. Found: C, 22.15; H, 6.21; N, 32.41.Synthesis of the [Zn(C4H12N5) Cl3] complex (compound 4)
In a flat-bottomed flask, 4 mL of an aqueous solution of the Mfn ligand (C4H12N5Cl) (119 mg, 0.72 mmol) were mixed with 4 mL of an aqueous solution of zinc(II) chloride (ZnCl2) (200 mg, 1.46 mmol) and 1.2 equivalents of NaOH. The reaction mixture was stirred for 2.5 hours at room temperature. The resulting solution was filtered to obtain a colorless solid. The solid was dissolved in water and recrystallized by slow evaporation to obtain colorless crystals (yield = 60.15%). Elemental anal. calcd for [Zn(C4H12N5)Cl3] (C4H12N5Cl3Zn): C, 15.91; H, 4.01; N, 23.20. Found: C, 15.56; H, 3.98; N, 23.11.Single-crystal X-ray diffraction (SCXRD) for structure determination
SCXRD data for all compounds were collected at room temperature (293 K) on a Rigaku XTALAB-MINI diffractometer using MoKα radiation (0.71073 Å) monochromated by graphite. The cell determination and final cell parameters were obtained on all reflections using CrysAlisPro software.17 Data integration and scaling were performed using CrysAlisPro software.17 The structures were solved and refined with SHELXT18 and SHELXL19 softwares, respectively, including in Olex2.20 In all cases, non-hydrogen atoms were clearly resolved and full-matrix least-squares refinement with anisotropic thermal parameters was performed. In addition, hydrogen atoms were stereochemically positioned and refined using the riding model in all cases.21 The Co compound was refined using the Squeeze routine (Platon)22 to decrease the disorder solvent contribution (water in our case) to calculate the structure factors and improve the refinement values. Oak Ridge Thermal Ellipsoid Plot (ORTEP) diagrams for all structures were prepared with Diamond.23 Mercury program were used for the preparation of artwork.24Cell cultures
C2C12 (ATCCCRL-1772™) mouse muscle cells and HepG2 (ATCC HB-8065™) human liver carcinoma cells were purchased from the American Type Culture Collection (ATCC) (Manassas, VA, USA). Cells were cultured at 37 °C and 5% CO2 in DMEM supplemented with 10% FBS, 2 mM glutamine, penicillin, and 1% streptomycin (Sigma). When C2C12 cells reached 80–90% confluency, they were differentiated into myotubes using low glucose DMEM (5.5 mM) supplemented with 5% horse serum (HS).25To evaluate cell viability, HepG2 and C2C12 cells were seeded in 96 multi-well plates at a density of 2.5 × 10⁴ cells per well and cultured for 24 h. The cells were washed once with DMEM and then incubated with different concentrations of extracts or fractions (1000, 500, 250, 125, 62.5, 31.25 μg mL−1) in DMEM for 4 h (C2C12) or 48 h (HepG2). The negative control is formed by cell culture medium with the same cell concentration and 0.05% of DMSO. Insulin 0.3 mM (INS) and metformin 5 mM (MET) are used as positive control. Subsequently, the medium was removed, cells were washed once, and MTT (5 mg mL−1) in DMEM was added to each well and incubated for 4 h. The MTT-containing medium was removed, and 200 μL of DMSO were added to dissolve the formazan crystals. The optical densities (OD) were measured using a Varioskan Flash spectrophotometer (Thermo, Waltham, MA, USA) at 570 nm.26
Results and discussion
ORTEP type diagrams of the asymmetric unit for all compounds are shown in Fig. 1. The hydrogen atoms for all compounds are available to show the ionic behavior of the complexes. The crystallographic and refinement data are present in Table 1.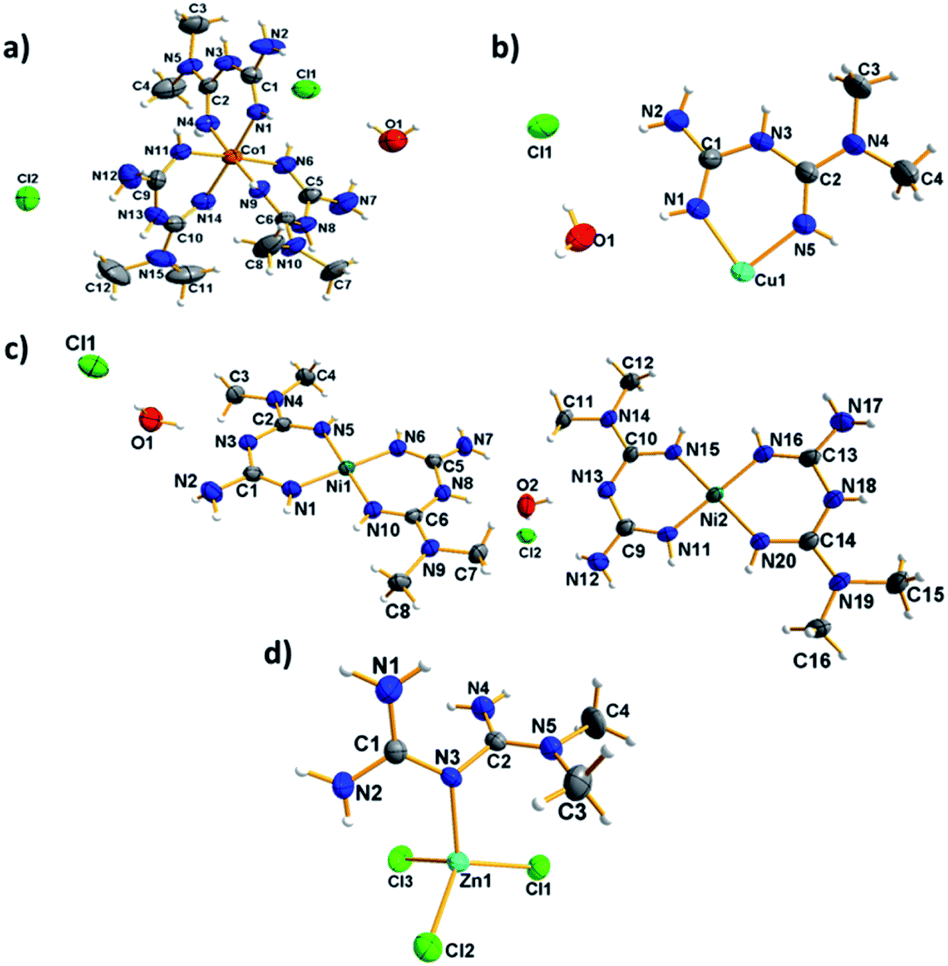 | ||
| Fig. 1 ORTEP type diagram of the asymmetric unit for the compounds: (a) [Co(C4H11N5)3]Cl2·2H2O, (b) [Cu(C4H11N5)2]Cl2·H2O, (c) [Ni(C4H11N5)(C4H10N5)]Cl·H2O and (d) [Zn(C4H12N5)Cl3] showing 50% of probability ellipsoids. | ||
| Compound | (1) | (2) | (3) | (4) |
|---|---|---|---|---|
| Emp. formula | C12H33N15Co, 2(Cl), H2O | C16H42N20Ni2, 2(Cl), 2H2O | C8H22N10Cu, 2(Cl), 2(H2O) | C4H12Cl3N5Zn |
| FW (g mol−1) | 535.38 | 739.05 | 428.83 | 301.91 |
| Crystal system | Monoclinic | Monoclinic | Monoclinic | Monoclinic |
| Space group | C2/c | P21/c | P21/n | P21/c |
|
||||
| Unit cell | ||||
| a (Å) | 36.470(2) | 13.3863(6) | 5.1596(14) | 12.5200(12) |
| b (Å) | 8.5892(6) | 7.4187(5) | 11.562(2) | 7.5140(6) |
| c (Å) | 17.3656(13) | 15.7512(9) | 15.091(4) | 13.0298(13) |
| β (°) | 99.376(6) | 104.757(5) | 95.63(3) | 113.199(12) |
| Volume (Å3) | 5367.1(6) | 1512.64(15) | 895.9(4) | 1126.7(2) |
| Z | 4 | 4 | 2 | 2 |
| ρ calcd (mg m−3) | 1.325 | 1.618 | 1.590 | 1.780 |
| Abs. coeff. (mm−1) | 0.872 | 1.476 | 1.541 | 2.856 |
| F(000) | 2248 | 772 | 446 | 608 |
| θ range (°) | 2.7–28.0 | 2.7–34.5 | 2.7–26.5 | 3.2–29.0 |
| Ref. collected/unique [R(int)] | 38196, 6485 [0.120] |
4364, 2843 [0.019] | 5415, 1863 [0.091] | 5154, 2966 [0.025] |
| Completeness (%) | 99.6 | 98.8 | 99.9 | 99.2 |
| Data/rest./param. | 6485/0/323 | 2843/0/111 | 1863/0/119 | 2966/0/120 |
| Gof on F2 | 1.01 | 1.09 | 1.04 | 1.09 |
| R1 [I > 2σ(I)] | 0.0601 | 0.0512 | 0.0585 | 0.0373 |
| wR2[I > 2σ(I)] | 0.1598 | 0.1314 | 0.1570 | 0.0928 |
The [Co(C4H12N5)3]Cl2·H2O compound (1) was obtained as cubic reddish crystals that crystallized in the C2/c monoclinic space group with one molecule of the cationic complex, two chloride anions, and one molecule of water in the asymmetric unit (Fig. 1a). The cationic complex is present as a six-coordinated arrangement (CoN6), generating a distorted octahedral polyhedron formed by three molecules of metformin in the chelate η2 mode (Fig. 2).
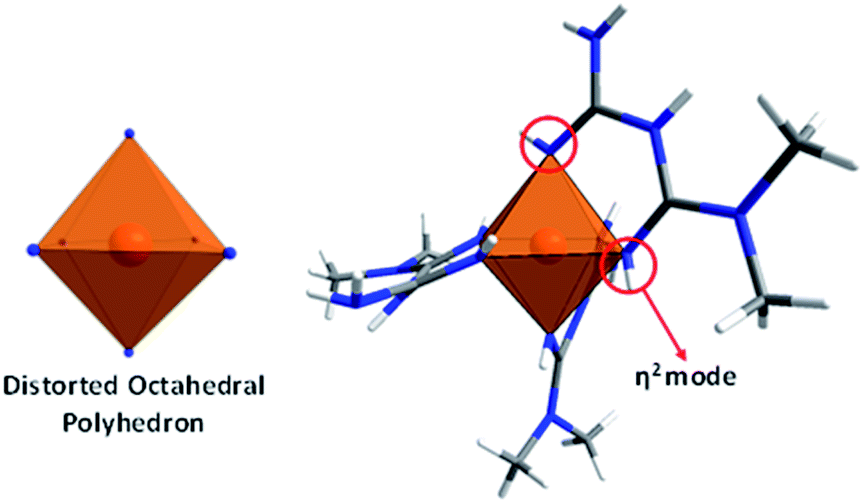 | ||
| Fig. 2 Polyhedral representation and coordination mode of the ligand in the compound 1. | ||
The crystal packing of this compound is governed by electrostatic interactions between the ions and hydrogen interactions of the amine and methyl groups of the biguanidine ligand and water molecules with N2–H2A⋯O1, O1–H1A⋯Cl2, and N7–H7A⋯Cl1 distances of 2.976(5), 3.127(4), and 3.185(5) Å, respectively (Fig. 3a). It is important to note that voids with a size of 667.6 Å3 able to accommodate up to 16 water molecules are present in the interlayer region (Fig. 3c). The disordered water molecules present in the voids join the layers giving rise to the formation of the 3D crystal packing of the complex.
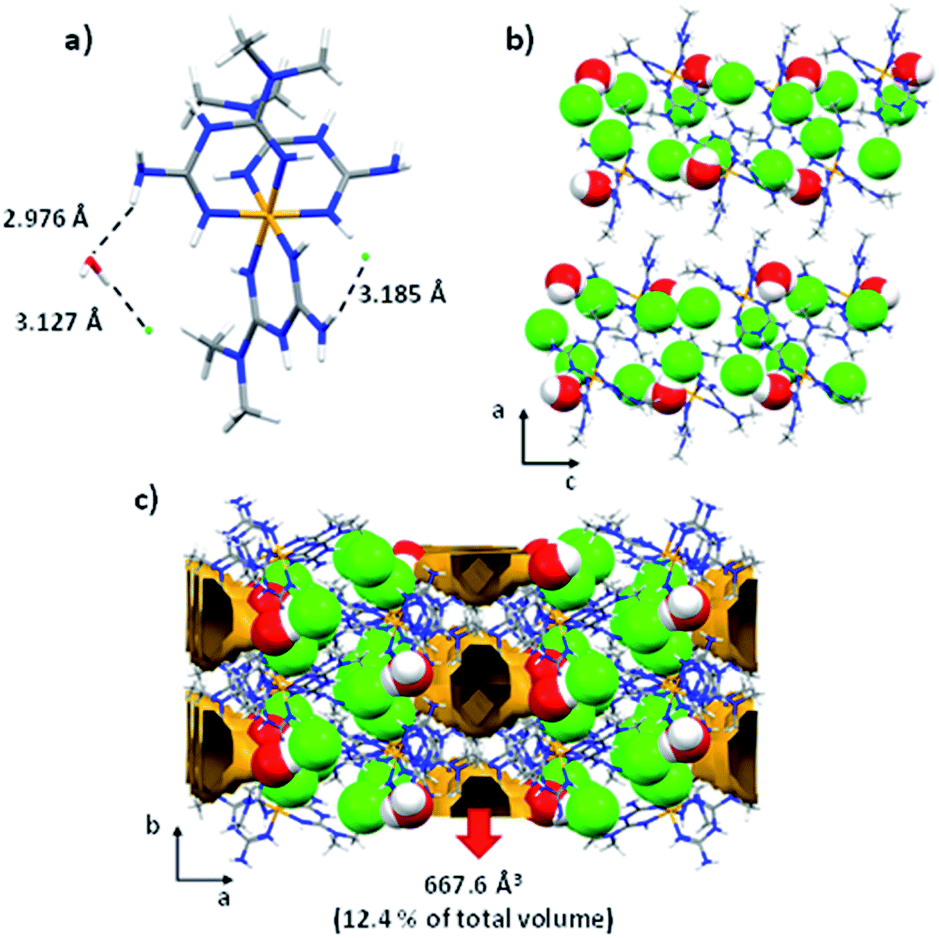 | ||
| Fig. 3 (a) interactions of the secondary coordination sphere; (b) view in the ac plane of the chains, (c) crystal packing and voids along [001] direction for the compound 1. | ||
The [Ni(C4H11N5)2]Cl·H2O compound (2) was obtained as yellow crystals that crystallized in the P21/c monoclinic space group. The compound contains two cationic complexes, two chloride anions, and two water molecules in the asymmetric unit (Fig. 1c). The complexes are formed by one metformin ligand and one deprotonated metformin coordinated to the Ni2+ center, forming a four-coordinated arrangement (NiN4) with a distorted square planar polyhedron or parallelepiped (Fig. 4).
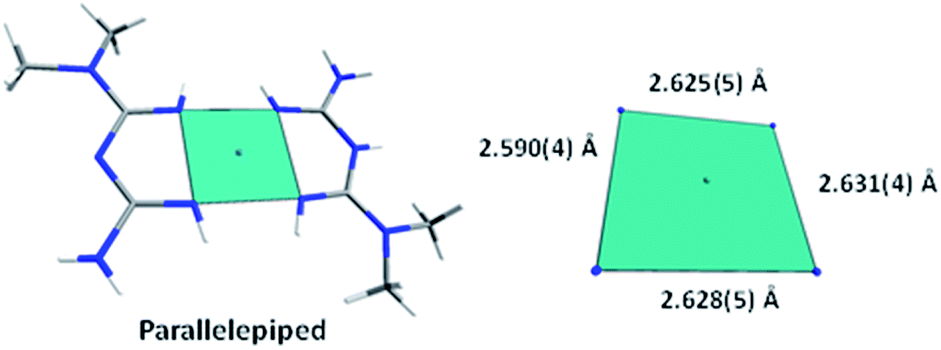 | ||
| Fig. 4 Representation of the conformer A and the coordination polyhedron for the compound 2. | ||
The two conformers observed in the asymmetric unit present slight differences in the size and torsion of the polyhedron edges. The torsion angle values were 0.862(13)° and −0.804(13)° for conformer A and B, respectively. A root-mean-square deviation (RMSD) analysis of the atomic positions of the conformers was performed with a similarity value of 0.025 (Fig. 5).
 | ||
| Fig. 5 Conformer representation and superposition of the conformer A (light green) and B (red), in the compound 2. | ||
In this compound, the deprotonation of metformin (metforminyde anion) in the secondary amine was observed. This deprotonation generates an increase in the imine C![[double bond, length as m-dash]](https://www.rsc.org/images/entities/char_e001.gif) N bond length with values around 1.31 Å in comparison with the neutral ligand (1.29 Å). Furthermore, a decrease in the C1–N3 bond length of the secondary amine with values around 1.35 Å was observed. Also, it was possible to compare the neutral metformin in the compound (2) and the compound [Ni(C4H11N5)2](OH)Cl reported by Lemoine et al.,14 where the CN distances present values of 1.320(9) and 1.307(1) Å, and values of C–N of 1.349(9) and 1.371(8) Å. This behavior indicates a possibility of the formation of three resonant structures (Scheme 1) that stabilize the anion and enable the formation of the complex.
N bond length with values around 1.31 Å in comparison with the neutral ligand (1.29 Å). Furthermore, a decrease in the C1–N3 bond length of the secondary amine with values around 1.35 Å was observed. Also, it was possible to compare the neutral metformin in the compound (2) and the compound [Ni(C4H11N5)2](OH)Cl reported by Lemoine et al.,14 where the CN distances present values of 1.320(9) and 1.307(1) Å, and values of C–N of 1.349(9) and 1.371(8) Å. This behavior indicates a possibility of the formation of three resonant structures (Scheme 1) that stabilize the anion and enable the formation of the complex.
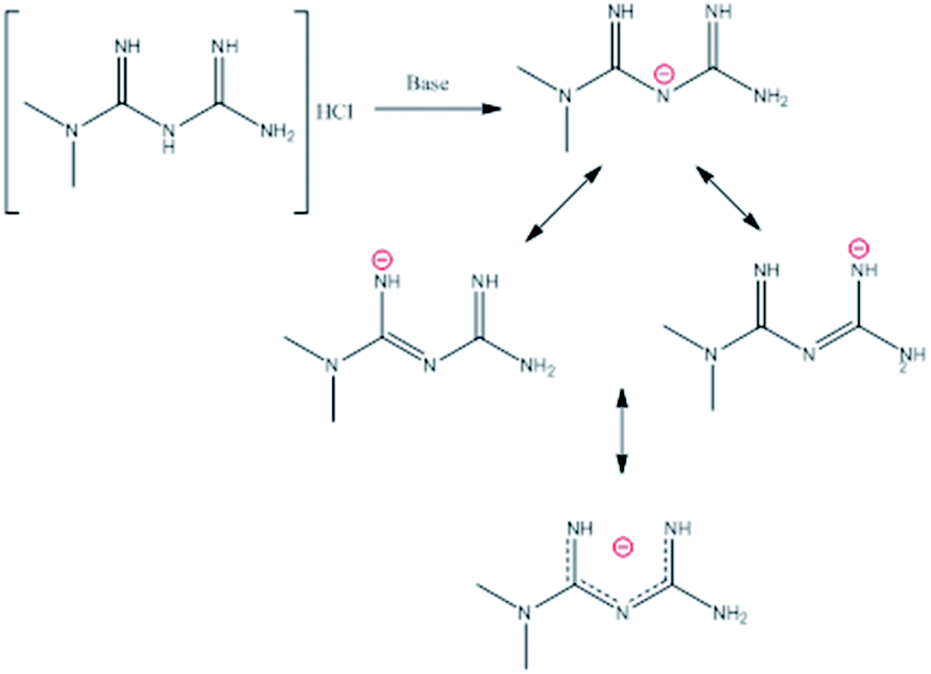 | ||
| Scheme 1 Metformin reaction with and resonant structures of the anion metforminyde. | ||
The crystal packing of the Ni complex is formed by electrostatic interactions between the complex and the chloride anion. Along the [101] direction, the formation of chains by N8–H8⋯O2 and O2–H2D⋯N13 interactions with distances of 2.873(5) and 2.901(4) Å, respectively, was observed. The chains are joined by N–H⋯Cl interactions along [100] and [010] directions with distances around 3.34 Å (Fig. 6).
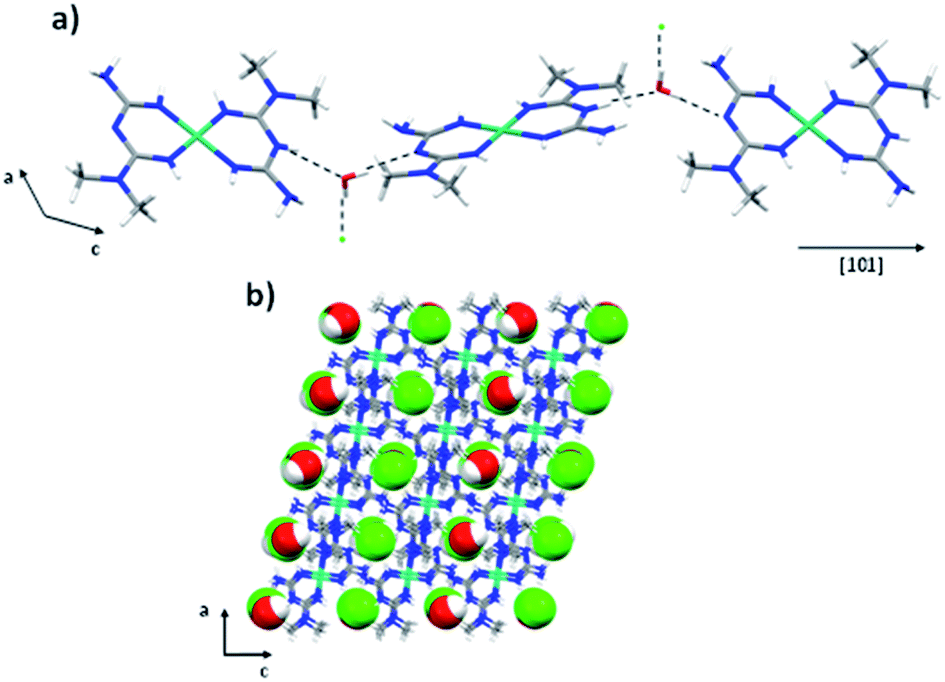 | ||
| Fig. 6 (a) Chains formed along the [101] directions and (b) crystal packing of the [Ni(C4H11N5)2]Cl·H2O compound. | ||
The [Cu(C4H12N5)2]Cl2·H2O compound (3) was obtained as purple crystals, as previously reported by Lemoine et al.14 The asymmetric unit is formed by a half Cu2+ metallic cation located in a symmetry center, which is coordinated by one chelate metformin ligand, one chloride anion as a counter-ion, and one free water molecule. The complex is formed by the coordination of two chelate metformin ligands to generate a four-coordinated rectangular polyhedron (CuN4). In this case, the sizes of the edges are 2.694(6) and 2.781(7) Å for the distances N1–N5 in the same ligand and N5–N1i between the ligands, respectively (Fig. 7).
 | ||
| Fig. 7 Coordination polyhedron for the compound 3. | ||
Similar to the previous cases, the crystal packing is formed by electrostatic interactions between the cationic complex and the chloride anions. In addition, we observed N1–H1⋯O1, O1–H1A⋯Cl1, N2–H2⋯Cl1, and N3–H3⋯Cl1 interactions with distances of 2.977(7), 3.098(5), 3.244(6), and 3.368(5) Å, respectively (Fig. 8a). These interactions allow the formation of layers in the plane (216) (Fig. 8b). The layers stack along the [101] direction by O1–H1B⋯Cl1 interactions with a distance of 3.172(5) Å giving rise to the crystal packing arrangement (Fig. 8c).
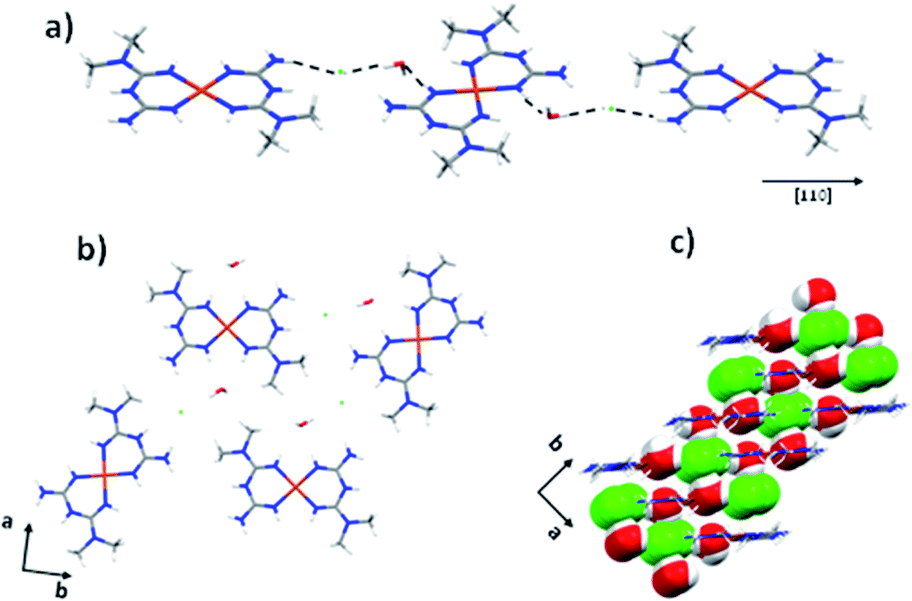 | ||
| Fig. 8 (a) Interactions along [110] direction, (b) layers formed between the complex in the plane (216) and (c) crystal packing for the compound 3. | ||
Finally, the compound [Zn(C4H11N5)Cl3] (4) was obtained as colorless crystals, as previously reported by Zhu et al.16 with one Zn2+ metal coordinated by three chloride anions and one protonated metformin molecule in the asymmetric unit. The final complex presents a tetrahedral (ZnNCl3) arrangement around the Zn center (Fig. 9).
 | ||
| Fig. 9 Coordination polyhedron and distortion of the ligand in the compound 4. | ||
Structurally, distortion in the protonated metformin ligand with a N4–C2–C1–N2 torsion angle of 93.13° is observed in comparison with values around 0° for the ligand in the previous complexes and 119.7° for the hydrochloride of metformin.27 This behavior is due to a double bond loss of the imine and the formation of primary amines that induce a steric effect and distort the ligand (Fig. 9). In contrast to the structure reported by Zhu et al.,16 which proposed the formation of C4H12N5+ with the positive charge centered in the N coordinated to the zinc, indicating the formation of CN+C bond, we observed from the analysis of bond distances, asymmetric values in the C1–N3 and N3–C2 bonds with values of 1.343(3) and 1.378(4) Å, respectively. A N5–C2 bond distance decreasing, with a value of 1.300(3) Å, is associated with the formation of a double bond or resonance structure (Fig. 9).28 Also, we observed distortion in the tetrahedral polyhedron due to differences in the Zn–Cl distances ranging between 2.242–2.259(9) Å, the distance Zn1–N3 with a value of 2.062(2) Å, and values of angles between 106.8–116.4°.
From the supramolecular point of view, the crystal packing is formed mainly by Cl⋯H bonds. The formation of chains by halogen–hydrogen interactions along the [001] direction with N–H⋯Cl distances of 3.368(3), 3.359(3), and 3.726(3) Å was observed (Fig. 10a). The formed chains are joined by N4–H4A⋯Cl1 interactions with a distance of 3.359(3) Å. Finally, along the [010] direction, we also observed halogen interactions N1–H1B⋯Cl3 with a distance of 3.372(2) Å (Fig. 10b) giving rise to the 3D crystal packing (Fig. 10c).
 | ||
| Fig. 10 (a) Cl⋯H interactions along [001] direction, (b) interaction along [100] and [010] direction and (c) crystal packing for the compound 4. | ||
Supramolecular interactions analysis
To understand the supramolecular behavior of the obtained compounds, Hirshfeld surface (HS) and finger print plot analyses were performed. Hirshfeld surface analysis provides information about the regions in the molecule where interactions occur.29 With this tool, it is possible to generate a surface dnorm map that shows (i) the interactions with distances less than the sum of the van der Waals radii as concave red regions and (ii) the interactions equal to or greater than the sum of the van der Waals radii as white and blue regions, respectively.29 In Fig. 11, it is possible to observe in the HS that the red regions are located on the donor–acceptor amine and imine groups. The finger print plots quantify the contribution of each interaction to the crystal packing (Fig. 11).30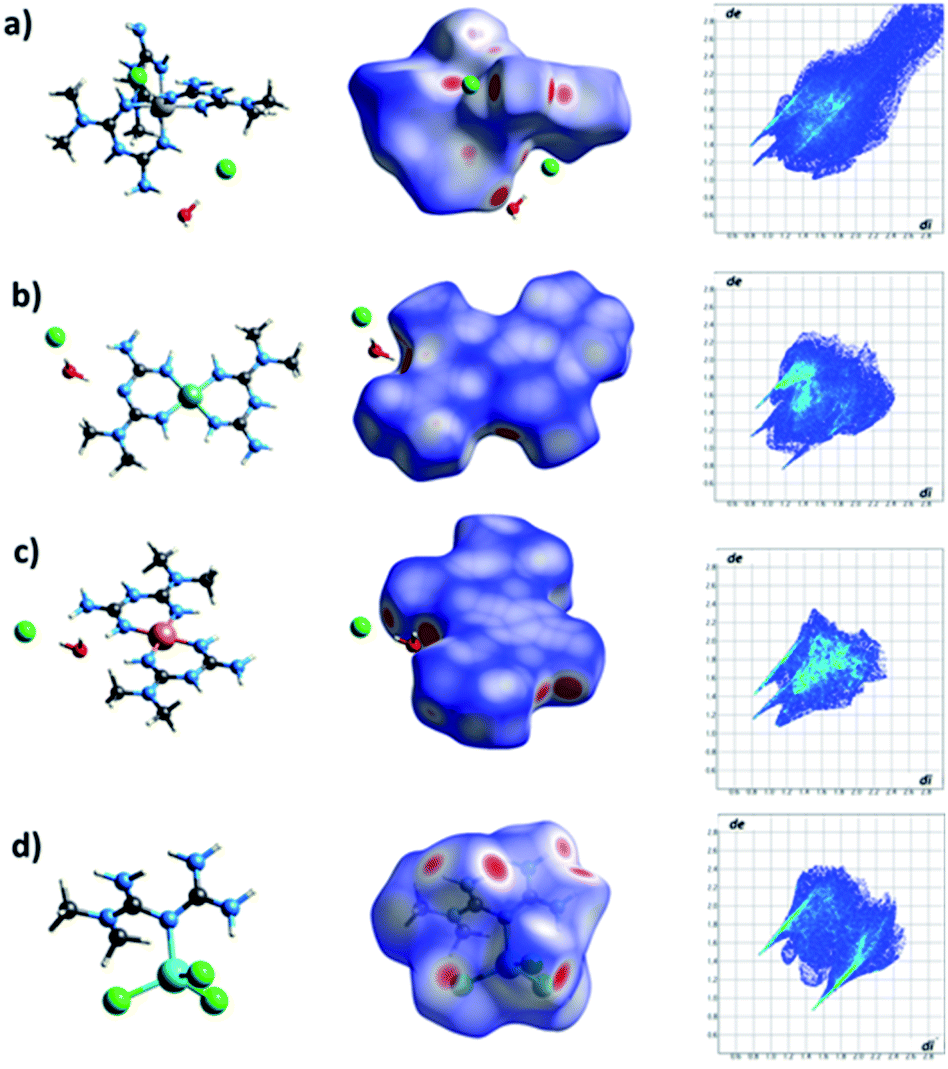 | ||
| Fig. 11 Molecular representation, dnorm Hirshfeld surface and finger print plots for (a) [Co(C4H11N5)3]Cl2·2H2O, (b) [Ni(C4H11N5)(C4H10N5)]Cl·H2O, (c) [Cu(C4H11N5)2]Cl2·H2O and (d) [Zn(C4H12N5)Cl3] compounds. | ||
It is also possible to observe that in all the cases, the strongest and most important contributions to the crystal packing is given for N⋯H, O⋯H, and H⋯Cl interactions, characterized by the presence of narrow peaks in the bottom of the finger print plots. In addition, we observed important interactions, including C⋯H and H⋯H, where the H⋯H interactions are the more abundant interactions in the crystal packing (Fig. 12). Only in the Zn complex, we observed a high contribution of H⋯Cl interactions in the formation of the crystal packing. The different interaction values observed in all cases are characteristic of the nature of each complex and its crystal packing (Fig. 12).
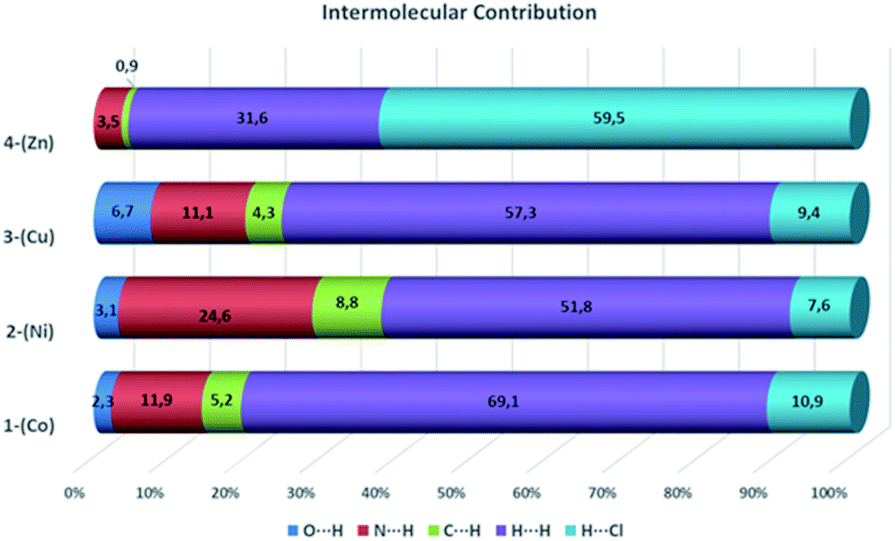 | ||
| Fig. 12 Intermolecular contacts values for (1), (2), (3) and (4) compounds. | ||
Vibrational spectroscopy and thermal analysis
The interpretation of FTIR spectra was performed considering the most important internal vibrations of the functional groups in the complexes (ESI S1‡).31 A N–H stretching vibration of the CN–H group is observed in the region between 3100–3490 cm−1 for all compounds with high intensity.31 In [Co(C4H12N5)3]Cl2·H2O (compound 1), the bands are overlapping by the O–H vibrations of the water molecules present in the structure.32 Two bands with medium-weak intensities in the region around 1470–1540 cm−1 are assigned to in-plane NH2 deformation.31 In the region at 2800–3000 cm−1, we observed symmetric and asymmetric stretching C–H vibrations of the methyl groups. The two peaks at 1570 and 1610 cm−1 are related to asymmetrical and symmetrical CN vibrations. The peaks in the region around 1050–1250 cm−1 are assigned to C–N stretching of the aliphatic amine.31
The metal–metformin complexes show a similar thermal profile (ESI S2‡) with an initial mass loss for free water of 6.87%, 5.8%, and 8.1% (Tonset = 82, 67, 80 °C) for compounds 1, 2, and 3, respectively. These mass losses are in agreement with the calculated values for two water molecules for 1 (6.72%) and 3 (8.3%) and one molecule for 2 (4.9%). The compounds 1, 2, 3, and 4 exhibit a decomposition temperature around 240 °C, 312 °C, 238 °C, and 221 °C (Tonset), respectively.
Cytotoxicity test
C2C12 cell lines (mouse muscle) and HepG2 (human liver carcinoma) are widely used in the evaluation of the potential activity of new molecules with antidiabetic activity or different metabolic activity.33 They are in vitro models that give preliminary information on the activity of specific molecules in reversing metabolic abnormalities in organs and or tissues involved in the establishment of diabetes.34 Cell viability was evaluated using the MTT assay after the treatment of the three different compounds for 4 hours (C2C12) or 48 hours (HepG2) (Fig. 13). Compound 1 (Co) demonstrated a significant reduction (around 50%) in cell viability in both cell lines at concentrations of 500 and 1000 μg mL−1. Compound 2 (Ni) reduced cell viability at concentrations ≥250 μg mL−1 in C2C12 cells and ≥62.5 μg mL−1 in HepG2 cells. Compound 3 (Cu) exhibited toxicity at concentrations ≥500 μg mL−1 in C2C12 cells and at 1000 μg mL−1 in HepG2 cells (Fig. 13). Of note, it is impractical to develop therapeutic agents that must be administered at high concentrations. In addition, cell viability assays consider that a compound is safe, practicability values higher than 80%.35 These results shows that compounds 1–3 exhibit low cytotoxicity at concentrations below 62.5 μg mL−1 (∼0.1 mM), and at a high concentration of 1000 μg mL−1 (∼1.8 mM), the cell viability is reduced in some cases around 50% in both cell lines. These results are consistent with different studies that evaluated the cell viability of metformin,36,37 indicating that the new compounds could potentially be used as safe drugs with minimal side effects. It is important to note that these tests are a preliminary evaluation of the viability of the compounds as safe drugs, and more studies must be conducted in order to know the effect of these molecules on healthy cells and the possible physiopathological mechanisms that intervene in the control of appetite, the increase in body weight and other associated metabolic factors.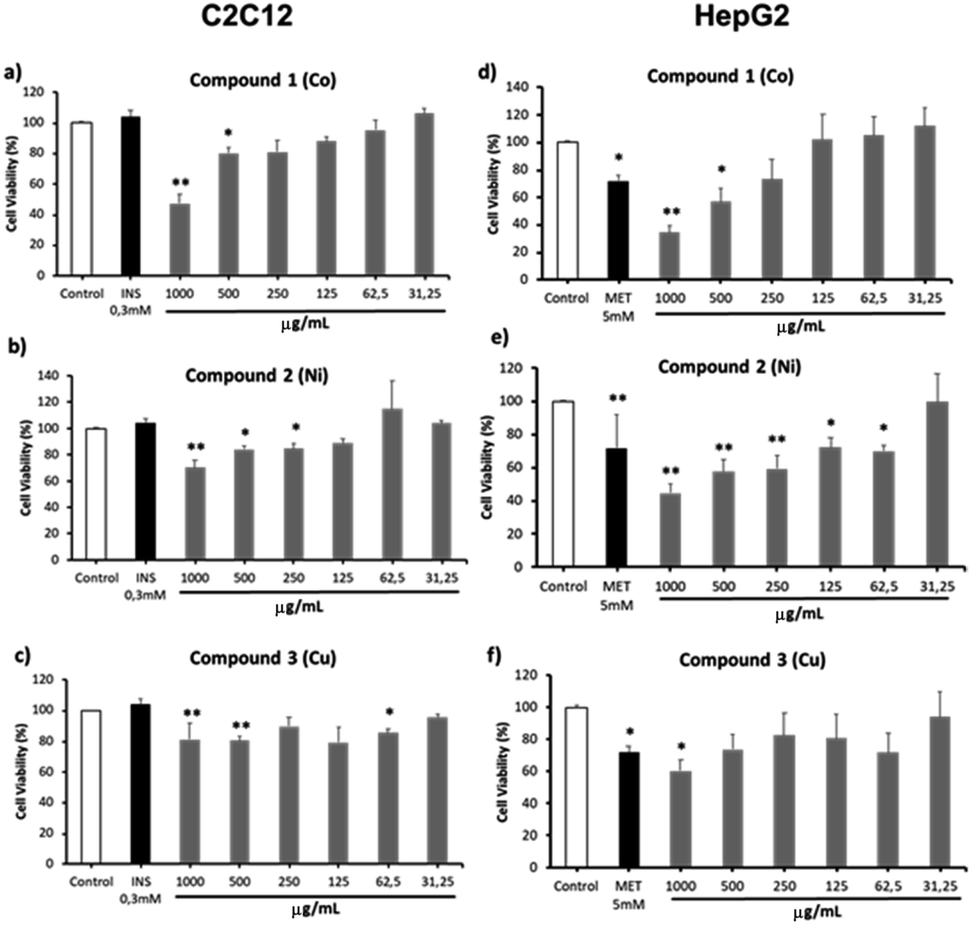 | ||
| Fig. 13 Cytotoxicity of different molecules on cell lines C2C12 and HepG2. Cells seeded in 96-well plates were treated with the molecules for 4 h (C2C12) or 48 h (HepG2). The cytotoxicity was evaluated by MTT assay. Values are expressed as mean ± SEM. ANOVA with post hoc Tukey for multiple comparisons was performed. **p < 0.01; *p < 0.05. n = 3. Insulin 0.3 mM (INS) and metformin 5 mM (MET) are used as positive control. | ||
Conclusions
In this work, we synthesized four compounds from the metformin ligand and divalent transition metals. The structural analysis reveals that all compounds crystalize in the monoclinic crystal system and centrosymmetric space groups, such as C2/c, P21/c, and P21/n. In addition, we observed different coordination modes and structural features of the metformin ligand, which depends on the protonation state of the ligand. For the first time, we reported an octahedral Co–metformin complex and a Ni–metformin–metforminyde planar square complex. The supramolecular analysis based on the Hirshfeld surface showed important differences between Co, Ni, and Cu compounds in comparison with the Zn compound. The three first complexes show a high contribution of H⋯H interactions compared with Zn, which shows a major contribution of H⋯Cl interactions to the crystal packing. In all structures, the N⋯H/H⋯N play an important role in crystal packing in decreasing order of Ni > Co > Cu > Zn. C2C12 and HepG2 cells were treated with the Co, Ni, and Cu compounds, and cell viability was evaluated using the MTT assay. The results demonstrate that the compounds exhibit low cytotoxicity at high concentrations.Conflicts of interest
There are no conflicts to declare.Acknowledgements
All authors acknowledge the Dirección General de Investigaciones from Universidad Santiago de Cali for the financial support (project no. 445-621118-146). S. V.-D. and J. E. are grateful to CAPES and CNPq (proc. #305190/2017-2), respectively, for the research fellowships.Notes and references
- J. Dostou and J. Gerich, Exp. Clin. Endocrinol. Diabetes, 2001, 109, S149–S156 CrossRef CAS PubMed.
- W. Kerner and J. Brückel, Exp. Clin. Endocrinol. Diabetes, 2014, 122, 384–386 CrossRef CAS PubMed.
- G. Rena, D. G. Hardie and E. R. Pearson, Diabetologia, 2017, 60, 1577–1585 CrossRef CAS PubMed.
- S. R. Salpeter, E. Greyber, G. A. Pasternak and E. E. Salpeter, Cochrane Database Syst. Rev., 2010,(4), CD002967 Search PubMed.
- K. D. Mjos and C. Orvig, Chem. Rev., 2014, 114, 4540–4563 CrossRef CAS PubMed.
- A. Sigel, H. Sigel, E. Freisinger and R. K. O. Sigel, Metallo-Drugs: Development and Action of Anticancer Agents, De Gruyter, Zürich, 2018 Search PubMed.
- S. M. Abu-el-Wafa, M. A. El-Ries and F. H. Ahmed, Inorg. Chim. Acta, 1987, 136, 127–131 CrossRef CAS.
- S. S. Sharma, J. V. Ramani, D. P. Dalwadi, J. J. Bhalodia, N. K. Patel, D. D. Patel and R. K. Patel, Eur. J. Chem., 2011, 8, 723491 Search PubMed.
- S. A. Fine and K. J. Kinsella, US Pat., US20070196512A1, 1998.
- A. Levina and P. A. Lay, Dalton Trans., 2011, 40, 11675–11686 RSC.
- G. E. Gomez, R. F. D'Vries, D. F. Lionello, L. M. Aguirre-Diaz, M. Spinosa, C. S. Costa, M. C. Fuertes, R. A. Pizarro, A. M. Kaczmarek, J. Ellena, L. Rozes, M. Iglesias, R. Van Deun, C. Sanchez, M. A. Monge and G. J. A. A. Soler-Illia, Dalton Trans., 2018, 47, 1808–1818 RSC.
- G. L. Pardo Andreu, F. Z. D. Reis, M. González-Durruthy, R. D. Hernández, R. F. D'Vries, W. Vanden Berghe and L. C. Alberici, Toxicol. in Vitro, 2020, 63, 104737 CrossRef CAS PubMed.
- G. Montoya, G. Gutiérrez, R. DVries, J. Ellena and A. J. Panay, J. Mol. Struct., 2018, 1173, 937–941 CrossRef CAS.
- P. Lemoine, M. Chiadmi, V. Bissery, A. Tomas and B. Viossat, Acta Crystallogr., Sect. C: Cryst. Struct. Commun., 1996, 52, 1430–1436 CrossRef.
- M. Zhu, L. Lu, P. Yang and X. Jin, Acta Cryst. E, 2002, 58, m217–m219 CrossRef CAS.
- M. Zhu, L. Lu, X. Jin and P. Yang, Acta Crystallogr., Sect. C: Cryst. Struct. Commun., 2002, 58, m158–m159 CrossRef PubMed.
- CrysAlisPro, Oxford Diffraction/Agilent Technologies Ltd, Yarnton, Oxfordshire, England, 2014 Search PubMed.
- G. Sheldrick, Acta Crystallogr., Sect. A: Cryst. Phys., Diffr., Theor. Gen. Crystallogr., 2015, 71, 3–8 CrossRef PubMed.
- G. Sheldrick, Acta Crystallogr., Sect. C: Struct. Chem., 2015, 71, 3–8 Search PubMed.
- O. V. Dolomanov, L. J. Bourhis, R. J. Gildea, J. A. K. Howard and H. Puschmann, J. Appl. Crystallogr., 2009, 42, 339–341 CrossRef CAS.
- G. Sheldrick, Acta Crystallogr., Sect. A: Cryst. Phys., Diffr., Theor. Gen. Crystallogr., 2008, 64, 112–122 CrossRef CAS PubMed.
- A. Spek, Acta Crystallogr., Sect. D: Biol. Crystallogr., 2009, 65, 148–155 CrossRef CAS PubMed.
- K. Brandenburg and H. Putz, DIAMOND-Crystal and Molecular Structure Visualization, Crystal Impact, Kreuzherrenstr, Bonn, Germany, 2006, vol. 102, p. 53227 Search PubMed.
- C. F. Macrae, I. J. Bruno, J. A. Chisholm, P. R. Edgington, P. McCabe, E. Pidcock, L. Rodriguez-Monge, R. Taylor, J. Van De Streek and P. A. Wood, J. Appl. Crystallogr., 2008, 41, 466–470 CrossRef CAS.
- C. Schmitz-Peiffer, D. L. Craig and T. J. Biden, J. Biol. Chem., 1999, 274, 24202–24210 CrossRef CAS PubMed.
- M. B. Hansen, S. E. Nielsen and K. Berg, J. Immunol. Methods, 1989, 119, 203–210 CrossRef CAS PubMed.
- S. L. Childs, L. J. Chyall, J. T. Dunlap, D. A. Coates, B. C. Stahly and G. P. Stahly, Cryst. Growth Des., 2004, 4, 441–449 CrossRef CAS.
- D. Kathuria, A. A. Bankar and P. V. Bharatam, J. Mol. Struct., 2018, 1152, 61–78 CrossRef CAS.
- J. J. McKinnon, M. A. Spackman and A. S. Mitchell, Acta Crystallogr., Sect. B: Struct. Sci., Cryst. Eng. Mater., 2004, 60, 627–668 CrossRef PubMed.
- M. A. Spackman and J. J. McKinnon, CrystEngComm, 2002, 4, 378–392 RSC.
- S. Gunasekaran, R. K. Natarajan, V. Renganayaki and S. Natarajan, Indian J. Pure Appl. Phys., 2006, 44, 495–500 CAS.
- Infrared and Raman Spectra of Inorganic and Coordination Compounds, ed. K. Nakamoto, JOHN WILEY & SONS, INC., Hoboken, New Jersey, 2009 Search PubMed.
- P. J. Mullen, B. Lüscher, H. Scharnagl, S. Krähenbühl and K. Brecht, Biochem. Pharmacol., 2010, 79, 1200–1209 CrossRef CAS PubMed.
- A. Guillén, S. Granados, K. E. Rivas, O. Estrada, L. F. Echeverri and N. Balcázar, Adv. Pharmacol. Sci., 2015, 2015, 418673 Search PubMed.
- I.O.S., Biological evaluation of medical devices – Part 5: tests for in vitro cytotoxicity. International Organization for Standardization: 2009; p. 34 Search PubMed.
- O. N. Pyaskovskaya, D. L. Kolesnik, A. G. Fedorchuk, G. V. Gorbik and G. I. Solyanik, Exp. Oncol., 2017, 39, 264–268 CrossRef CAS PubMed.
- Z. Gao, Z. Liu, M. Bi, J. Zhang, Z. Han, X. Han, H. Wang, G. Sun and H. Liu, Exp. Ther. Med., 2016, 11, 1700–1706 CrossRef CAS PubMed.
Footnotes |
| † The results reported in this work are under United States Patent and Trademark Office (USPTO) US62884597. |
| ‡ Electronic supplementary information (ESI) available: IR spectra and TGA-DSC analysis for all compounds. CCDC 1998783–1998786. For ESI and crystallographic data in CIF or other electronic format see DOI: 10.1039/d0ra04059b |
| This journal is © The Royal Society of Chemistry 2020 |