 Open Access Article
Solution-processed graphene oxide electrode for supercapacitors fabricated using low temperature thermal reduction†
Hye-Jun Kila,
Kayoung Yunb,
Mak-Eum Yooc,
Seungchul Kim b and
Jin-Woo Park
 *a
*a
aDepartment of Materials Science and Engineering, Yonsei University, Seoul, 03722, Korea. E-mail: jwpark09@yonsei.ac.kr; Fax: +82 2 312 5375; Tel: +82 2 2123 5834
bComputational Science Research Center, Korea Institute of Science and Technology, Seoul 02792, Korea
cVirtual Lab. Inc., Seoul 02792, Korea
First published on 9th June 2020
Abstract
We present a low temperature and solution-based fabrication process for reduced graphene oxide (rGO) electrodes for electric double layer capacitors (EDLCs). Through the heat treatment at 180 °C between the spin coatings of graphene oxide (GO) solution, an electrode with loosely stacked GO sheets could be obtained, and the GO base coating was partially reduced. The thickness of the electrodes could be freely controlled as these electrodes were prepared without an additive as a spacer. The GO coating layers were then fully reduced to rGO at a relatively low temperature of 300 °C under ambient atmospheric conditions, not in any chemically reducing environment. Raman spectroscopy and X-ray photoelectron spectroscopy (XPS) results showed that the changes in oxygen functional groups of GO occurred through the heat treatments at 180 and 300 °C, which clearly confirmed the reduction from GO to rGO in the proposed fabrication process at the low thermal reduction temperatures. The structural changes before and after the thermal reduction of GO to rGO analyzed using Molecular Dynamic (MD) simulation showed the same trends as those characterized using Raman spectroscopy and XPS. An EDLC composed of the low temperature reduced rGO-based electrodes and poly(vinyl alcohol)/phosphoric acid (PVA/H3PO4) electrolyte gel was shown to have high specific capacitance of about 240 F g−1 together with excellent energy and power densities of about 33.3 W h kg−1 and 833.3 W kg−1, respectively. Furthermore, a series of multiple rGO-based EDLCs was shown to have fast charging and slow discharging properties that allowed them to light up a white light emitting diode (LED) for 30 min.
1 Introduction
Graphene is known as an excellent candidate material used as an electrode for electric double layer capacitors (EDLCs) because it has chemical stability, excellent electrical and mechanical properties, and high surface area.1 Electrodes of EDLCs need a high surface area due to their charging and discharging mechanism that stores and consumes the charge generated by the electrochemical reaction occurring through the adsorption and desorption of electrolyte ions at the interface between the electrode and electrolyte.2–4 Chemical vapor deposition (CVD) is the most extensively used method to synthesize graphene sheets.5 However, CVD is an inefficient technique to produce large-area or large-volume graphene sheets.6 Hence, reduced graphene oxide (rGO) has gained significant attention to replace CVD synthesized graphene sheets.7 rGO with similar functional properties to graphene can be easily and inexpensively produced from graphene oxide (GO) in a large quantity using solution processes.8The problem that appears during the solution process using GO aqueous suspension is restacking of GO sheets. The GO sheets exfoliated by sonication are re-stacked as they are coated on the substrate. As a result, the surface area of GO sheets contacting with electrolyte ions diminish and this becomes a critical factor that deteriorates charging capacity of EDLCs.9 Recently, studies related to avoiding the restacking through widening the interval of the GO sheets have been carried out by including the additives as spacer in electrodes.10,11 However, supplementary processes are needed to combine GO sheets and additives. Furthermore, the weight and the electrical resistivity of these electrodes increase and electrode thickness is difficult to control.12,13
These can impede the implementation of ideal EDLCs that has the high specific capacitance and low internal resistance.14 Because the specific capacitance is the amount of charge per the weight or volume of total electrodes, the weight or volume of electrodes are important parameters that determine the specific capacitance of EDLCs.15 Fast charging is also one of the ideal EDLCs features.16 Since the charging and discharging rate increases as the electric charge moves faster, the resistance of the electrode itself should be small.17
Moreover, the power sources that operate these electronics should be light and small due to the increased utilization of the miniaturized and portable electronics. Consequently, the method that preserve the high surface area of electrode without the additives is required for the EDLCs as the power source. Therefore, we designed the fabrication method using heat treatment between the GO spin coatings to control the thickness freely maintaining the large surface area, light-weight and resistance of the electrode.
When the electrode is manufactured through solution process using GO, the conversion of GO to rGO involves either chemical or thermal reduction. The chemical reduction process needs to use harmful and toxic hydrazine reductants and strong acids. Hence, thermal reduction approaches are generally preferred as they are safe and eco-friendly.18,19 Thermal reduction to produce rGO involves heat treatment of the GO to remove its oxygen functional groups and regain the conjugated bonding structure of the carbon atoms.20 To achieve the complete reduction of GO to rGO, previous works by others mostly use very high temperature about 1000 °C inside an inert argon gas or under reducing hydrogen gas environment.7
As CO, CO2 and H2O molecules are generated from the oxygen functional groups of GO at high reduction temperatures under reducing atmosphere, oxygen functional groups are removed and carbon honeycomb structures are broken in GO structure during reduction.21–23 Holes or structural defects in the honeycomb structure of the rGO are formed during the very high temperature thermal reduction resulting in non-desirable electrical conductivities and mechanical properties of the rGO.24,25 Thus, the removal of carbon atoms should be prevented during thermal reduction.
In this study, to solve the problems which are restacking of GO and structural defects of rGO as mentioned above, the low temperature heat treatment of 180 °C between the spin-coatings of GO was investigated and the final reduction of GO was carried out at low temperature 300 °C. By utilizing the heat treatments between the spin-coating steps of GO aqueous suspension, the resulting rGO electrodes with significantly enhanced electrical conductivity were shown to have effective spacing between their component sheets without the additives. The morphology of GO sheets after partial reduction were observed by field emission scanning electron microscopy (FE-SEM). The occurrence of the reduction reaction of GO to rGO induced through our multi-coating step and low temperature processing was confirmed through Raman spectroscopy and XPS analyses. The structural change of GO induced during the thermal reduction was predicted through molecular dynamic (MD) simulation. The electrical conductivity of the low temperature processed rGO electrodes was measured using a four-point probe. The conductive rGO electrode was then effectively used to fabricate EDLCs with poly(vinyl alcohol)/phosphoric acid (PVA/H3PO4) electrolyte gel. The charge storage capacity of EDLCs were measured using cyclic voltammetry and galvanostatic charge/discharge analysis, digital multimeter (DMM) and electrometer.
2 Experimental
2.1 Preparation of rGO electrodes
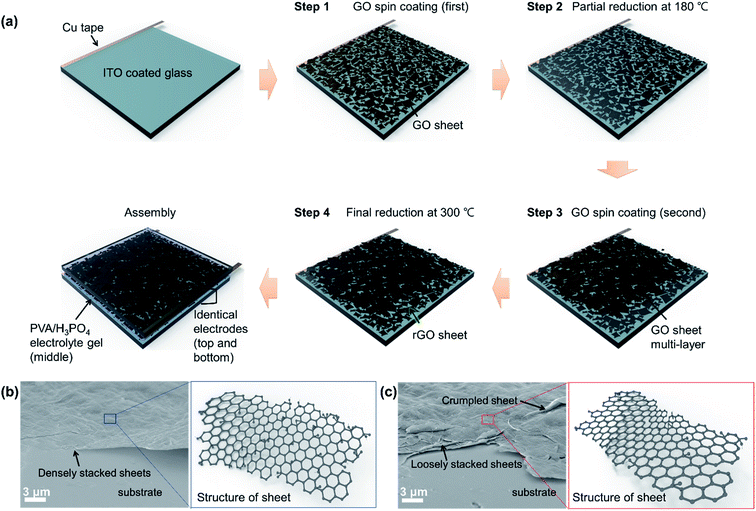
Square glass substrate (2.5 cm by 2.5 cm in dimensions) were coated with the 100 nm-thick Indium Tin Oxide (ITO) current collector using a direct current magnetron sputter. The surface of the ITO current collector was oxygen plasma treated and then the Cu tape connectors were attached at the edge of the substrate as illustrated in Fig. 1(a). GO sheets (Sigma-Aldrich) were dispersed in deionized (DI) water at the weight ratio of 2![[thin space (1/6-em)]](https://www.rsc.org/images/entities/char_2009.gif) :
:![[thin space (1/6-em)]](https://www.rsc.org/images/entities/char_2009.gif) 1 GO sheets to DI water through sonication for 20 min. The GO aqueous solution was then coated on the substrates using a spin-coater at 100 rpm for 30 s. The DI water was then dried from first GO coating at 90 °C for 15 min. The dried first GO coating was partially reduced using the intermediate heat treatment step at 180 °C for 15 min prior to the coating of the final GO coating. The sequentially applied GO coatings were then reduced to rGO at 300 °C for 30 min.
1 GO sheets to DI water through sonication for 20 min. The GO aqueous solution was then coated on the substrates using a spin-coater at 100 rpm for 30 s. The DI water was then dried from first GO coating at 90 °C for 15 min. The dried first GO coating was partially reduced using the intermediate heat treatment step at 180 °C for 15 min prior to the coating of the final GO coating. The sequentially applied GO coatings were then reduced to rGO at 300 °C for 30 min.
2.2 Characterization of rGO electrode
Three types of rGO-type electrodes enumerated in Table 1 were initially prepared according to the partial and full application of the fabrication steps presented in Fig. 1(a) in order to find the ideal fabrication process to prepare the electrodes of EDLCs. The O-rGO electrode in Table 1 was prepared by thermally reducing a single GO coating at 300 °C by doing only step 1 and 4 in Fig. 1(a). C-rGO in Table 1 was prepared by thermally reducing two GO coatings at 300 °C without applying the intermediate heat treatment at 180 °C or all of the processing sequence in Fig. 1(a) was performed except for step 2. PR-rGO in Table 1 was prepared following all the fabrication steps shown in Fig. 1(a). The thickness and sheet resistance of the rGO-type electrodes presented in Table 1 were measured using a surface profiler (DektakXT, Bruker, Co.) and a four-point probe, respectively. The conductivities of the rGO-type electrodes were calculated according to Ohm's law using the thickness and sheet resistance data.| Electrode type | The number of coatings | Thickness (nm) | Sheet resistance (Ω □−1) | Conductivity (S cm−1) |
|---|---|---|---|---|
| O-rGO | 1 | 102 | 794 | 123 |
| C-rGO | 2 | 222 | 237 | 190 |
| PR-rGO | 2 | 226 | 128 | 346 |
The surface morphology of GO sheet was observed using FE-SEM (JSM-7001F, JEOL, Ltd.). The extent of the reduction of the GO coatings to rGO was determined using Raman spectrometry (using ND:Yag laser with 532 nm light wavelength in LabRam Aramis from Horriba Jovin Yvon, Inc.) and XPS (K-alpha from Thermo U.K., Ltd. using a monochromatic Al Kα 1486.6 eV X-ray source).
2.3 Computational details
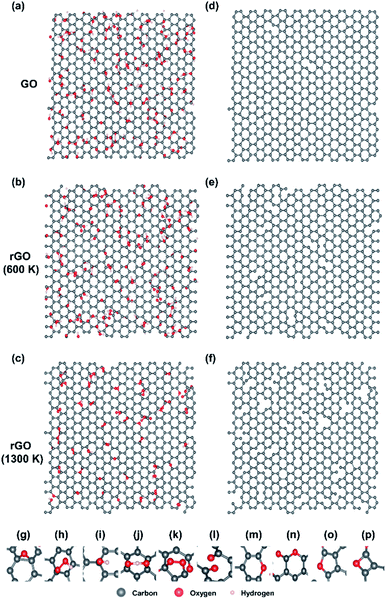
In atomic-level simulations such as molecular dynamics (MD), the reliability of the simulation results depends on the accuracy of the force field or the interatomic potential, which describes interactions between atoms in a system. The reactive force field (ReaxFF) can dynamically show complex chemical reactions or phase transformations of hydrocarbons.26 We investigated the initial evolution of thermal reduction of GO by using the ReaxFF parameters optimized by Chenoweth et al.27 and large-scale atomic/molecular massively parallel simulator (LAMMPS) code.28 We used periodically repeated graphene sheet, of which size is 4.3 nm in x- and 3.7 nm in y-axes, and functional groups were randomly placed to model GO. The initial GO structure contains approximately 30 atomic percent (at%) of oxygen contents composed of 77 at% hydroxyl, 15 at% carbonyl and 8 at% epoxy molecules based on our XPS results (Fig. 3). Before simulating reduction process at high temperature, we first relaxed a GO sheet at room temperature during 6.25 ps (Fig. 4(a)) to make the structure more realistic. In the annealing simulations, the temperature of system was heated from 300 K to target temperature (600 and 1300 K) with heating rate of 26.7 K ps−1, and then maintained the temperature during 1 ns. Finally, the reduced GO sheet was annealed at room temperature during 6.25 ps after quenching. All MD simulations were performed under a constant volume and temperature condition (canonical ensemble) with a Berendsen thermostat, and a time step of 0.25 fs.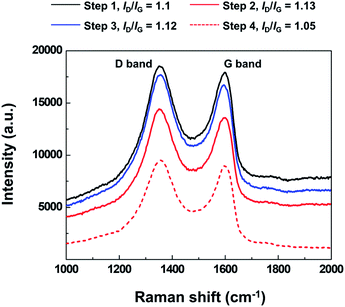 | ||
| Fig. 2 Raman spectra of the GO coatings processed at different stages of the multi-step fabrication of PR-rGO as shown in Fig. 1. | ||
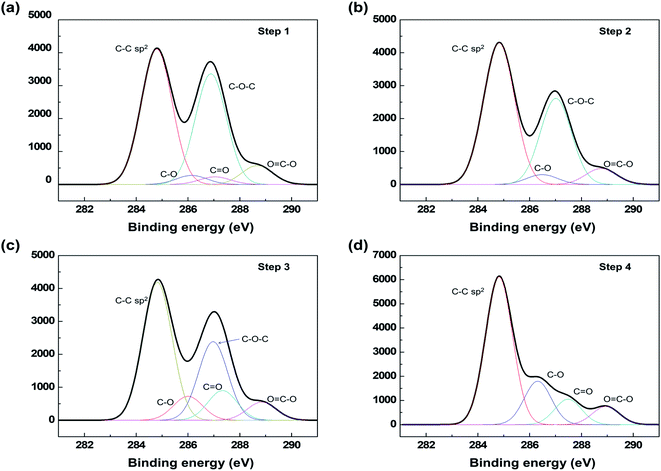 | ||
Fig. 3 C1s core level XPS analysis results showing the changes in oxygen functional groups during electrode preparation depicted in Fig. 1(a). Oxygen functional groups listed in the graphs are hydroxyl (C–O), epoxy (C–O–C), carbonyl (C![[double bond, length as m-dash]](https://www.rsc.org/images/entities/char_e001.gif) O) and carboxyl (O O) and carboxyl (O![[double bond, length as m-dash]](https://www.rsc.org/images/entities/char_e001.gif) C–O). C–O). | ||
2.4 Fabrication of the solid-state EDLC with electrolyte gel
3 M H3PO4 aqueous solution was stirred at 80 °C for 5 min. PVA (Mw 89![[thin space (1/6-em)]](https://www.rsc.org/images/entities/char_2009.gif) 000–98
000–98![[thin space (1/6-em)]](https://www.rsc.org/images/entities/char_2009.gif) 000, 99+% hydrolyzed, Sigma-Aldrich) was added into the H3PO4 aqueous solution and then, the stirring was carried out until the electrolyte gel became transparent. The electrolyte gel was drop on a rGO electrode and were covered with another rGO electrode. The three types of rGO electrode/electrolyte gel/rGO electrode EDLCs based on the electrodes presented in Table 1 were then dried at 60 °C for about 24 hours.
000, 99+% hydrolyzed, Sigma-Aldrich) was added into the H3PO4 aqueous solution and then, the stirring was carried out until the electrolyte gel became transparent. The electrolyte gel was drop on a rGO electrode and were covered with another rGO electrode. The three types of rGO electrode/electrolyte gel/rGO electrode EDLCs based on the electrodes presented in Table 1 were then dried at 60 °C for about 24 hours.
2.5 Electrochemical measurements of the EDLCs
To evaluate the inherent electrical capacity of the EDLCs with electrodes described in Table 1, cyclic voltammetry (CV) and galvanostatic charge and discharge (GCD) were measured using an electrochemical measurement equipment (IviumStat, Ivium Technologies B.V.). The voltage variations in the EDLCs when they were charged using a 9 V battery and discharged by powering a white LED were identified using a digital multimeter (DMM 6500, Tektronix, Inc.) and electrometer (Keithley 6514, Tektronix, Inc.). The specific capacitance (Cs) of the EDLCs expressed in the unit of F g−1 were calculated from the GCD graph according to following equation,29
 | (1) |
 | (2) |
 | (3) |
3 Results and discussion
The schematic diagram of the fabrication process of the rGO-based electrodes and EDLC prepared in this study is shown in Fig. 1(a). As depicted in Fig. 1(a), a multiple-step coating of the GO solution with an optimized concentration was used to prevent the agglomeration of the GO sheets. In step 2 shown in Fig. 1(a), the intermediate heat treatment at 180 °C after the coating of the first layer of GO sheets was used as the partial reduction procedure that is supported by the Raman spectroscopy and XPS data presented later in Fig. 2 and 3, respectively. According to the FE-SEM analysis of the as-coated and partially reduced GO sheets shown in Fig. 1(b) and (c), respectively, the partial reduction at 180 °C resulted in the crumpled and loosely stacked sheets.If multiple layers of GO sheets are continuously coated on top of each other without the intermediate heat treatment shown in Fig. 1(a), the dense restacking of the GO sheets will automatically occur due to the strong van der Waals interaction between the sheets.31 The dense restacking of the GO sheets will then decrease the effective surface area of the rGO electrodes.9 rGO electrodes with closely stacked sheets have significantly reduced the diffusion pathways for the electrolyte ions in the EDLC and thus, decrease the capacitive properties of the EDLC.32 According to Fig. 1(b), the GO sheets were almost flat and densely stacked in step 1. The intermediate heat treatment or partial reduction at 180 °C (step 2 in Fig. 1(a)) was confirmed to loosen the stacking of the crumpled GO sheets as shown in Fig. 1(c). The loosely stacked and crumpled morphology of the GO sheets (step 2 in Fig. 1(a) and (c)) then decreased the probability of the second GO coating (step 3 in Fig. 1(a)) to densely stack on the first GO layer.
The final thermal reduction of the multiple-step coated GO was achieved at 300 °C (step 4 in Fig. 1(a)). As described in Table 1, the PR-rGO electrode (Table 1) prepared using the combined intermediate heat treatment at 180 °C and relatively low reduction temperature at 300 °C showed a sheet resistance of about 128 Ω sq−1. or equivalent to the electrical conductivity of 346 S cm−1. Having these electrical properties, the PR-rGO electrode was shown to be appropriate for EDLC applications as discussed in Fig. 5–7. The PR-rGO as the electrodes to the EDLC was fabricated without the use of very high temperature treatment reaching 800 to 1000 °C for complete reduction of GO to rGO.
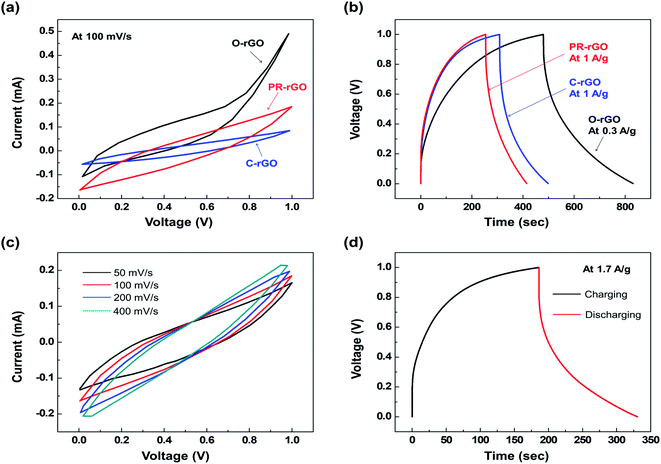 | ||
| Fig. 5 (a) Cyclic voltammetry (CV) curves at 100 mV s−1, and (b) galvanostatic charging and discharging (GCD) graph showing the performance of EDLCs with electrodes described in Table 1. PR-rGO (c) CV curves at varying scan rate conditions, and (d) GCD graph at the current density of 1.7 A g−1. | ||
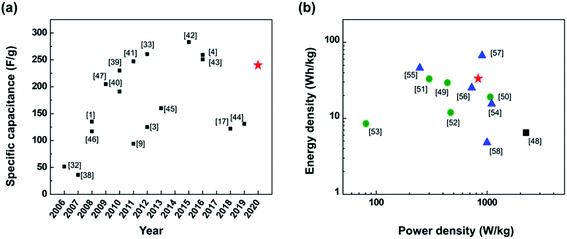 | ||
| Fig. 6 SC performance of devices with carbon material-based electrodes and aqueous electrolyte. (a) Specific capacitance of EDLCs published in literature since 2006.1,3,4,9,17,32,33,38–47 (b) Ragone plot of the energy and power densities of SC reported over the last three years (since 2017).48–58 The black solid square represents the SC made of rGO electrode reduced at very high temperature around 900 °C (ref. 48) while the data for green solid circles are from of SCs with electrodes made from rGO-based nanocomposite electrodes with CNT or activated carbon.49–53 The blue solid triangles represent performances of hybrid SCs that used both electric double layer capacitance and pseudocapacitance structures.54–58 The red solid star in both (a) and (b) represents the performance of the PR-rGO-type EDLC. | ||
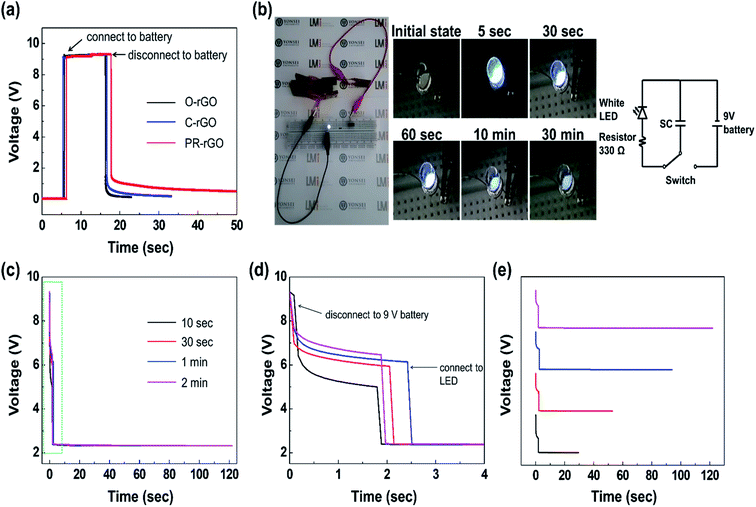 | ||
| Fig. 7 (a) The voltage variation with time across the EDLCs with electrodes described in Table 1 during the charging (from a 9 V battery as the power source for 10 s) and discharging measurements. (b) Photographs showing changes in the light emission of an LED connected to a series of eight PR-rGO-type EDLCs charged by a 9 V battery as the power source for 10 s. The video of the LED light emission variation with time is provided as the ESI.† (c) The voltage variation with time during the discharging of eight EDLCs connected in series charged at varying duration (10 s, 30 s, 1 min, and 2 min) using a 9 V battery as the power source. (d) The enlarged graph of the data plot enclosed by the green broken line box in (c). (e) The vertically transposed graphs of the voltage variation with time presented in (c) to show the elapsed time for the voltage to drop down to 2.14 V. | ||
Fig. 2 shows the Raman spectroscopy analysis of the spin-coated and heat-treated at 180 °C layers of GO and rGO sheets in relation to the processing stages presented in Fig. 1(a). The changes in the carbon bonds of the GO structure and reduction level of the GO coatings induced by the heat treatment steps in Fig. 1(a) were analyzed using Raman spectroscopy. The D band peak at 1360 cm−1 in Fig. 2 was related to the defects in honeycomb structure pertaining to the sheet edges, vacancies, and amorphous carbon. The increasing presence of the oxygen functional groups in the GO sheets will induce higher D peak intensity in the Raman spectrum.
The G band appearing at about 1600 cm−1 in the Raman spectrum relates to the sp2 carbon bonds.33
The Raman spectrum ratio of the D band intensity (ID) to the G band intensity (IG) (ID/IG) gives the qualitative comparison of the defect density in the GO structure with the number sp2 carbon bonds.34 Therefore, the decrease in ID/IG indicates the increase in the removal of the oxygen functional groups.30 Furthermore, the decrease of Raman spectrum intensity is closely related to the decrease in the number of material impurities, voids, and the destruction of symmetry.35,36
As shown in Fig. 2, the ID/IG of step 2 was similar to that of step 1 but the D and G band peak intensities of step 2 were significantly lower than that of step 1. These results indicate that the sheet became symmetric through structural changes associated with the release of the oxygen functional groups and the absence of hole formation in the sheet during the intermediate heat treatment at 180 °C. After the second GO coating was applied, the Raman spectrum of step 3 shows the increase of D and G band peak intensities in connection with the addition of GO sheets containing oxygen functional groups.
The ID/IG acquired after the step 4 of the fabrication process in Fig. 1 was the lowest among the measurements presented in Fig. 2, which confirms that the significant removal of the oxygen functional groups occurred during the 300 °C heat treatment compared to the previous stages of the fabrication process of the PR-rGO. Furthermore, the decreased Raman intensity in step 4 implies that the sp2 carbon bonds were maintained and impurities were removed during the low temperature reduction of GO to rGO resulting in sheets having structures very close to those of graphene.
Fig. 3 shows the XPS C1s spectra measured at the different stages of the PR-rGO electrode fabrication illustrated in Fig. 1(a). The XPS C1s spectra allow the determination of the binding state of the sample surface and presence of oxygen functional groups.35 According to Fig. 3(a) and (b), the intermediate heat treatment of the GO coatings at 180 °C resulted in the decrease in the intensity of C–O–C peak at 286.8 eV and disappearance of the C![[double bond, length as m-dash]](https://www.rsc.org/images/entities/char_e001.gif) O peak at 287.3 eV suggesting that step 2 in Fig. 1(a) results into the partial reduction of the GO coating. As shown in Fig. 3(c), the C
O peak at 287.3 eV suggesting that step 2 in Fig. 1(a) results into the partial reduction of the GO coating. As shown in Fig. 3(c), the C![[double bond, length as m-dash]](https://www.rsc.org/images/entities/char_e001.gif) O peak appeared again, and the C–O peak intensity increased due to the second GO coating added in step 3. The significant changes in the XPS C1s spectra in Fig. 3(d) indicated the reduction of GO to rGO in step 4 of the fabrication process. The C–C sp2 peak intensity was significantly increased and the C–O–C peak disappeared after the thermal reduction at 300 °C.
O peak appeared again, and the C–O peak intensity increased due to the second GO coating added in step 3. The significant changes in the XPS C1s spectra in Fig. 3(d) indicated the reduction of GO to rGO in step 4 of the fabrication process. The C–C sp2 peak intensity was significantly increased and the C–O–C peak disappeared after the thermal reduction at 300 °C.
It is quite difficult to directly observe the structures of rGO sheets and their defects such as holes. The transmission electron microscopy (TEM) requires a monolayer sheet difficult to produce. Also, the electron beam of TEM can generate defects during the operation. The series of MD simulations, therefore, was performed to predict the evolution of the reduction process of rGO and the atomic structures after reduction at 600 K and 1300 K. The initial structure of GO (Fig. 4(a)) contains epoxy, carbonyl, hydroxyl, hydroperoxyl and OHO radicals. During the 600 K reduction, oxygen functional groups are removed from the sheet by forming H2O or H2O2. There is no change in the number of carbon atoms, and the sheet is maintained as the honeycomb structure. During the 1300 K reduction; however, oxygen contents are detached by producing not only H2O, H2O2, but also CO, CO2. The number of carbon atoms have decreased, and then defects such as hole, pyran, pyron, furan and oxete have increased. Although high temperature reduction can remove a lot of oxygen contents, broken honeycomb structure will degrade the sheet performance. Low temperature reduction can recover sp2 bonding and electrical conductivity. Similar to the Raman and XPS results, our simulation results confirmed that the reduction occurred at the low temperature of 300 °C. In addition, we found out that the mechanism of thermal reduction of rGO at low and high temperature is different.
Fig. 5(a) and (b) show the CV and GCD measurement results, respectively, used to compare the performance of the EDLCs with O-rGO, C-rGO, and PR-rGO electrodes described in Table 1. The EDLC performance was expected to be affected by the changes in the carbon structure and oxygen functional group bonding in the GO induced during the electrode fabrication using the low temperature thermal reduction. As shown in Fig. 5(a), the area enclosed by the CV curve of the O-rGO-type EDLC was predominantly above the zero-current level in the 0 to 1 V applied voltage range. As the area of the CV curve above and below the current of 0 mA are related to the amount of electrical energy charge and discharge, respectively, O-rGO-type EDLC showed unbalanced charging and discharging performance, and thus, it cannot function effectively as an EDLC.
The area enclosed by the CV curve of the O-rGO-type EDLC in the 0.8 to 1 V voltage range follows the Ohm's law In the O-rGO electrode, the GO solution was only coated once and that the GO coating did not cover the entire surface of the ITO current collector. Hence, in the O-rGO-type EDLC, the ITO current collector and the electrolyte formed undesirable electrical contacts, which resulted in electrical shorts and ineffective charging of the EDLC.
Fig. 5(a) shows that C-rGO- and PR-rGO-type EDLCs with electrodes formed using two coatings of GO (refer to Table 1) had balanced charging and discharging regions as well as the enhanced operation in the voltage range from 0.8 to 1 V as compared with O-rGO-type EDLC. C-rGO- and PR-rGO-type EDLCs did not exhibit any Ohm's law behavior in CV curve from 0.8 to 1 V operating voltage since the two thicker GO coatings of the their electrodes ensured the full coverage of the ITO current collector and that the ITO current collector did not form any electrical shorts with the electrolyte of the EDLCs. The PR-rGO-type EDLC showed a significantly wider CV curve area than the C-rGO-type EDLC as presented in Fig. 5(a). This enhanced charging and discharging performance of the PR-rGO-type EDLC was attributed to the effective interaction of the electrolyte ions and its electrodes brought by the loosely stacked sheets of the electrodes prepared with the intermediate heat treatment to induce partial reduction as discussed in Fig. 1–4.
Fig. 5(b) shows the GCD graph of the EDLCs with the three types of electrodes described in Table 1. It was only possible to measure GCD of O-rGO-type EDLC at the maximum current density of 0.3 A g−1, while C-rGO- and PR-rGO-type EDLCs were injected with current densities reaching up to 1 and 1.7 A g−1, respectively. This limited applied current density to O-rGO-type EDLC implied that it had lower charge and discharge efficiencies as compared with the C-rGO- and PR-rGO-type EDLCs. As shown in Fig. 5(b), although the discharge time of PR-rGO-type EDLC when measured at the same current density of 1 A g−1 was similar to that of C-rGO-type EDCL, the charging time of PR-rGO-type EDLC was about 50 s shorter. This is because the PR-rGO electrode was composed of loosely stacked sheets due to intermediate heat treatment. The space between the sheets in the PR-rGO electrodes allowed greater contact area between the electrolyte ions and the electrodes ensuring faster electrical charge flow as compared with that of the C-rGO electrode and definitely with that of the O-rGO electrode.
Fig. 5(c) and (d) show the results from the detailed evaluation of the PR-rGO EDLC performance due to the desired rGO structure obtained using the process illustrated in Fig. 1(a). According to Fig. 5(c), the increasing scan rate from 50 to 400 mV s−1 did not vary the shape of the CV curve of the PR-rGO-type EDLC. These narrow CV curves appear when the electrolyte ions migrate quickly to and from the EDLC electrodes.37 Since the electrodes and electrolyte gel of the PR-rGO-type EDLC were very thin, very fast transport of electrolyte ions was possible.
The GCD graph of the PR-rGO-type EDLC presented in Fig. 5(d) was used to determine the its performance. As shown in Fig. 5(d), PR-rGO-type EDLC had a discharging time of about 145 s at the current density of 1.7 A g−1. Accordingly, PR-rGO-type EDLC had the specific capacitance of 240 F g−1, energy density of 33.3 W h kg−1, and power density of 833.3 W kg−1.
According to Fig. 6(a), the specific capacitance of the PR-rGO-type EDLC at around 240 F g−1 satisfies the expectation set by the performance trend of EDLCs with carbon material-based electrodes published in the literature since 2006.1,3,4,9,17,32,33,38–47 Previous studies have either used expensive equipment to reduce GO to rGO at very high temperature of about 1000 °C under an environment of hydrogen gas1 or used toxic substances to induce the chemical reduction of GO to rGO.46 Others had improved the specific capacitance of the EDLCs through the increase in the contact area between the electrolyte and the electrode by first widening the space between the GO sheets using additives.9 It is then noteworthy to emphasize that the approach presented in this study have resulted into EDLC with high specific capacitance despite using very low reduction temperature of 300 °C under ambient atmospheric conditions. This is because the dense restacking of GO sheets was prevented through the intermediate heat treatment at 180 °C of the GO coatings.
Fig. 6(b) is a Ragone plot comparing the performances of the SCs including EDLC-only devices and hybrid SCs reported the last three years since 2017.48–58 A Ragone plot helps in the visualization on how SCs have balanced performance in terms of their energy and power densities, which generally have a tradeoff relationship. Hence, significant number of research works were aimed to increase both the energy and power densities of the SCs. Inclusion of carbon material-based additives or nitrogen doping were then used to prevent the dense restacking of the GO sheets to increase the surface area of the EDLC electrodes and improved EDLC performance.49–53 Other studies have produced hybrid SCs by combining the electrodes used in EDLCs and pseudocapacitors.54–58 On the contrary, the PR-rGO-type EDLC fabricated in this current work showed excellent and balance performance in both energy and power densities (red solid star data point in Fig. 6(b)) despite the fact that the electrodes were only composed of rGO sheets and reduced at low temperature.
Fig. 7(a) shows the charging and discharging performance of the O-rGO-, C-rGO-, and PR-rGO-type EDLCs when attached and disconnected from a 9 V battery acting the power source. The initial internal voltage drop across the three type of EDLCs was 0.1 V before they were attachment of the battery power source. The voltage across the rGO-, C-rGO-, and PR-rGO-type EDLCs then remained at 9 V while they were being charged with a 9 V battery. Consequently, the PR-rGO-type EDLC took the longest time to fully discharge after being detached from the 9 V battery. This result agrees very well with data presented in Fig. 5(a) such that charge and discharge area of the CV plot of PR-rGO-type EDLC was the largest among the EDLCs with electrodes described in Table 1.
The photographs presented in Fig. 7(b) were taken from the LED powered by eight PR-rGO EDLCs connected in series as described by the circuit diagram. A ESI Video† is provided for Fig. 7(b) showing the light emission of LED powered by the PR-rGO EDLCs. The eight PR-rGO-type EDLCs were first charge using a 9 V battery for 10 s and then, connected to the LED with 2.5 V forward voltage requirement. The eight PR-rGO-type EDLCs were able to lit up the LED since there total voltage after being charged and disconnected from the 9 V battery was significantly higher than the 2.5 V forward voltage requirement of the LED. As shown in Fig. 7(b), the LED showed very bright light emissions for about 5 s after its initial connection with the eight EDLCs. The LED emission then gradually faded with time for 30 min Fig. 7(e) shows that the discharge time increased with prolonged charging duration of the eight PR-rGO-type EDLCs connected to the LED shown in the Fig. 7(b).
4 Conclusions
An intermediate heat treatment of the multiple GO coatings was shown to prevent the dense restacking of the GO sheets coated using solution-based method without the use of additives as spacers. The intermediate heat treatment at 180 °C had partially reduced the base GO coating resulting into the GO sheets forming crumpled shapes that promoted their loose stacking. It was also shown through Raman spectroscopy and XPS analysis that the low temperature thermal reduction at 300 °C have removed significant amount of the oxygen functional groups from the GO sheets while maintaining the sp2 bonds of the carbon atoms in the resulting rGO. These results correspond to the MD structural simulation showing the removal of oxygen atoms from the GO sheets and minimal formation of defects in the sp2 bonds at 300 °C. rGO-based electrode prepared using the low temperature reduction of the loosely stacked GO sheets was then successfully used in the fabrication of an EDLC with excellent specific capacitance of about 240 F g−1 with energy and power densities of 33.3 W h kg−1 and 833.3 W kg−1, respectively. A system of multiple rGO-based EDLCs fabricated in this work was then shown to have fast charging and long discharging characteristics allowing its successful usage as the power source to light up an LED.Conflicts of interest
There are no conflicts to declare.Acknowledgements
This research was supported by the Basic Science Research Program through the National Research Foundation of Korea (NRF) and funded by the Ministry of Science, ICT & Future Planning (grant number 2018R1A2B6001390).References
- M. D. Stoller, S. Park, Y. Zhu, J. An and R. S. Ruoff, Nano Lett., 2008, 8, 3498–3502 CrossRef CAS PubMed.
- P. Simon and Y. Gogotsi, Philos. Trans. R. Soc., A, 2010, 368, 3457–3467 CrossRef CAS PubMed.
- C. Merlet, B. Rotenberg, P. A. Madden, P.-L. Taberna, P. Simon, Y. Gogotsi and M. Salanne, Nat. Mater., 2012, 11, 306–310 CrossRef CAS PubMed.
- D. Tang, S. Hu, F. Dai, R. Yi, M. L. Gordin, S. Chen, J. Song and D. Wang, ACS Appl. Mater. Interfaces, 2016, 8, 6779–6783 CrossRef CAS PubMed.
- M. P. Lavin-Lopez, J. L. Valverde, S. Ordoñez-Lozoya, A. Paton-Carrero and A. Romero, Mater. Chem. Phys., 2019, 222, 173–180 CrossRef CAS.
- L. Lin, H. Peng and Z. Liu, Nat. Mater., 2019, 18, 520–524 CrossRef CAS PubMed.
- Y. Huang, J. Liang and Y. Chen, Small, 2012, 8, 1805–1834 CrossRef CAS PubMed.
- S. Park and R. S. Ruoff, Nat. Nanotechnol., 2009, 4, 217–224 CrossRef CAS PubMed.
- Y. Wang, Y. Wu, Y. Huang, F. Zhang, X. Yang, Y. Ma and Y. Chen, J. Phys. Chem. C, 2011, 115, 23192–23197 CrossRef CAS.
- C. Yu, P. Ma, X. Zhou, A. Wang, T. Qian, S. Wu and Q. Chen, ACS Appl. Mater. Interfaces, 2014, 6, 17937–17943 CrossRef CAS PubMed.
- L. G. Beka, X. Li, X. Wang, C. Han and W. Liu, RSC Adv., 2019, 9, 26637–26645 RSC.
- V. Presser, L. Zhang, J. J. Niu, J. McDonough, C. Perez, H. Fong and Y. Gogotsi, Adv. Energy Mater., 2011, 1, 423–430 CrossRef CAS.
- K. Rana, K. N. Mahesh, J. H. Ahn and V. P. Singh, 2016, DOI:10.1109/iciinfs.2016.8262982, 448–451.
- Z. S. Iro, C. Subramani and S. Dash, Int. J. Electrochem. Sci., 2016, 11, 10628–10643 CrossRef CAS.
- B. Andres, A.-C. Engström, N. Blomquist, S. Forsberg, C. Dahlström and H. Olin, PLoS One, 2016, 11, e0163146 CrossRef PubMed.
- P. Simon and Y. Gogotsi, Nat. Mater., 2008, 7, 845–854 CrossRef CAS PubMed.
- E. A. Kiseleva, M. A. Zhurilova, S. A. Kochanova, E. J. Shkolnikov, A. B. Tarasenko, O. V. Zaitseva, O. V. Uryupina and G. V. Valyano, J. Phys.: Conf. Ser., 2018, 946, 012030 CrossRef.
- S. Park, J. An, J. R. Potts, A. Velamakanni, S. Murali and R. S. Ruoff, Carbon, 2011, 49, 3019–3023 CrossRef CAS.
- I. K. Moon, J. Lee, R. S. Ruoff and H. Lee, Nat. Commun., 2010, 1, 1–6 Search PubMed.
- M. Acik, G. Lee, C. Mattevi, M. Chhowalla, K. Cho and Y. J. Chabal, Nat. Mater., 2010, 9, 840–845 CrossRef CAS PubMed.
- M. Acik, G. Lee, C. Mattevi, A. Pirkle, R. M. Wallace, M. Chhowalla, K. Cho and Y. Chabal, J. Phys. Chem. C, 2011, 115, 19761–19781 CrossRef CAS.
- L. Song, F. Khoerunnisa, W. Gao, W. H. Dou, T. Hayashi, K. Kaneko, M. Endo and P. M. Ajayan, Carbon, 2013, 52, 608–612 CrossRef CAS.
- H. C. Schniepp, J.-L. Li, M. J. McAllister, H. Sai, M. Herrera-Alonso, D. H. Adamson, R. K. Prud'Homme, R. Car, D. A. Saville and I. A. Aksay, J. Phys. Chem. B, 2006, 110, 8535–8539 CrossRef CAS PubMed.
- H. Feng, R. Cheng, X. Zhao, X. Duan and J. Li, Nat. Commun., 2013, 4, 1539 CrossRef PubMed.
- R. Rozada, J. I. Paredes, M. J. López, S. Villar-Rodil, I. Cabria, J. A. Alonso, A. Martínez-Alonso and J. M. D. Tascón, Nanoscale, 2015, 7, 2374–2390 RSC.
- A. C. T. Van Duin, S. Dasgupta, F. Lorant and W. A. Goddard, J. Phys. Chem. A, 2001, 105, 9396–9409 CrossRef CAS.
- K. Chenoweth, A. C. T. Van Duin and W. A. Goddard, J. Phys. Chem. A, 2008, 112, 1040–1053 CrossRef CAS PubMed.
- S. Plimpton, Fast parallel algorithms for short-range molecular dynamics, Sandia National Labs., Albuquerque, NM, United States, 1993 Search PubMed.
- X. Li, L. Jiang, C. Zhou, J. Liu and H. Zeng, NPG Asia Mater., 2015, 7, e165 CrossRef CAS.
- M. Duraivel, S. Nagappan, B. Balamuralitharan, S. Selvam, S. N. Karthick, K. Prabakar, C.-S. Ha and H.-J. Kim, New J. Chem., 2018, 42, 11093–11101 RSC.
- J. Li and M. Östling, Crystals, 2013, 3, 163–190 CrossRef CAS.
- B. Fang and L. Binder, J. Phys. Chem. B, 2006, 110, 7877–7882 CrossRef CAS PubMed.
- B. Zhao, P. Liu, Y. Jiang, D. Pan, H. Tao, J. Song, T. Fang and W. Xu, J. Power Sources, 2012, 198, 423–427 CrossRef CAS.
- Y. Shen, T. Jing, W. Ren, J. Zhang, Z.-G. Jiang, Z.-Z. Yu and A. Dasari, Compos. Sci. Technol., 2012, 72, 1430–1435 CrossRef CAS.
- F. Yin, S. Wu, Y. Wang, L. Wu, P. Yuan and X. Wang, J. Solid State Chem., 2016, 237, 57–63 CrossRef CAS.
- D. E. Milovzorov, Electric Field, 2018, 91, 119–143 Search PubMed.
- R. Rajagopal and K.-S. Ryu, New J. Chem., 2019, 43, 12987–13000 RSC.
- V. L. Pushparaj, M. M. Shaijumon, A. Kumar, S. Murugesan, L. Ci, R. Vajtai, R. J. Linhardt, O. Nalamasu and P. M. Ajayan, Proc. Natl. Acad. Sci. U. S. A., 2007, 104, 13574–13577 CrossRef CAS PubMed.
- Q. Du, M. Zheng, L. Zhang, Y. Wang, J. Chen, L. Xue, W. Dai, G. Ji and J. Cao, Electrochim. Acta, 2010, 55, 3897–3903 CrossRef CAS.
- Y. Zhu, S. Murali, M. D. Stoller, A. Velamakanni, R. D. Piner and R. S. Ruoff, Carbon, 2010, 48, 2118–2122 CrossRef CAS.
- J. J. Yoo, K. Balakrishnan, J. Huang, V. Meunier, B. G. Sumpter, A. Srivastava, M. Conway, A. L. Mohana Reddy, J. Yu, R. Vajtai and P. M. Ajayan, Nano Lett., 2011, 11, 1423–1427 CrossRef CAS PubMed.
- Y. Xu, C.-Y. Chen, Z. Zhao, Z. Lin, C. Lee, X. Xu, C. Wang, Y. Huang, M. I. Shakir and X. Duan, Nano Lett., 2015, 15, 4605–4610 CrossRef CAS PubMed.
- Y. Bai, X. Yang, Y. He, J. Zhang, L. Kang, H. Xu, F. Shi, Z. Lei and Z.-H. Liu, Electrochim. Acta, 2016, 187, 543–551 CrossRef CAS.
- O. Qian, D. Lin, X. Zhao and F. Han, Chem. Lett., 2019, 48, 824–827 CrossRef CAS.
- J. Chen, R. L. Shepherd, J. M. Razal, X. Huang, W. Zhang, J. Zhao, A. T. Harris, S. Wang, A. I. Minett and H. Zhang, ACS Appl. Mater. Interfaces, 2013, 5, 7676–7681 CrossRef CAS PubMed.
- S. R. C. Vivekchand, C. S. Rout, K. S. Subrahmanyam, A. Govindaraj and C. N. R. Rao, J. Chem. Sci., 2008, 120, 9–13 CrossRef CAS.
- Y. Wang, Z. Shi, Y. Huang, Y. Ma, C. Wang, M. Chen and Y. Chen, J. Phys. Chem. C, 2009, 113, 13103–13107 CrossRef CAS.
- B. Xing, R. Yuan, C. Zhang, G. Huang, H. Guo, Z. Chen, L. Chen, G. Yi, Y. Zhang and J. Yu, Fuel Process. Technol., 2017, 165, 112–122 CrossRef CAS.
- A. Kumar, N. Kumar, Y. Sharma, J. Leu and T. Y. Tseng, Nanoscale Res. Lett., 2019, 14, 266–283 CrossRef PubMed.
- B. S. Kim, K. Lee, S. Kang, S. Lee, J. B. Pyo, I. S. Choi, K. Char, J. H. Park, S.-S. Lee, J. Lee and J. G. Son, Nanoscale, 2017, 9, 13272–13280 RSC.
- H. H. Shi, S. Jang, A. Reza-Ugalde and H. E. Naguib, ACS Appl. Energy Mater., 2020, 3, 987–997 CrossRef CAS.
- J. Wang, Q. Li, C. Peng, N. Shu, L. Niu and Y. Zhu, J. Power Sources, 2020, 450, 227611 CrossRef CAS.
- R. Yuksel, B. Yarar Kaplan, E. Bicer, A. Yurum, S. Alkan Gursel and H. E. Unalan, Int. J. Energy Res., 2018 DOI:10.1002/er.4103.
- S. Sundriyal, V. Shrivastav, M. Sharma, S. Mishra and A. Deep, J. Alloys Compd., 2019, 790, 377–387 CrossRef CAS.
- S. Alagar, R. Madhuvilakku, R. Mariappan and S. Piraman, J. Power Sources, 2019, 441, 227181 CrossRef CAS.
- K. Oh, G. Gund and H. Park, J. Mater. Chem. A, 2018, 6, 22106–22114 RSC.
- B. G. Amin, J. Masud and M. Nath, RSC Adv., 2019, 9, 37939–37946 RSC.
- Z. H. Luan, Y. Tian, L. G. Gai, H. H. Jiang, X. M. Guo and Y. Yang, J. Alloys Compd., 2017, 729, 9–18 CrossRef CAS.
Footnote |
| † Electronic supplementary information (ESI) available: Performance comparison of supercapacitor with carbon-based electrodes. See DOI: 10.1039/d0ra03985c |
| This journal is © The Royal Society of Chemistry 2020 |

