
 Open Access Article
 This Open Access Article is licensed under a Creative Commons Attribution-Non Commercial 3.0 Unported Licence
A highly transparent humidity sensor with fast response speed based on α-MoO3 thin films†
Hailong Maa,
Huajing Fang *a,
Wenting Wua,
Cheng Zhengb,
Liangliang Wub and
Hong Wang*c
*a,
Wenting Wua,
Cheng Zhengb,
Liangliang Wub and
Hong Wang*c
aState Key Laboratory for Mechanical Behavior of Materials, School of Material Science and Engineering, Xi'an Jiaotong University, Xi'an 710049, China. E-mail: fanghj@xjtu.edu.cn
bSchool of Electronic and Information Engineering, State Key Laboratory for Mechanical Behavior of Materials, Xi'an Jiaotong University, Xi'an 710049, China
cDepartment of Materials Science and Engineering, Shenzhen Engineering Research Center for Novel Electronic Information Materials and Devices, Southern University of Science and Technology, Shenzhen 518055, China. E-mail: wangh6@sustech.edu.cn
First published on 6th July 2020
Abstract
Metal oxide based humidity sensors are important indicators in environmental monitoring. However, most of them are non-transparent and have a long response time, which cannot meet the application of real-time humidity sensing in transparent electronics. Here, we report a metal oxide humidity sensor based on chemically synthesized molybdenum oxide (α-MoO3) thin films. By a green reaction in an ice water bath, the stable precursor containing nanocrystalline colloids was obtained. Molybdenum oxide films with controllable morphology were fabricated through one-step spin coating. The α-MoO3 based humidity sensor exhibits extremely high transparency (85%) in the visible region and has short response and recovery times (0.97 and 12.11 s). In addition, it also shows high sensitivity, good logarithmic linearity and selectivity in a wide relative humidity range of 11% to 95%. The mechanism of humidity sensing was further studied by complex impedance spectroscopy. This novel metal oxide humidity sensor combined with high transparency and fast response speed is expected to broaden the application ranges of humidity sensors.
Introduction
As an important indicator of environmental monitoring, humidity refers to the content of water molecules in the air.1 The magnitude of humidity is usually characterized by relative humidity (RH), which represents the ratio of the partial pressure of water vapor in the air to the saturated water vapor pressure at a certain temperature.2 Humidity measurement and control are significant for industrial production, crop management, anti-corrosion of devices, human comfort and health, etc.3 Therefore, humidity sensors with good performance, such as high sensitivity, fast response speed, good linearity and selectivity are widely required.4,5 Various types of materials, such as polymers, carbon materials, ceramics, metal oxides and composites have been extensively studied for humidity sensing.6–11 For example, Peng et al. demonstrated an inkjet-printed flexible humidity sensor based on a Ti3C2/Ag hybrid film for touchless sensing.10 Reddy et al. fabricated a nanocomposite of magnesium ferrite and molybdenum oxide with increased intergranular pores for humidity sensing at room temperature.11 Kim et al. synthesized the wafer-scale molybdenum oxide film by plasma enhanced chemical vapor deposition which shows a sensitive response to humidity.12 Among them, the metal oxides are mainly porous sintered bodies based on the traditional ceramic processes, which possess mature preparation process, good physical, chemical and thermal stability as well as porous structure that is easy to adsorb water molecules, thus endowing the metal oxide-based humidity sensors the excellent stability, good response reversibility, high mechanical strength and low manufacturing cost.2 However, at the same time they usually suffer from long response and recovery times (about tens of seconds to a few minutes),12,13 which limits their application in real-time humidity sensing.On the other hand, transparent electronics have recently become a research hotspot to realize next generation “see-through” smart devices.14–16 As one of the most common electronic devices, sensors those can convert different environmental information into electrical signals are the key enablers of the internet of things (IoT). Undoubtedly, the extra “see-through” feature adapts transparent sensors to special occasions and broadens their application area.17 For example, transparent sensors can be integrated on the displays or windows with little impact on the original functions. Recently, Ren et al. developed a sensitive graphene sensor with a high transparency which can used as 24 h continuous intraocular pressure monitoring.18 Lu et al. reported a flexible and transparent humidity sensor with cellulose based ionic film which can be integrated in a wearable skin moisture detector.19 However, most reported metal oxide based humidity sensors are non-transparent, which greatly limits their application where the optical transparency is required.20,21 Therefore, the development of transparent metal oxide based humidity sensors with high performance is of great significance.
In this work, we demonstrated a transparent humidity sensor based on α-MoO3 thin films prepared by a low-cost and facile solution method. The device exhibits a high transmittance in the visible range (85%) as well as short response and recovery times (0.97 and 12.11 s). Moreover, this humidity sensor also possesses high sensitivity, good humidity selectivity and logarithmic linearity. The combination of fast response and high transparency suggests that α-MoO3 thin film may be a good candidate for next generation transparent electronics that require real-time humidity sensing.
Experimental section
Materials
Molybdenum powder (99 wt%) and hydrogen peroxide (30 wt%) were purchased from Sinopharm Chemical Reagent Co. Ltd., China. Deionized water was produced by a laboratory ultrapure water manufacturing system (UPH-I-20). The laser-etched FTO glass substrate (with 180 μm stripe electrodes and 70 μm spacing) was purchased from South China Xiangcheng Technology Co. Ltd.Device fabrication
2 g of molybdenum powder was slowly added to a beaker containing 20 ml of hydrogen peroxide while continuously stirring with a glass rod. The mixture was cooled in an ice water bath to slow down the violent reaction. The yellow suspension obtained by the reaction was allowed to settle for 24 h, and then the supernatant was taken for filtration. The resulting solution was diluted with deionized water at a volume ratio of 1![[thin space (1/6-em)]](https://www.rsc.org/images/entities/char_2009.gif) :2 to improve the transparency of the subsequently prepared films. To fabricate the humidity sensor, the laser-etched FTO glass substrate was washed sequentially with acetone, ethanol and deionized water. Then the as-prepared solution was spin-coated on FTO glass at 4000 rpm for 20 s. The sample was subsequently baked on a 120 °C hot plate for 5 minutes. Finally, the device was annealed at 450 °C for 2 h to allow a complete formation of the α-MoO3 thin film.
:2 to improve the transparency of the subsequently prepared films. To fabricate the humidity sensor, the laser-etched FTO glass substrate was washed sequentially with acetone, ethanol and deionized water. Then the as-prepared solution was spin-coated on FTO glass at 4000 rpm for 20 s. The sample was subsequently baked on a 120 °C hot plate for 5 minutes. Finally, the device was annealed at 450 °C for 2 h to allow a complete formation of the α-MoO3 thin film.
Measurement and characterization
The crystal structure of the prepared film was identified by X-ray diffraction (XRD, X'Pert Pro) with Cu Kα radiation. Raman spectrum of the α-MoO3 thin film was obtained by a Raman spectroscopy (LabRAM HR Evolution) with a 532 nm laser. The elements and chemical states of the film are analyzed via X-ray photoemission spectroscopy (XPS, ESCALAB Xi+). The morphology of the nanocrystals was observed by transmission electron microscopy (TEM, JEOL JEM-F200HR). The morphology of the film was observed by scanning electron microscopy (SEM, Zeiss Gemini500). The transmittance of the device was tested by a spectrophotometer (Mapada V-1600PC). All thin film characterization tests were performed with the substrate. In order to eliminate the influence of the substrate, the thickness of the film was increased by multi-layer spin coating during XRD and Raman tests. The humidity sensing test was carried out in six closed chambers containing saturated solutions of LiCl, MgCl2, NiCl2, NaCl, KCl and KNO3, and the corresponding RH values were 11%, 33%, 54%, 75%, 85%, 95%, respectively. The complex impedance spectroscopies were obtained through an electrochemical workstation (Zahner Zennium pro). To test the response and recovery times, the air with a certain RH was drawn out from the closed chambers containing saturated salt solutions through an injector and sprayed against the film surface. All electrical measurements were carried out through a digital sourcemeter (Keithley 2410).Results and discussion
The precursor of α-MoO3 was prepared by a redox reaction between molybdenum powder and hydrogen peroxide, as described below:| Mo + 4H2O2 → MoO3·H2O2 (H2MoO5) + 3H2O | (1) |
The reaction is an exothermic process. To suppress self-acceleration, the reactants were mixed slowly in an ice water bath. Fig. 1a shows the yellow supernatant obtained after the redox reaction. When irradiated with a green laser beam, a significant Tyndall effect can be observed. It indicates that the H2MoO5 product exists in a colloidal state. We observed the morphology of H2MoO5 through a transmission electron microscope (TEM). As shown in Fig. 1b, the H2MoO5 nanocrystals demonstrate a size of less than 20 nm on average. Furthermore, high resolution TEM shown in inset of Fig. 1b shows the labeled lattice fringes, which fully proves the good crystallinity of the H2MoO5 product. Moreover, colloids of these H2MoO5 nanocrystals are stable for several months, bringing convenience to the subsequent solution processing.
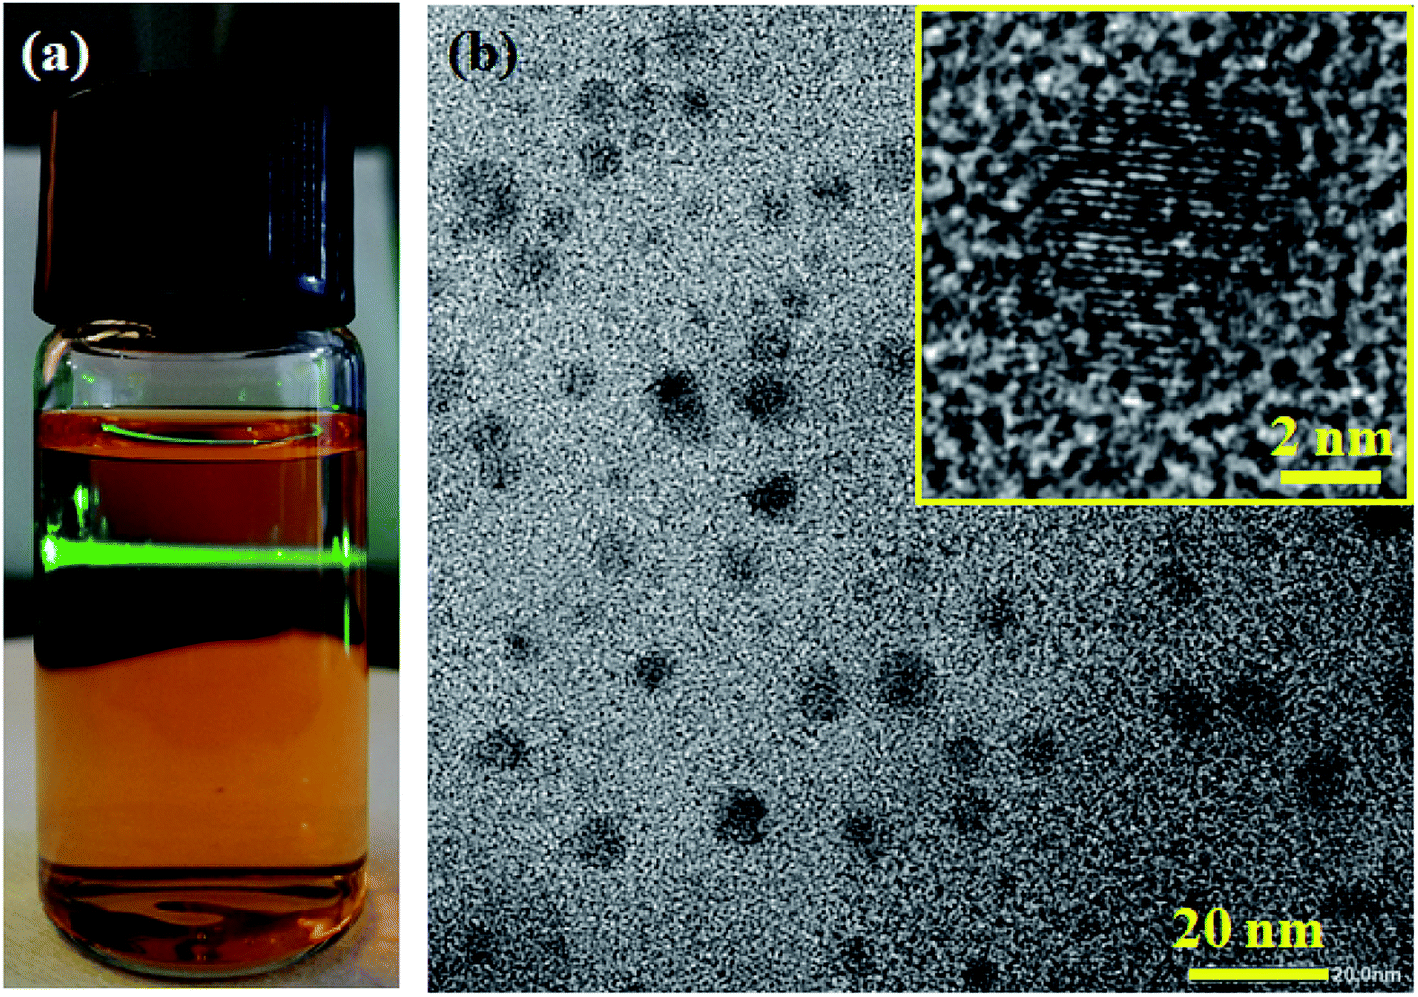 | ||
| Fig. 1 (a) The photograph of the as-prepared precursor. (b) TEM image of the nanocrystals, inset is a high resolution TEM image of a single nanocrystal. | ||
Moisture-sensitive α-MoO3 thin film was prepared by a simple spin coating method. Fig. 2a shows the X-ray diffraction (XRD) patterns of the prepared films before and after annealing. The phase before annealing was identified as H2MoO5 (PDF#41-359), which indicates that α-MoO3 cannot be directly generated by the reaction of hydrogen peroxide and molybdenum powder under this experimental condition. After annealing at 450 °C, all the diffraction peaks coincide with the standard XRD profile of orthorhombic α-MoO3 (PDF#05-0508), and the high intensity of diffraction peaks indicates the good crystallinity. The above thermal decomposition process can be described by the following chemical reaction equation.
| 2MoO3·H2O2 (H2MoO5) → 2MoO3 + 2H2O + O2↑ | (2) |
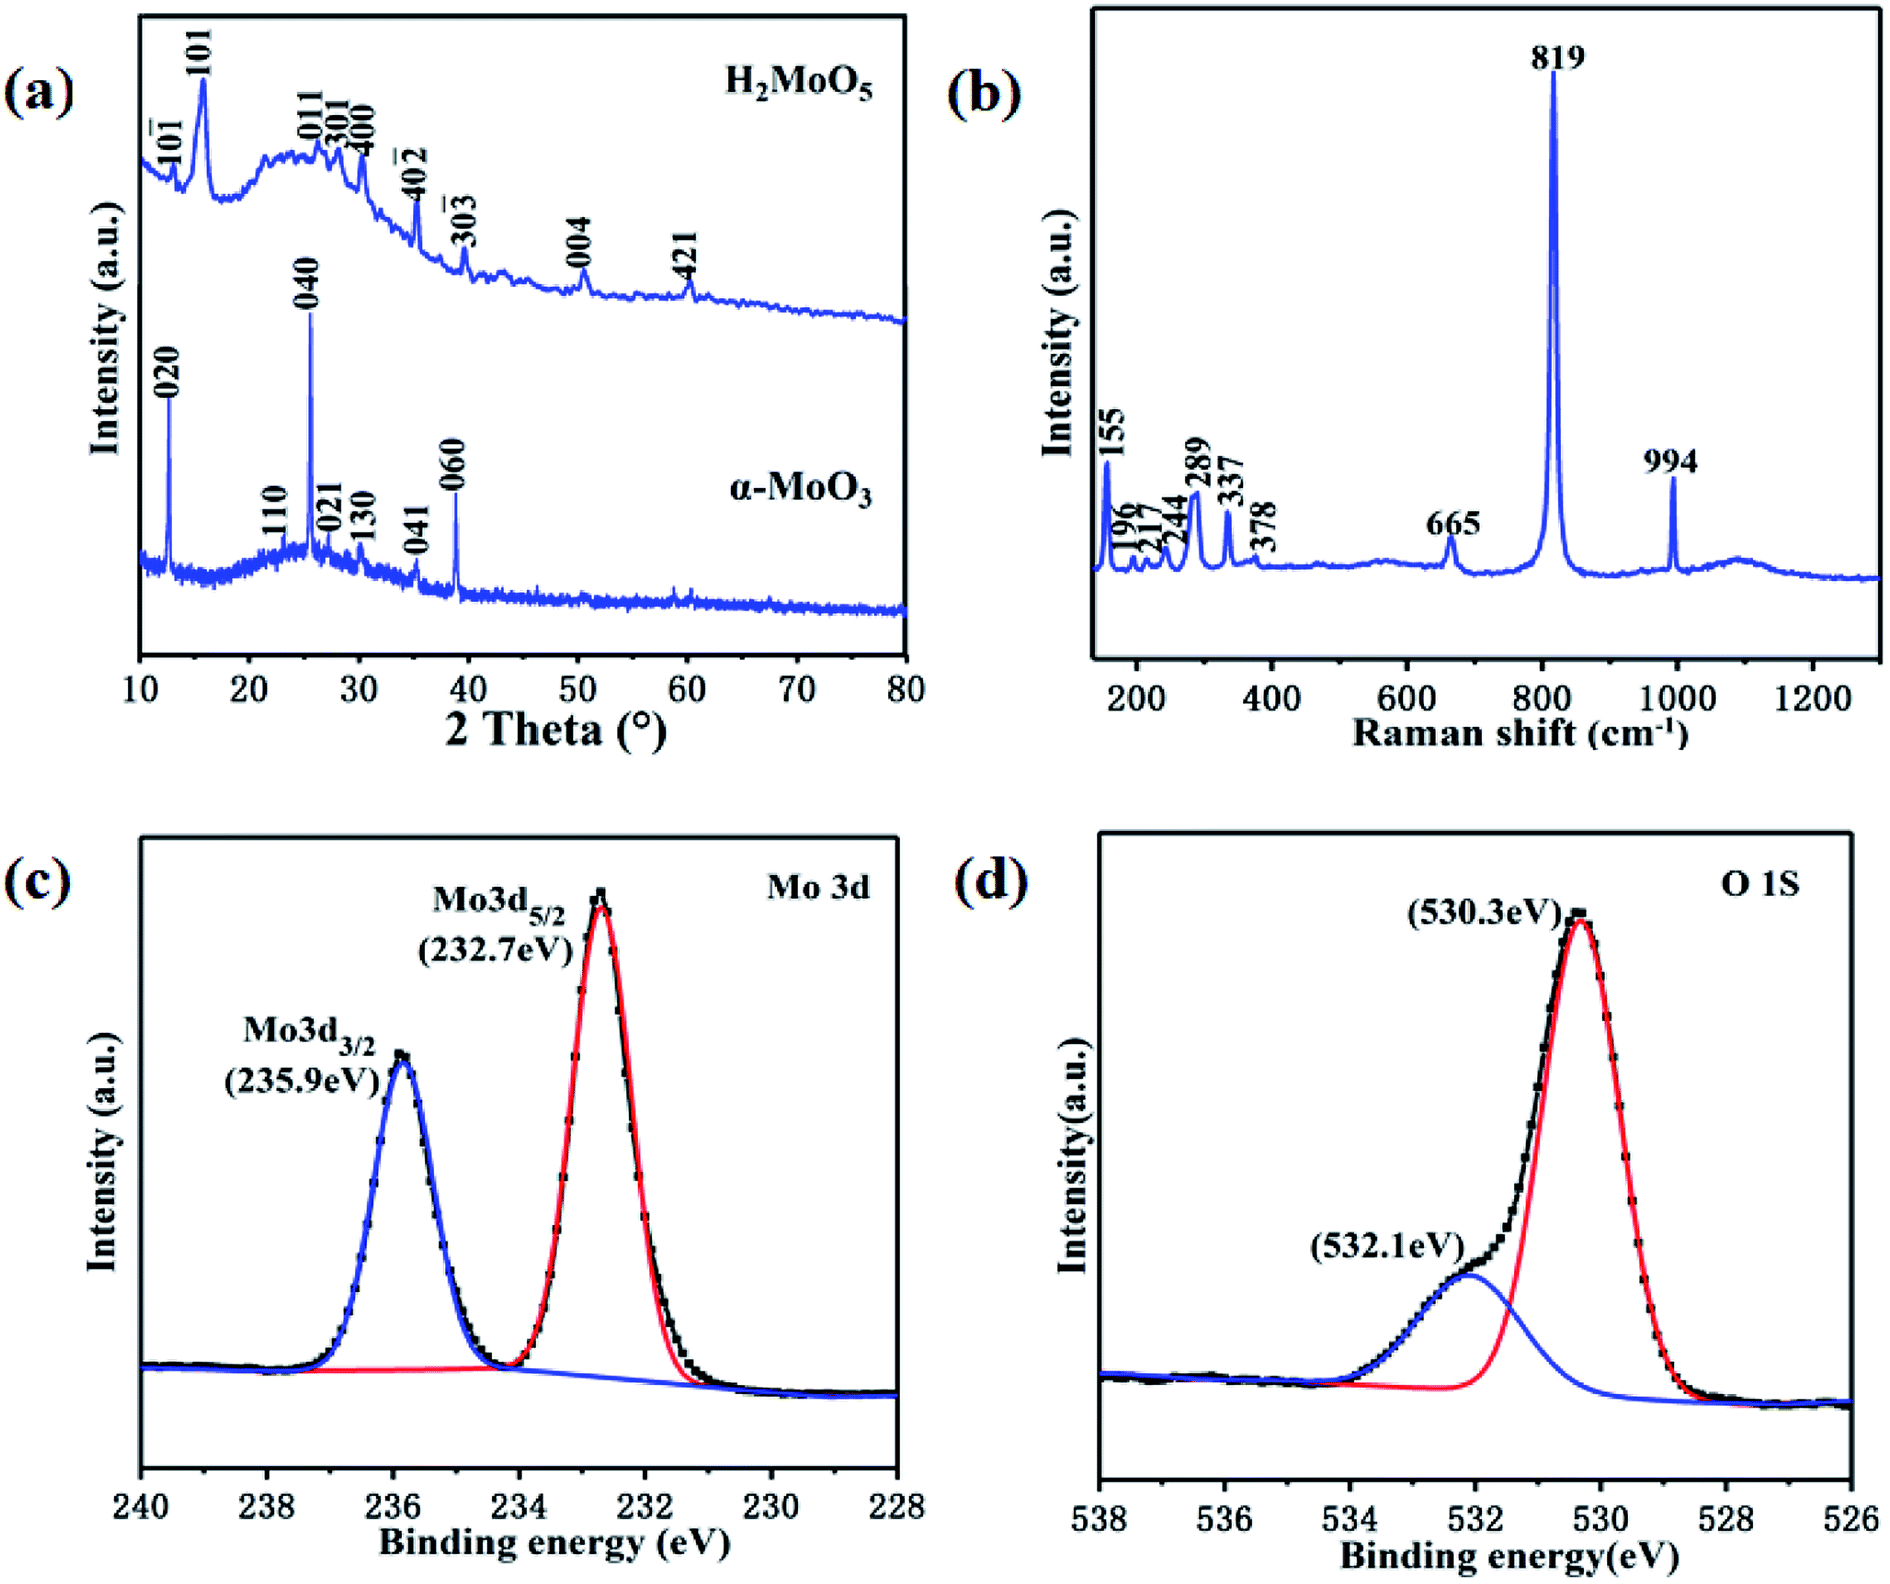 | ||
| Fig. 2 (a) XRD patterns of the prepared film before and after annealing. (b) Raman spectrum of the α-MoO3 thin film. XPS spectra of (c) Mo 3d and (d) O 1s of the α-MoO3 thin film. | ||
Fig. 2b presents a typical Raman spectrum of the α-MoO3 thin film. Sharp peaks corresponding to different vibrational modes indicate a highly ordered structure of the film. The peaks at 994, 819 and 665 cm−1 can be respectively assigned to different stretching modes of the terminal oxygen (Mo![[double bond, length as m-dash]](https://www.rsc.org/images/entities/char_e001.gif) O), the doubly coordinated bridge-oxygen (Mo2–O) and the triply coordinated bridge-oxygen (Mo3–O).22 In addition, other characteristic peaks at 378, 337, 289, 244, 217, 196 and 155 cm−1 can be assigned to the bending modes of the orthorhombic phase of MoO3.23 The characteristic spectrum of Raman further confirmed the formation of highly crystalline α-MoO3 thin film. The elements and chemical states of the film are analyzed via X-ray photoemission spectroscopy (XPS). Fig. 2c shows the narrow scan spectrum of Mo 3d. A spin orbit doublet with peaks occurred at 235.9 and 232.7 eV, which can be assigned to Mo 3d3/2 and Mo 3d5/2, respectively.24 The spectrum for O 1s is shown in Fig. 2d. The low binding energy component located 530.3 eV originated from the lattice oxygen of α-MoO3. The peak at 532.1 eV indicates the existence of some hydroxyl groups, which may come from water molecules adsorbed on the surface of the film.25
O), the doubly coordinated bridge-oxygen (Mo2–O) and the triply coordinated bridge-oxygen (Mo3–O).22 In addition, other characteristic peaks at 378, 337, 289, 244, 217, 196 and 155 cm−1 can be assigned to the bending modes of the orthorhombic phase of MoO3.23 The characteristic spectrum of Raman further confirmed the formation of highly crystalline α-MoO3 thin film. The elements and chemical states of the film are analyzed via X-ray photoemission spectroscopy (XPS). Fig. 2c shows the narrow scan spectrum of Mo 3d. A spin orbit doublet with peaks occurred at 235.9 and 232.7 eV, which can be assigned to Mo 3d3/2 and Mo 3d5/2, respectively.24 The spectrum for O 1s is shown in Fig. 2d. The low binding energy component located 530.3 eV originated from the lattice oxygen of α-MoO3. The peak at 532.1 eV indicates the existence of some hydroxyl groups, which may come from water molecules adsorbed on the surface of the film.25
Fig. 3a shows the schematic structure of the humidity sensor, in which the laser-etched FTO stripes were used as the interdigital electrodes. Then, the annealed α-MoO3 thin film was coated on the surface of this patterned substrate. The morphologies of the H2MoO5 and α-MoO3 thin films were observed by a scanning electron microscopy (SEM). An interesting phenomenon is that although the entire film was prepared in one step, the morphologies of the film on the channels and FTO electrodes are not exactly the same, which indicates that the patterned substrate has an important influence on the film formation process. The H2MoO5 thin films on the channels (Fig. S1(a)†) and FTO electrodes (Fig. S1(b)†) both show a sheet-like porous structure formed by the aggregation of H2MoO5 nanocrystals. The difference is that the film on the surface of the channel obviously possesses more pores. Fig. S1(c)† shows the cross-sectional morphology of the H2MoO5 film, from which the thickness of the H2MoO5 film was measured as 127 nm. The morphologies of the α-MoO3 thin film formed after annealing are shown in Fig. 3. The film morphology on the channels (amorphous glass substrate) exhibits a well-crystallized planar porous structure (Fig. 3b), and its specific surface area is larger than that of the film structure on the electrode surface, thereby facilitating adsorption of water molecules. On the contrary, the film on FTO electrodes (crystalline F-doped SnO2 substrate) is constructed from a dense granular structure with a much larger average grain size (Fig. 3c). This dense structure allows the film to be more closely connected to FTO electrodes, thus potentially reducing the contact resistance. The cross-sectional view of the α-MoO3 thin film on the channel surface is shown in Fig. S2,† and its thickness was measured to be about 120 nm. One possible reason for different surface morphologies of the α-MoO3 thin film is the surface affinity difference of molybdate solution with the channels and FTO electrodes. To verify the above points, we separately tested the contact angles (θ) of the molybdate solution with the channel and electrode. As shown in Fig. S3,† the contact angle of the molybdate solution with the channel (θ1) is 39.7° and with the electrode (θ2) is 22.9°, which means that the molybdate solution has better wettability to the electrode surface, so it can be evenly spread during the spin coating process and formed a thin film with dense structure after annealing. On the contrary, the poorer wettability of the molybdate solution to the channel surface causes the film to shrink easily during the spin coating process, resulting in the annealed film exhibiting a planar porous structure. This kind of substrate-related film morphology may be a key factor to the excellent performance of our humidity sensor.
 | ||
| Fig. 3 (a) Schematic device structure of the transparent humidity sensor. SEM images of the α-MoO3 thin film on the surface of (b) channel and (c) FTO electrode. | ||
Next, we studied the functions and features of the α-MoO3 based humidity sensor. The transmittance spectrum of the sensor is shown in Fig. 4a. This device exhibits an extremely high transmittance of ∼85% in the visible and near-infrared regions, which is derived from the very thin α-MoO3 film and transparent substrate. The inset photograph further confirms the high transmittance of the device. In order to investigate the humidity sensing characteristics of the α-MoO3 thin film, the resistance between the FTO interdigital electrodes was measured at different RHs. As plotted in Fig. 4b, when the RH increased from 11% to 95%, the resistance of the film decreased from 3 × 10⁹ to 9 × 10⁶ Ω. By linearly fitting the points in the graph, we can get a correlation coefficient (R2) of 0.98 in a wide humidity range. This result reflects the good logarithmic linearity of the resistance of the α-MoO3 thin film toward RH, which will bring great convenience to practical applications. Moreover, sensitivity (S) is also an important parameter of the humidity sensors, which can be expressed as
| S = |R0 − Rx|/Rx | (3) |
 | ||
| Fig. 4 (a) Transmittance spectrum of the humidity sensor, inset is a photograph of the transparent device. (b) Resistance and sensitivity of the α-MoO3 humidity sensor as a function of RH. (c) Dynamic response and recovery curve for one cycle. (d) Sensitivity of the device to different analytes. | ||
A well-performing humidity sensor should also have the characteristics of short response and recovery times, especially for a real-time humidity detection system such as human respiratory monitoring.27 The response time (tres) is defined as the time required for the current to increase to 90% of the maximum value after stimulus is applied. While, the recovery time (trec) is defined as the time required for the current to decrease to 10% of the maximum value after stimulus removal. Based on the dynamic current–time curve in Fig. 4c, the response and recovery times of the α-MoO3 based humidity sensor are about 0.97 s and 12.11 s. Accordingly, it is worth noting that our humidity sensor has the fastest response speed and highest transparency compared to the other reported transparent humidity sensors, as shown in Table 1. Hence, this α-MoO3 based humidity sensor demonstrates high performance for potential applications in the field of transparent electronics requiring real-time humidity sensing.
Good selectivity for moisture is essential for humidity sensors, which represents the sensitivity of the sensor to water molecules in environments where various gases coexist. In a laboratory air environment, the selectivity of the α-MoO3 humidity sensor was investigated by exposing it to common gases, including 100 ppm ammonia, saturated ethanol and acetone vapors and 95% RH. As can be seen in Fig. 4d, the fabricated sensor is much more sensitive to moisture than other gases, indicating its good anti-interference ability.
The complex impedance spectroscopy (CIS) is widely used to study electrode process dynamics. In order to study the humidity sensing mechanism, we measured the CIS plots of the α-MoO3 thin film humidity sensor at different RHs (Fig. 5a). The CIS plot approximates a straight line at low humidity (11% RH), exhibiting a “non-debye” behavior, which is derived from the intrinsic impedance of the α-MoO3 thin film.33 In this case, only a small amount of water molecules are chemically adsorbed to form a discontinuous layer of water on the surface of the film. At the same time, the adsorbed water molecules dissociate rapidly and release protons. However, due to the discontinuity of the water layer, the transfer of protons between the electrodes is difficult to achieve.34 Therefore, the impedance of the sensor is particularly high. Further, as the relative humidity increases (33–85% RH), the CIS plots approximate half semicircles with gradually decreasing radius, indicating that both the resistance and reactance of the humidity sensor are significantly reduced. This phenomenon means that more water molecules begin to be physically adsorbed on the surface of the film and form a “liquid-like” water layer.35 The protons dissociated on this layer can be freely transferred between adjacent water molecules under an applied electric field, that is, the so-called Grotthuss chain reaction.36
| H2O + H3O+ = H3O+ + H2O | (4) |
 | ||
| Fig. 5 (a) Complex impedance spectroscopies of the humidity sensor at different RHs. (b) Capacitance–frequency curves of the humidity sensor at different RHs. (c) Schematic diagram of humidity sensing mechanism for the α-MoO3 thin film. | ||
Protons that can move freely increase the concentration of carriers, resulting in a significant reduction in the impedance of the humidity sensor. When the RH increases to 95%, the CIS plot resembles a semicircle with a smaller radius. This corresponds to a further reduction in impedance due to more protons transfer.
In order to further confirm the proton transfer conductivity model, we measured the capacitance–frequency curves at different RHs from the complex impedance spectroscopy, as shown in Fig. 5b. The capacitance hardly changes with frequency at low RHs (11–54% RH), which is consistent with the ideal capacitor. However, at high RHs (75–95% RH), the capacitance is sensitive to the frequency, especially in the low frequency region (10−2–1 Hz). Moreover, the higher the humidity, the faster the capacitance changes with frequency. In this case, the capacitance can be expressed as follow,37
| C = ε*C0 = (εr − iγ/ωε0)C0 | (5) |
Conclusions
In conclusion, we demonstrated a green chemical synthesis route for stable H2MoO5 nanocrystals. A transparent humidity sensor based on α-MoO3 thin films was then fabricated by a facile spin coating method. The morphology of α-MoO3 thin films can be easily controlled by the patterned substrate. The chemical states, transparency, humidity sensing performance and mechanism of the α-MoO3 thin films were thoroughly investigated. This sensor not only demonstrates high sensitivity and selectivity to water molecules, but also has high transparency and short response and recovery times, indicating its great potential for novel applications in transparent electronics where real-time humidity sensing is required.Conflicts of interest
There are no conflicts of interest to declare.Acknowledgements
This publication is based upon work supported by the National Science Foundation of China (No. 61631166004 and 51902250), the Fundamental Research Funds for the Central Universities (xzy012019002), and the National Postdoctoral Program for Innovative Talents (No. BX201700185). Instrument Analysis Center of Xi'an Jiaotong University is acknowledged for the great helps in measurements.Notes and references
- M. A. Najeeb, Z. Ahmad and R. A. Shakoor, Adv. Mater. Interfaces, 2018, 5, 1800969 CrossRef.
- T. A. Blank, L. P. Eksperiandova and K. N. Belikov, Sens. Actuators, B, 2016, 228, 416–442 CrossRef CAS.
- K. Zhang, Z. Hou, B. Zhang and Q. Zhao, Appl. Phys. Lett., 2017, 111, 153101 CrossRef.
- P. Traiwatcharanon, K. Timsorn and C. Wongchoosuk, Mater. Res. Express, 2017, 4, 058038 Search PubMed.
- V. K. Tomer and S. Duhan, Appl. Phys. Lett., 2015, 106, 063105 CrossRef.
- L. L. Wang, X. C. Duan, W. Y. Xie, Q. H. Li and T. H Wang, Chem. Commun., 2016, 52, 8417–8419 RSC.
- E. Torres Alonso, D. W. Shin, G. Rajan, A. I. S. Neves, S. Russo and M. F. Craciun, Adv. Sci., 2019, 6, 1802318 CrossRef PubMed.
- J. Yang, R. Shi, Z. Lou, R. Chai, K. Jiang and G. Shen, Small, 2019, 15, 1902801 CrossRef PubMed.
- J. M. Tulliani, C. Baroni, L. Zavattaro and C. Grignani, Sensors, 2013, 13, 12070–12092 CrossRef PubMed.
- N. Li, Y. Jiang, Y. Xiao, B. Meng, C. Xing, H. Zhang and Z. C. Peng, Nanoscale, 2019, 11, 21522–21531 RSC.
- L. P. Babu Reddy, R. Megha, B. Chethan, H. G. Raj Prakash, Y. T. Ravikiran, C. H. V. V. Ramana and D. Kim, Inorg. Chem. Commun., 2018, 98, 68–74 CrossRef CAS.
- H. U. Kim, J. Son, A. Kulkarni, C. Ahn, K. S. Kim, D. Shin, G. Y. Yeom and T. Kim, Nanotechnology, 2017, 28, 175601 CrossRef PubMed.
- H. E. Lin, Y. Katayanagi, T. Kishi, T. Yano and N. Matsushita, RSC Adv., 2018, 8, 30310–30319 RSC.
- H. Fang, C. Zheng, L. Wu, Y. Li, J. Cai, M. Hu, X. Fang, R. Ma, Q. Wang and H. Wang, Adv. Funct. Mater., 2019, 29, 1809013 CrossRef.
- J. Liang, L. Li, D. Chen, T. Hajagos, Z. Ren, S. Y. Chou, W. Hu and Q. Pei, Nat. Commun., 2015, 6, 7647 CrossRef CAS PubMed.
- X. Y. Liu, Y. Q. Gao and G. W. Yang, Nanoscale, 2016, 8, 4227–4235 RSC.
- Q. Zhang, J. R. Smith, L. V. Saraf and F. Hua, IEEE Sens. J., 2009, 9, 854–857 CAS.
- J. Xu, T. Cui, T. Hirtz, Y. Qiao, X. Li, F. Zhong, X. Han, Y. Yang, S. Zhang and T. L. Ren, ACS Appl. Mater. Interfaces, 2020, 12, 18375–18384 CrossRef CAS PubMed.
- Y. Wang, L. Zhang, J. Zhou and A. Lu, ACS Appl. Mater. Interfaces, 2020, 12, 7631–7638 CrossRef CAS PubMed.
- D. Li, Y. Li, F. Li, J. Zhang, X. Zhu, S. Wen and S. Ruan, Ceram. Int., 2015, 41, 4348–4353 CrossRef CAS.
- Q. Qi, T. Zhang and L. Wang, Appl. Phys. Lett., 2008, 93, 023105 CrossRef.
- Q. Zheng, J. Huang, S. Cao and H. Gao, J. Mater. Chem. C, 2015, 3, 7469–7475 RSC.
- K. K. Wang, F. X. Wang, Y. D. Liu and G. B. Pan, Mater. Lett., 2013, 102–103, 8–11 CrossRef CAS.
- T. W. Ng, Q. D. Yang, H. W. Mo, M. F. Lo, W. J. Zhang and C. S. Lee, Adv. Opt. Mater., 2013, 1, 699–702 CrossRef.
- A. R. Head, C. Gattinoni, L. Trotochaud, Y. Yu, O. Karslıoğlu, S. Pletincx, B. Eichhorn and H. Bluhm, J. Phys. Chem. C, 2019, 123, 16836–16842 CrossRef CAS.
- R. Aher, A. Bhorde, S. Nair, H. Borate, S. Pandharkar, D. Naik, P. Vairale, S. Karpe, D. Late, M. Prasad and S. Jadkar, Phys. Status Solidi A, 2019, 216, 1900065 CrossRef.
- H. An, T. Habib, S. Shah, H. Gao, A. Patel, I. Echols, X. Zhao, M. Radovic, M. J. Green and J. L. Lutkenhaus, ACS Appl. Nano Mater., 2019, 2, 948–955 CrossRef CAS.
- H. Kim, S. Park, Y. Park, D. Choi, B. Yoo and C. S. Lee, Sens. Actuators, B, 2018, 274, 331–337 CrossRef CAS.
- J. R. McGhee, J. S. Sagu, D. J. Southee and K. G. U. Wijayantha, IEEE Sens. J., 2018, 18, 7358–7364 CAS.
- A. S. Pawbake, R. G. Waykar, D. J. Late and S. R. Jadkar, ACS Appl. Mater. Interfaces, 2016, 8, 3359–3365 CrossRef CAS PubMed.
- T. Q. Trung, L. T. Duy, S. Ramasundaram and N. E. Lee, Nano Res., 2017, 10, 2021–2033 CrossRef CAS.
- H. Guo, C. Lan, Z. Zhou, P. Sun, D. Wei and C. Li, Nanoscale, 2017, 9, 6246–6253 RSC.
- L. Sun, B. Wang and Y. Wang, Adv. Mater. Interfaces, 2018, 5, 1701300 CrossRef.
- D. Zhang, Y. Cao, P. Li, J. Wu and X. Zong, Sens. Actuators, B, 2018, 265, 529–538 CrossRef CAS.
- S. Agarwal and G. L. Sharma, Sens. Actuators, B, 2002, 85, 205–211 CrossRef CAS.
- N. Agmon, Chem. Phys. Lett., 1995, 244, 456–462 CrossRef CAS.
- J. Wang, X. H. Wang and X. D. Wang, Sens. Actuators, B, 2005, 108, 445–449 CrossRef CAS.
- T. Zhang, Y. He, R. Wang, W. Geng, L. Wang, L. Niu and X. Li, Sens. Actuators, B, 2008, 131, 687–691 CrossRef CAS.
Footnote |
| † Electronic supplementary information (ESI) available. See DOI: 10.1039/d0ra03958f |
| This journal is © The Royal Society of Chemistry 2020 |