DOI:
10.1039/D0RA03731A
(Paper)
RSC Adv., 2020,
10, 29555-29566
Structural, physicochemical and functional properties of Semen Ziziphi Spinosae protein
Received
26th April 2020
, Accepted 2nd August 2020
First published on 11th August 2020
Abstract
Semen Ziziphi Spinosae (Ziziphus jujuba Mill. var. spinosa (Bunge) Hu ex H. F. Chou) is a functional food and a traditional Chinese medicine (TCM) in China. Herein, Semen Ziziphi Spinosae protein (SZSP) was prepared by an alkaline extraction and acid precipitation method, of which the structural, physicochemical, functional and emulsion properties were investigated. Results showed that SZSP contained an ideal amino acid composition. The structural properties of the proteins were characterized using Fourier transform infrared spectroscopy (FTIR), relative fluorescence and circular dichroism (CD) spectroscopy analysis. The electrophoresis profiles showed that the main molecular weight of the protein components was about 10–40 kDa and contained some glycoproteins. Differential scanning calorimetry analysis indicated that the denaturation temperature of SZSP was 110.5 °C. The functional properties showed that SZSP has good water and oil absorption capacity, high emulsifying ability and foaming stability. The overall results suggest that SZSP is a promising protein source for the functional food industry.
1. Introduction
Protein plays a vital role in human health and is one of the main sources of energy required by humans and animals. When the human body lacks sufficient protein, physiological and metabolic disorders, decreased immunity and delayed growth can occur, while excessive intake will also have a negative impact on the body. Therefore, recently people have paid more attention to the safety and reliability of protein intake. Most animal proteins are high-quality proteins, but the large amount of cholesterol, fat and calories they contain adversely affect human health.1 A “clean label” resource, with plant-based protein as the main source, has attracted attention.2 The sources of plant-based protein are rich and varied, and the proportion of unsaturated fatty acids can reach more than 90%, which has a positive effect on the regulation of human physiological metabolism and dietary structure. In addition, lower production costs allow plant proteins to show a competitive advantage in terms of economic value and sustainable utilization. The application potential of the protein food industry is mainly based on a comprehensive evaluation of the physicochemical properties, functional characteristics and structural conformation, including characterization of secondary structure, solubility, thermal stability, emulsification and oil and water absorption.3 Plant seeds are mainly composed of fats and proteins, which are the main source of plant proteins and have been widely studied and applied in the food industry, such as soybean protein, peony seed protein, Chinese quince protein and peanut protein.4–7
Semen Ziziphi Spinosae (SZS, Ziziphus jujuba Mill. var. spinosa (Bunge) Hu ex H. F. Chou), a member of the Rhamnaceae family, is one of the most popular traditional Chinese herbs with a history of greater than 2200 years,8 which is predominantly planted in northern China. SZS is a common health food raw material that has been regulated by a law named the same origin of medicine and food (“yao shi tong yuan”) rules issued by the National Health and Family Planning Commission of PRC in 2002. SZS occupies an important position in the food and medicine industry because of its unique sour taste and therapeutic effects toward illnesses such as insomnia and anxiety and its antioxidant activities.9 SZS is rich in protein, oils and polypeptides, and the oil of SZS contains 90.12% monounsaturated fatty acids with significant hypolipidemic and antioxidant activity. The oil has been used to produce related derivatives for the food health industry and clinical applications.10–12
There has been little information published about SZSP, especially its physicochemical and functional properties. In this study, the main objectives are (1) effective extraction of SZSP; (2) detection of various parameters such as thermal denaturation temperature, solubility, surface hydrophobicity and emulsion stability of SZSP; (3) determination of the structural characteristics of SZSP.
2. Experimental
2.1. Materials
Semen Ziziphi Spinosae (Ziziphus jujuba Mill. var. spinosa (Bunge) Hu ex H. F. Chou) was purchased from the affiliated hospital of Changchun University of Traditional Chinese Medicine, and the seeds were produced in Shanxi, China. Soybean oil was bought from a local supermarket in Changchun, Jilin, China.
The Bradford Protein Assay Kit was purchased from TIANGEN Biotech Co., Ltd. (Beijing, China). 5,5-Dithiobis (2-nitrobenzoic acid) (DTNB) was purchased from the Aladdin Reagent Co. (Shanghai, China). The Schiff reagent and Coomassie brilliant blue (R-250) were purchased from Solarbio Science & Technology Co., Ltd. (Beijing, China). Tris–HCl, glycine, urea, sodium dodecyl sulphate (SDS) and β-mercaptoethanol were purchased from Sigma-Aldrich Co. (St. Louis, MO, USA). All reagents and chemicals were of analytical grade.
2.2. Preparation of defatted SZS flour
SZS was ground into flour, passed through a 40-mesh sieve, and then mixed with petroleum ether at a solvent ratio of 1![[thin space (1/6-em)]](https://www.rsc.org/images/entities/char_2009.gif) :15 (w/v) for 12 h at room temperature. The suspension was centrifuged at 3500 rpm for 10 min. The defatting procedure was repeated twice. The defatted flour was evaporated until the residual solvent was completely removed at room temperature, and then stored in a desiccator for protein extraction.
:15 (w/v) for 12 h at room temperature. The suspension was centrifuged at 3500 rpm for 10 min. The defatting procedure was repeated twice. The defatted flour was evaporated until the residual solvent was completely removed at room temperature, and then stored in a desiccator for protein extraction.
2.3. Preparation of Semen Ziziphi Spinosae protein
SZSP was extracted from defatted flour using the alkaline extraction and acid precipitation method with some modifications.5 The defatted SZS flour (100 g) was dispersed in pure water (1:20, w/v) and the pH of the suspension was adjusted to 9.5 using 1 M NaOH for protein extraction. The suspension was stirred at 50 °C for 45 min and then centrifuged at 3500 rpm for 25 min, and the protein-containing supernatant was collected. The supernatant was adjusted to the isoelectric point of 4.2 by adding 1 M HCl, and then was held for 2 h at 4 °C. The precipitated protein was recovered by centrifuging at 3500 rpm for 10 min. The precipitated protein was resuspended in distilled water and adjusted to pH 7.0 by adding 1 M NaOH. The protein suspension was freeze-dried and stored at 4 °C until further analysis.
2.4. Analysis of chemical components of SZS and SZSP
The protein contents of SZS and SZSP were determined by the Kjeldahl method (N × 6.25). The ash, moisture and fat content percentages of SZS and SZSP were determined according to the standards methods of AOAC (2000).13
2.5. Amino acid analysis
The amino acid profile was determined using an automatic Amino Acid Analyzer L-8900 (Hitachi, Tokyo, Japan). The sample pretreatment method of Tang et al.14 was used with some modifications as follows: 20 mg SZSP was placed in a vacuum hydrolyzed tube and hydrolyzed with 4 mL of 6 M HCl under a nitrogen atmosphere for 24 h at 110 °C. The hydrolysate was dried at 50 °C and then dissolved. Tryptophan was destroyed during hydrolysis, so it was not measured. Soybean protein isolate (SPI) was used as the reference. The amino acid contents were evaluated as g amino acid per 100 g protein.
2.6. Analysis of the zeta potential
The zeta potential of SZSP was determined using a Zetasizer Nano ZS (Malvern Instruments Ltd., Malvern, UK). The SZSP samples were diluted to 0.1 mg mL−1 with distilled water, and all measurements were performed at 25 °C and repeated three times.
2.7. Sodium dodecyl sulfate-polyacrylamide gel electrophoresis (SDS-PAGE)
The SDS-PAGE analyses of SZSP and major fractions were performed according to the Laemmli method with 12.5% separating gel and 5% stacking gel.15 The dried precipitate proteins were mixed with SDS-PAGE sample loading buffer (Beyotime, Shanghai, China) at the ratio of 1:1. The mixture was placed in boiling water for 3–5 min. After the temperature dropped to room temperature, 10 μL solution was loaded into the cell. SDS-PAGE was conducted using a Mini PROTEAN Tetra Cell system (Bio-Rad, USA). The gel was stained in Coomassie brilliant blue R250 solution and de-stained in acetic acid:methanol:water (20:60:120). The images were scanned by an Invitrogen iBright FL 1000 (Thermo Fisher Scientific, USA). The glycoprotein was detected by periodic acid–Schiff staining with some modifications.16 The gel was fixed in 50% ethanol solution for 30 min and placed in periodic acid (1%)–acetic acid (3%) and shaken for 30 min. After being rinsed with distilled water and 0.1% sodium pyrosulfite, the gel was dyed in Schiff solution for 1 h, then immersed in 0.1% sodium pyrosulfite for 1 h in the dark, and rinsed with 0.5% sodium pyrosulfite in the dark several times. Finally, the gel was stored in a glacial acetic acid (7.5%)–methanol (5%)–water solution.
2.8. UV absorption spectroscopy
The UV absorption of SZSP was measured based on the method of Du et al.,17 where the UV spectrum of the SZSP solution was measured by a spectrophotometer (Shimadzu UV-1800, Tokyo, Japan) in the range of 200–450 nm at room temperature.
2.9. Intrinsic fluorescence spectra
The intrinsic fluorescence of SZSP was performed using the method of Malomo and Aluko with some modifications.18 Proteins were dissolved in 10 mM PS buffer (0.1 mg mL−1), and the pH was adjusted to 5.0, 7.0 and 9.0. The fluorescence spectrum was recorded from 300 to 500 nm at an excitation wavelength of 280 nm. The excitation and emission slits were set to 5 nm. The fluorescence intensity of the solutions were measured by a fluorescence spectrophotometer (F-2700, Hitachi, Japan) in the range of 400–600 nm.
2.10. Fourier transform infrared spectroscopy (FTIR)
FTIR spectra of the SZSP samples were recorded between 4000 and 500 cm−1 with a resolution of 4 cm−1 using 32 scans (Nicolet 380, Thermo Scientific, UK) in attenuated total reflection mode.
2.11. Circular dichroism (CD) spectra analysis
CD spectroscopy was used to observe the structure changes of SZSP by the method of Xiong et al. with slight modification.19 The wavelengths were scanned in the far UV range (185–260 nm). SZSP was dispersed in pure water (1%) adjusted to pH 5.0, 7.0 and 9.0 with 1.0 M HCl or 1.0 M NaOH. The measurement parameters of the CD spectrometer (JASCO J-1100, Jasco Corp., Tokyo, Japan) were scan speed, 100 nm min−1; bandwidth, 1.0 nm; response time, 0.50 s; step resolution, 1.0 nm at room temperature. Every spectrum was an average of three scans. The proportions of the α-structure, β-structure and the unordered coil were gained by Yang's equation software by Jasco Corp (Hachioji City, Tokyo, Japan).
2.12. Thermal properties
The thermal properties of SZSP were analyzed by Mettler Toledo DSC 3 (Mettler Toledo, USA) according to the method of Shevkani et al. with some modifications.20 SZSP samples were dispersed in 20% (w/v) pure water and stored at 4 °C for 24 hours. The suspension was accurately weighed and sealed in an aluminum pan, and an empty pan was used as a reference. The measurement parameters were temperature range, 20–140 °C; heating rate, 5 °C min−1.
2.13. Determination of free sulfhydryl (SH) and disulfide bond (SS)
The sulfhydryl groups and disulfide bonds were determined according to a report by Wu et al. with some modifications.21 To determine the SH, SZSP (30 mg) was dissolved in 10 mL Tris–Gly–8 M urea buffer, and then 50 μL Ellman reagent (DNTB, 4 mg mL−1) was added. The protein suspension was incubated at 25 °C for 60 min and then centrifuged at 5000g for 10 min. The absorbance of the supernatant at 412 nm was determined. To determine the total SH, SZSP (15 mg) was dissolved in 10 mL Tris–Gly–8 M urea buffer, and then 100 μL of β-mercaptoethanol was added. The protein suspension was incubated at 25 °C for 60 min and then 10 mL of 12% trichloroacetic acid was added and centrifuged at 5000g for 10 min. The proteins of the precipitate were redissolved in 10 mL Tris–Gly and 50 μL DNTB (4 mg mL−1). The absorbance at 412 nm was determined. The content of SH was calculated using eqn (1),| | |
SH (μM g−1) = 73.53 × A412 × D/C,
| (1) |
where A412 is the absorbance at 412 nm; D is the dilution coefficient; and C is the protein concentration (mg mL−1). The SS content = (Total SH − Free SH)/2.
2.14. Protein solubility
The SZSP solution (1%, w/v) was prepared in distilled water and the pH was adjusted to 2.0–10.0 with 1.0 M NaOH or 1.0 M HCl. The solution was stirred for 30 min and centrifuged at 3500 rpm min−1 for 15 min at room temperature. The protein content of the supernatants was analyzed by the Bradford method using BSA as a standard.22 The total protein contents of the samples were determined using the Kjeldahl method. Protein solubility was calculated according to eqn (2),| | |
Protein solubility = protein in the supernatant/total protein × 100.
| (2) |
2.15. Measurements of WAC and OAC
The water absorption capacity (WAC) and oil absorption capacity (OAC) were determined according to the method of Tomotake et al.23 Briefly, SZSP (1 g) samples and 15 mL distilled water or vegetable oil were mixed in a pre-weighed centrifuge tube. The tubes were centrifuged at 5000 rpm for 20 min at 25 °C. The supernatant of the water or oil was removed, and then the weight of precipitate plus tube was determined. The WAC and OAC of the SZSP were calculated by eqn (3),| | |
WAC/OAC (g/g) = (M2 − M1)/M0,
| (3) |
where M2 (g) is the weight of tube plus protein after absorbing water or oil, M1 (g) is the weight of the tube and protein samples and M0 (g) is the weight of protein samples.
2.16. Emulsifying properties
The emulsifying activity index (EAI) and the emulsion stability index (ESI) were determined by referring to Meng et al.24 Briefly, SZSP (5%, w/v) was dissolved in 10 mM of PS buffer (pH 7.0). Then, the pH of the solution was adjusted to a value within the range of 2–10 using 1 M HCl or 1 M NaOH. Next, 15 mL of protein solution and 2 mL vegetable oil were mixed using a homogenizer (IKA-T18, ULTRA-TURRAX, GE) at 15000 rpm for 1 min. The emulsion (50 μL) samples were pipetted at 0 and 30 min from the bottom of the tube and diluted in 5 mL 0.1% SDS solution. The absorbance of the emulsion at 30 min and 0 min were determined using a spectrophotometer (Shimadzu UV-Visible 1800, Tokyo, Japan). The EAI and ESI were calculated using eqn (4) and (5),| | |
EAI (m2 g−1) = 2 × 2.303 × A0 × DF/(C × φ ×1000),
| (4) |
| | |
ESI (%) = EAI30 min/EAI0 min × 100%,
| (5) |
where A0 is the absorbance of the emulsion, DF is the dilution factor, C is the concentration of protein solution (mg mL−1) and φ is the oil volume fraction.
2.17. Foaming capacity (FC) and foaming stability (FS)
The FC and FS of SZSP were determined according to a previous report by Shevkani et al. with some modifications.20 50 mL SZSP solution (1%, w/v) was prepared, and then adjusted to a pH (2–10) using 1 M HCl or 1 M NaOH. The solution was mixed at 15000 rpm using a homogenizer (IKA-T18, ULTRA TURRAX, GE) for 1 min. The foam volume was measured at time 0 min and 30 min after homogenization. The FC and FS of SZSP were calculated using eqn (6) and (7),| | |
FC (%) = (V0/V) × 100,
| (6) |
| | |
FS (%) = (V30/V0) × 100,
| (7) |
where V0 (mL) is the foam volume at 0 min, V30 (mL) is the foam volume at 30 min and V (mL) is the initial liquid volume.
2.18. Measurement of LGC
The least gelation concentration (LGC) was evaluated according to the method of Adebiyi and Aluko.25 SZSP suspensions (5–15%, w/v) were prepared in distilled water and vortexed in a centrifuge tube for 5 min. Then, the tubes were placed in a water bath at 100 °C for 60 min, followed by cooling under flowing water and storage at 4 °C for 2 h. The LGC was determined as the lowest concentration at which the protein samples did not fall or slip from the tube.
2.19. Statistical analysis
All experiments were conducted at least three times. The data were reported as mean value ± standard deviation. Statistical analyses were conducted using SPSS 21.0 and Origin 9.0 for Windows. p < 0.05 was considered statistically significant differences between the groups.
3. Results and discussion
3.1. Protein chemical compositions
As shown in Table 1, the main components of the SZS were protein (23.67%), carbohydrate (25.48%) and fat/oil (40.75%). The protein content of SZS was 23.67% and reached 55.17% when the oil was removed. The protein content of the freeze-dried protein was 83.45%, equal to that of sunflower kernel protein isolate (83.98%) and Chinese quince seed protein (87.56%).6,26 This means that SZSP is an ideal new plant protein resource. This also shows that the residue after SZS oil extraction still contains high nutritional content and can be reused, which can generate commercial value. The ash, moisture and crude fat/oil in SZSP were 1.76%, 4.32% and 0.89%, respectively.
Table 1 Analysis of main chemical constituents in Semen Ziziphi Spinosaea
| Table |
Content (%) |
| SZS |
Defatted SZS |
SZSP |
| Results are expressed as the mean ± standard deviation (n = 3). |
| Moisture |
8.02 ± 0.02 |
9.46 ± 0.02 |
4.32 ± 0.04 |
| Ash |
2.08 ± 0.04 |
1.84 ± 0.05 |
1.76 ± 0.09 |
| Protein |
23.67 ± 0.17 |
55.17 ± 0.25 |
83.45 ± 0.85 |
| Carbohydrate |
25.48 ± 0.14 |
30.21 ± 0.11 |
— |
| Crude fat and oil |
40.75 ± 0.06 |
3.32 ± 0.05 |
0.89 ± 0.12 |
3.2. Amino acid analysis
The amino acid composition of SZSP was compared to soy protein. As shown in Table 2, the SZSP had a desirable amino acid profile, which contained all essential amino acids (EAAs) and non-essential amino acids (NEAAs) except tryptophan. The amino acid composition of SPI was similar to previously published reports.27 However, the EAAs in the SZSP, including Ile, Leu, Met, Phe, Thr and Lys, were less abundant than those in SPI. His and Val contents of the SZSP were higher than that in SPI. The NEAA contents of Tyr, Ala and Pro in the SZSP were lower than in the SPI. Cys and Ser contents were similar with SPI. Gly and Arg were higher than that in SPI. The Glu (25.83%) and Asp (11.67%) were the most abundant amino acids in SZSP, which were similar to pea protein,28 indicating that SZSP may have good antioxidant and immune activity.29 In addition, classification and statistics of the amino acid types of SZSP and SPI were also performed. The acidic amino acids of SZSP accounted for 37.50% of the total amino acids, which was higher than in SPI. The hydrophobic amino acids of SZSP accounted for 33.92%, which was lower than in SPI, but higher than that of tree peony seed (20.87%).5 The aromatic and branched-chain amino acids ratio of SZSP (41.78%) was less than that of SPI, but it could also meet the body's needs.30 Moreover, the EAAs were comparable with that of SPI and FAO/WHO reference protein, which was ideal.31 The EAA contents reached the WHO/FAO requirements for adults, except for methionine (Met). These results indicate that SZSP could be a nutritional and healthy plant protein in many food products.
Table 2 Amino acid compositions of SZSP and SPIa
| Amino acid |
SZSP (g per 100 g) |
SPI (g per 100 g) |
WHO/FAO suggested requirements for adult (g per 100 g) |
| Results are expressed as the mean ± standard deviation (n = 3). Hydrophilic amino acids: Ser, Thr, Cys, Tyr. Hydrophobic amino acids: Gly, Ala, Val, Leu, Pro, Met, Phe, Ile. Acidic amino acids: Glu, Asp. Basic amino acids: Lys, Arg, His. Aromatic amino acids: Tyr, Phe. Branched-chain amino acids: Ile, Leu, Val. |
| Essential amino acid (EAA) |
| Histidine (His) |
2.78 ± 0.21 |
2.83 ± 0.35 |
1.60 |
| Isoleucine (Ile) |
3.25 ± 0.17 |
4.54 ± 0.21 |
1.30 |
| Leucine (Leu) |
7.86 ± 0.49 |
7.22 ± 0.53 |
1.90 |
| Lysine (Lys) |
3.15 ± 0.76 |
5.47 ± 0.61 |
1.60 |
| Methionine (Met) |
0.59 ± 0.16 |
0.95 ± 0.12 |
1.70 |
| Phenylalanine (Phe) |
4.20 ± 0.51 |
5.39 ± 0.39 |
1.90 |
| Threonine (Thr) |
2.77 ± 0.19 |
4.17 ± 0.25 |
0.90 |
| Valine (Val) |
5.81 ± 0.93 |
4.48 ± 0.76 |
1.30 |
|
| Non-essential amino acid (NEAA) |
| Aspartic acid (Asp) |
11.67 ± 1.23 |
11.69 ± 1.06 |
— |
| Glutamic acid (Glu) |
25.83 ± 1.88 |
22.15 ± 1.63 |
— |
| Serine (Ser) |
5.47 ± 0.43 |
5.55 ± 0.56 |
— |
| Cystine (Cys) |
0.83 ± 0.10 |
0.64 ± 0.03 |
— |
| Glycine (Gly) |
5.03 ± 0.33 |
3.79 ± 0.42 |
— |
| Tyrosine (Tyr) |
2.87 ± 0.18 |
3.76 ± 0.23 |
— |
| Arginine (Arg) |
9.88 ± 0.85 |
8.03 ± 0.64 |
— |
| Alanine (Ala) |
3.93 ± 0.22 |
3.92 ± 1.95 |
— |
| Proline (Pro) |
3.25 ± 0.31 |
5.88 ± 0.60 |
— |
|
| Nutritional qualities |
| Hydrophilicb |
11.94 ± 0.90 |
14.12 ± 1.07 |
— |
| Hydrophobicc |
33.92 ± 3.12 |
36.17 ± 4.98 |
— |
| Acidicd |
37.50 ± 3.11 |
33.84 ± 2.69 |
— |
| Basice |
15.81 ± 1.82 |
16.33 ± 1.60 |
— |
| Aromaticf |
7.07 ± 0.69 |
9.15 ± 0.62 |
— |
| Branched-chaing |
16.92 ± 1.59 |
16.24 ± 1.50 |
— |
3.3. UV analysis
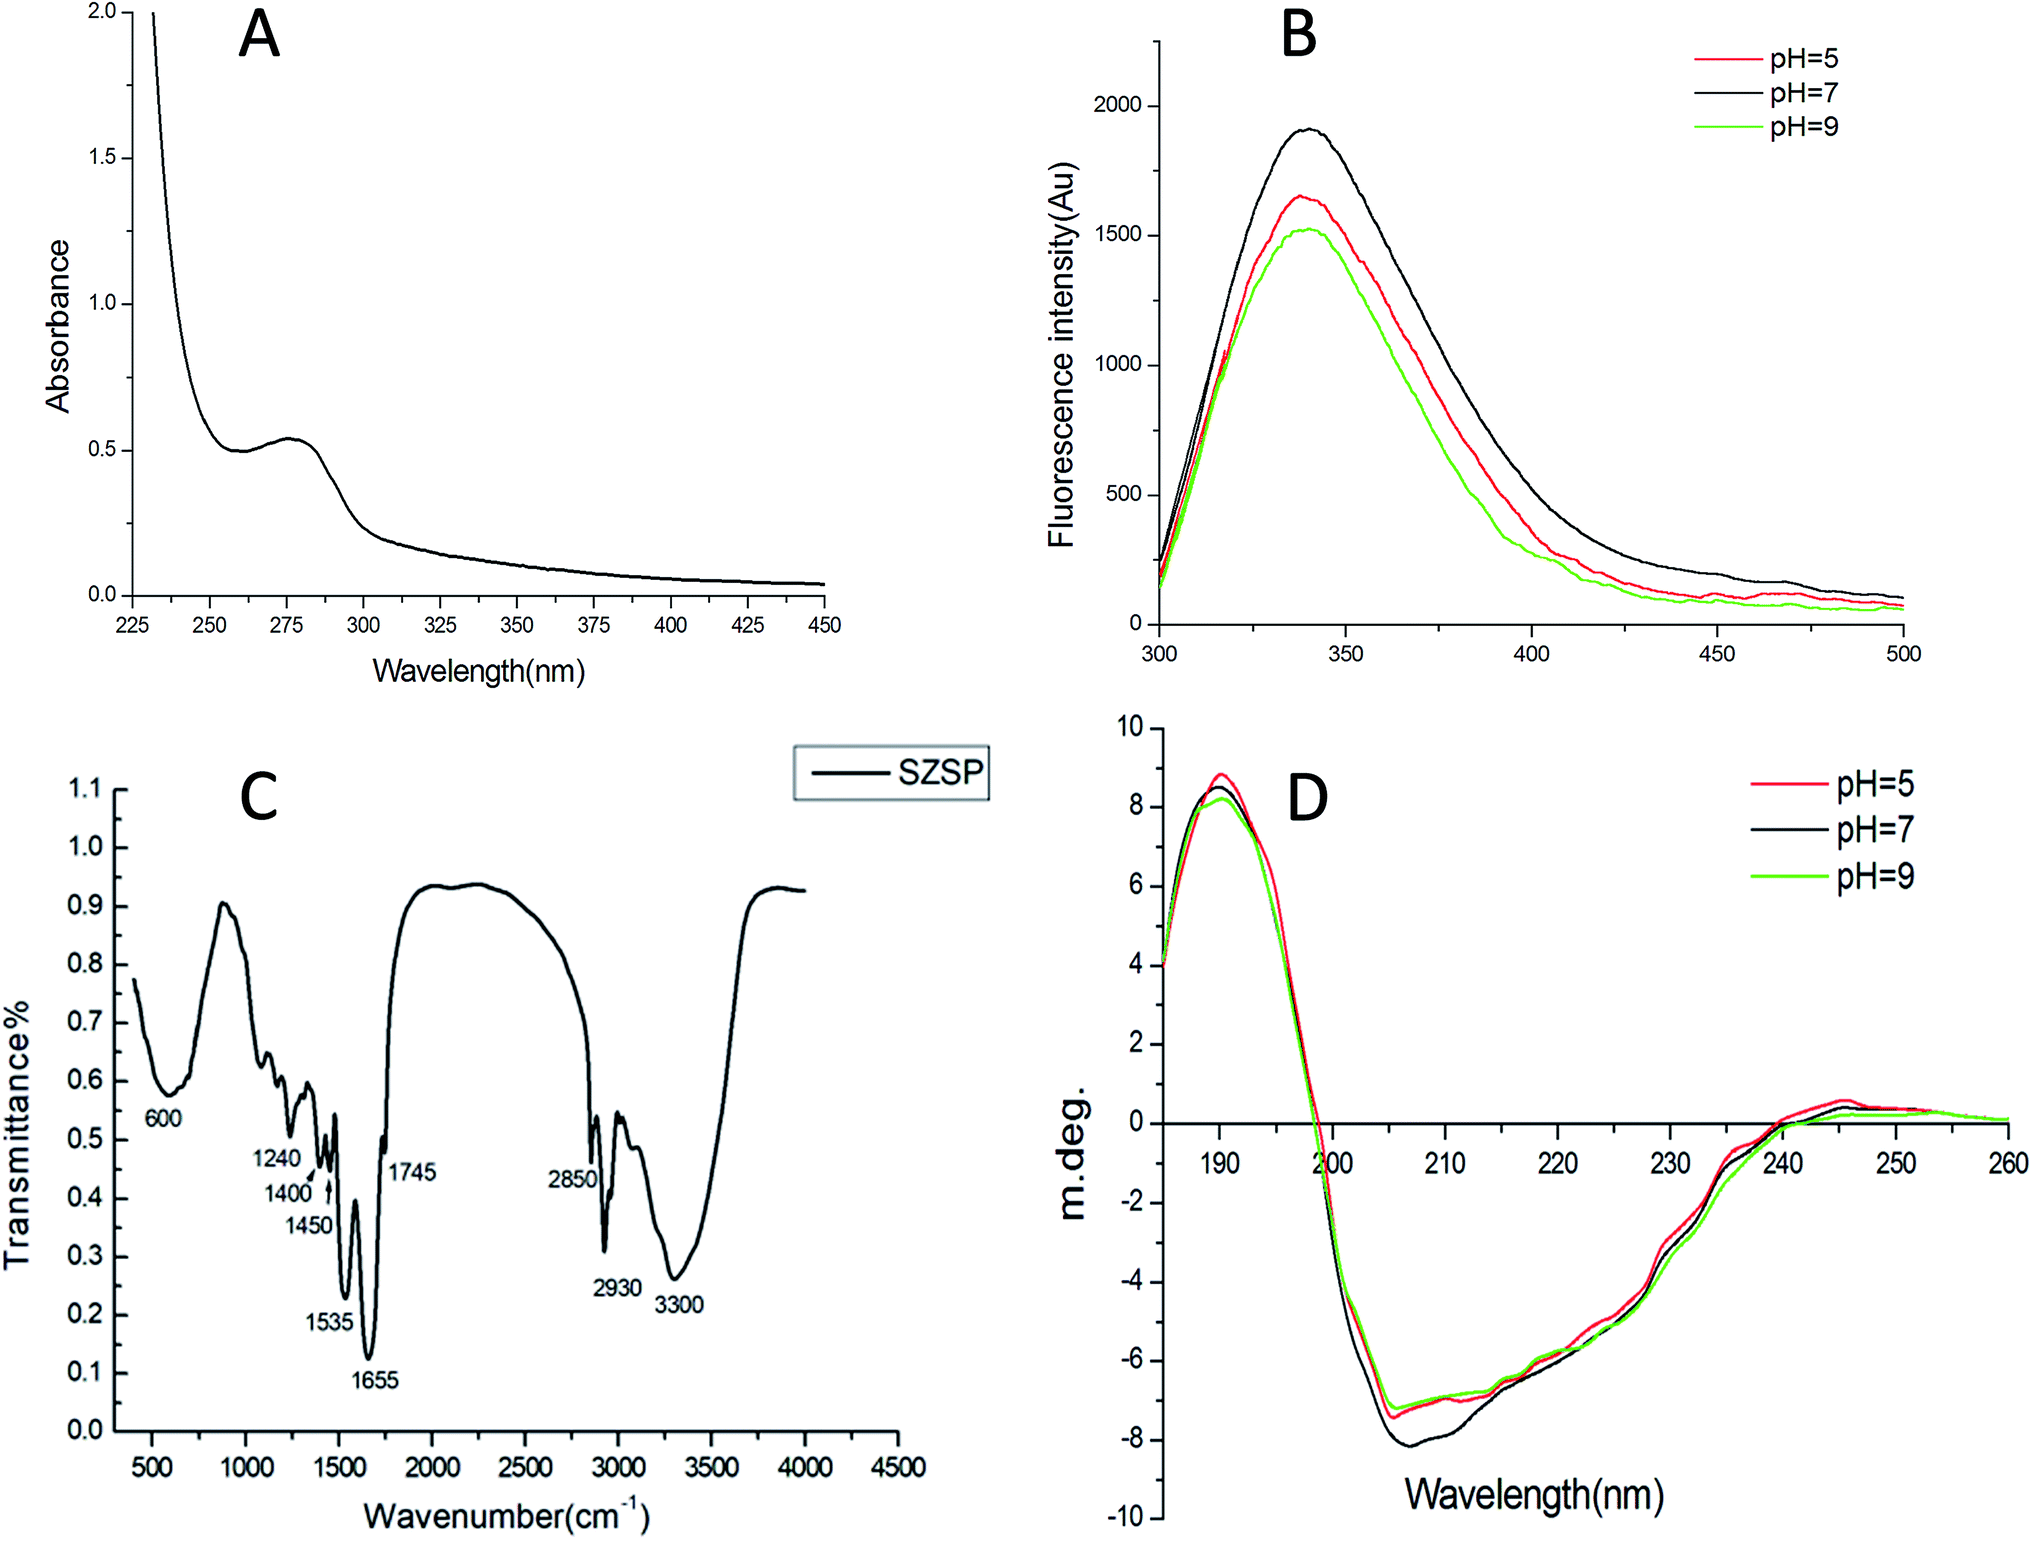
Fig. 1A shows the UV spectra of SZSP in the range of 200–450 nm. The SZSP showed a maximum absorption peak at 280 nm, indicating the presence of proteins.32
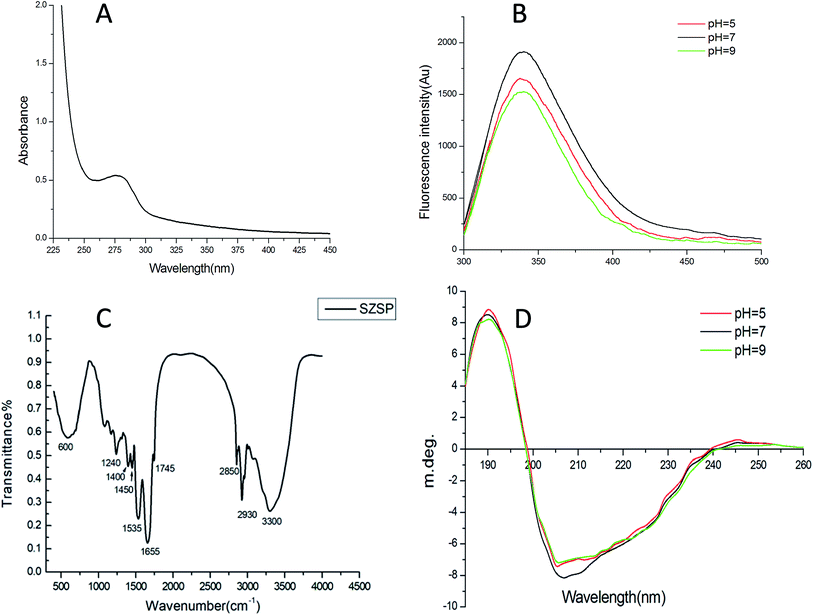 |
| | Fig. 1 Ultraviolet spectra of SZSP (A). Intrinsic fluorescence spectra of SZSP at various pH values(B), Fourier transform infrared (FTIR) spectra of SZSP (C), Circular Dichroism (CD) spectra of SZSP at various pH values (D). | |
3.4. Intrinsic fluorescence spectra
The intrinsic fluorescence spectrum is determined by the ability of aromatic amino acid residues to absorb ultraviolet light and emit fluorescence, which can reflect the conformational changes of proteins, especially conformational changes in the tertiary structure.33 Tryptophan has dominant fluorescence in this emission region, which can reflect the environment of the protein, and its fluorescence peak wavelength is affected by the protein type and the environment's polarity, thus indicating changes in the protein structure.34 The fluorescence spectra of SZSP with different pH values (5.0, 7.0 and 9.0) are shown in Fig. 1B. At an excitation wavelength of 280 nm, the maximum absorption peaks of the SZSP solutions with different pH values are all about 340 nm. The maximum absorption peak of SZSP had no obvious red-shift under different pH conditions, indicating that the tertiary structure of the protein had not changed in acidic or alkaline environments.
3.5. FTIR spectrum analysis
FTIR spectroscopy has been recognized as one of the most useful techniques for analyzing molecular structure, especially the various functions of organic biomolecules. It is based on the absorption of infrared radiation at specific wavelengths and intensities.35 FTIR requires less sample preparation, is easy to operate, does not damage the sample and can be used under various conditions. Therefore, it was widely used to study the secondary structure of peptides and proteins.36 As shown as in Fig. 1C, three protein characteristic bands can be clearly observed in the spectrum. Amide I: the strong absorption peak at 1655 cm−1 indicates that SZSP has a α-helix structure (1650–1658 cm−1) due to the C![[double bond, length as m-dash]](https://www.rsc.org/images/entities/char_e001.gif) O stretching.37 Amide II: two strong absorption peaks (1535 cm−1, 1450 cm−1) represent the NH bending and CN stretching, respectively. Amide III: the absorption peak at 1240 cm−1 indicates that SZSP has a β-sheet structure (1220–1250 cm−1) due to the N–H bending. The strong absorption peak at 600 cm−1 may be caused by the influence of phosphate groups.37 These results further prove that SZSP has a typical protein structure. Moreover, strong absorption signals at 1100 cm−1 were observed in SZSP, indicating the presence of glycoproteins.38,39
O stretching.37 Amide II: two strong absorption peaks (1535 cm−1, 1450 cm−1) represent the NH bending and CN stretching, respectively. Amide III: the absorption peak at 1240 cm−1 indicates that SZSP has a β-sheet structure (1220–1250 cm−1) due to the N–H bending. The strong absorption peak at 600 cm−1 may be caused by the influence of phosphate groups.37 These results further prove that SZSP has a typical protein structure. Moreover, strong absorption signals at 1100 cm−1 were observed in SZSP, indicating the presence of glycoproteins.38,39
3.6. Circular dichroism (CD)
CD spectra in the far ultraviolet (190–250 nm) are often used as an indicator of a protein's secondary structure, indicating the presence of α-helices, β-sheets, β-turns and random coils.40,41 Therefore, CD spectroscopy was applied to characterize the spatial conformation of SZSP. The CD spectra and the secondary structure content of SZSP at pH 5.0, 7.0 and 9.0 are shown in Fig. 1D and Table 3. The CD spectra of SZSP at pH 5.0, 7.0 and 9.0 all showed a strong positive band near 190 nm and a dominant negative band near 205 nm, which indicate that a main β-sheet structure was present. As shown in Table 3, the secondary structure of SZSP consisted of α-helices (15.78, 20.33 and 17.89%), β-sheets (47.22, 50.21 and 48.77%), β-turns (21.31, 21.16 and 19.92%) and random coils (39.77, 40.61 and 40.01%) at pH 5.0, 7.0 and 9.0. In the secondary structure analysis of the protein, the high content of α-helices indicates that it is susceptible to electrostatic action, while the high content of β-sheets indicates that it is susceptible to hydrophobic action. The random coil content of SZSP was about 40.00% with no significant change at different pH states. Therefore, the structure of SZSP was loose and may be unstable in hydrophobic environments, which is conducive to human denaturation and digestion.
Table 3 Secondary structure composition of SZSP at pH 5.0, 7.0 and 9.0a
| Secondary structure |
Content (%) |
| pH = 5.0 |
pH = 7.0 |
pH = 9.0 |
| Results are expressed as the mean ± standard deviation (n = 3). |
| α-helices |
15.78 ± 0.11 |
20.33 ± 0.07 |
17.89 ± 0.04 |
| β-sheets |
47.22 ± 0.10 |
50.21 ± 0.08 |
48.77 ± 0.12 |
| β-turns |
21.31 ± 0.08 |
21.16 ± 0.07 |
19.92 ± 0.13 |
| Random coils |
39.77 ± 0.07 |
40.61 ± 0.11 |
40.01 ± 0.06 |
3.7. Surface charge
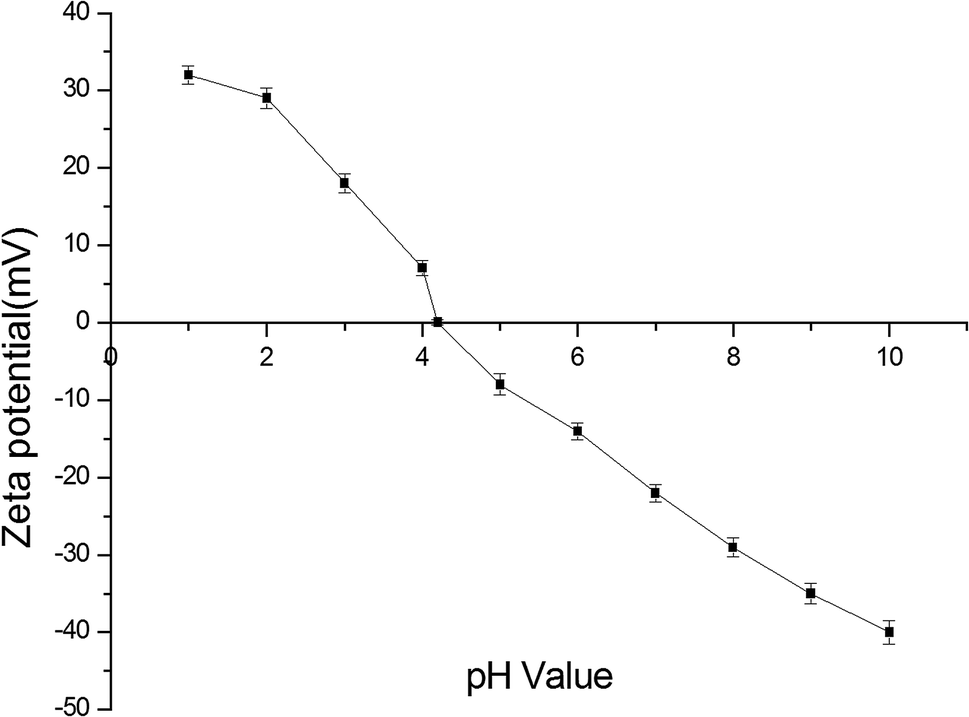
The zeta potential can accurately indicate the strength of interactions between particles, thereby predicting the stability of the colloidal solution. When there are many negative and positive charges in the solution, a large potential is generated, the solution becomes more stable and the protein content in the solution increases. Conversely, when the content of positive and negative charges in the solution is low, the zeta potential becomes very low and the protein will coagulate and precipitate. As shown in Fig. 2, the surface charge of the SZSP solution was measured when the pH was varied in the range of 1–10. At the beginning, the zeta potential decreased with increasing pH value. When the starting pH was 1.0, the maximum positive charge was 32.62 mV. When the pH value increased to about 4.0, the zeta potential of SZSP decreased to the zero point. As the pH value rose further, the zeta potential increased again until it reached a maximum negative charge (−40.11 mV) at a pH value of 10.0. Therefore, when pH = 4.2, the solubility of SZSP was the lowest, which was the isoelectric point of the SZSP solution.
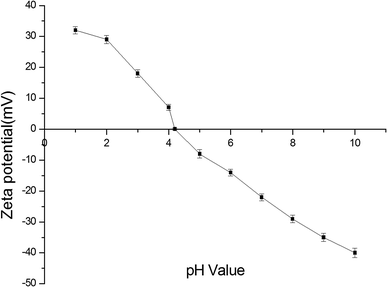 |
| | Fig. 2 Zeta potential of SZSP at different pH values. | |
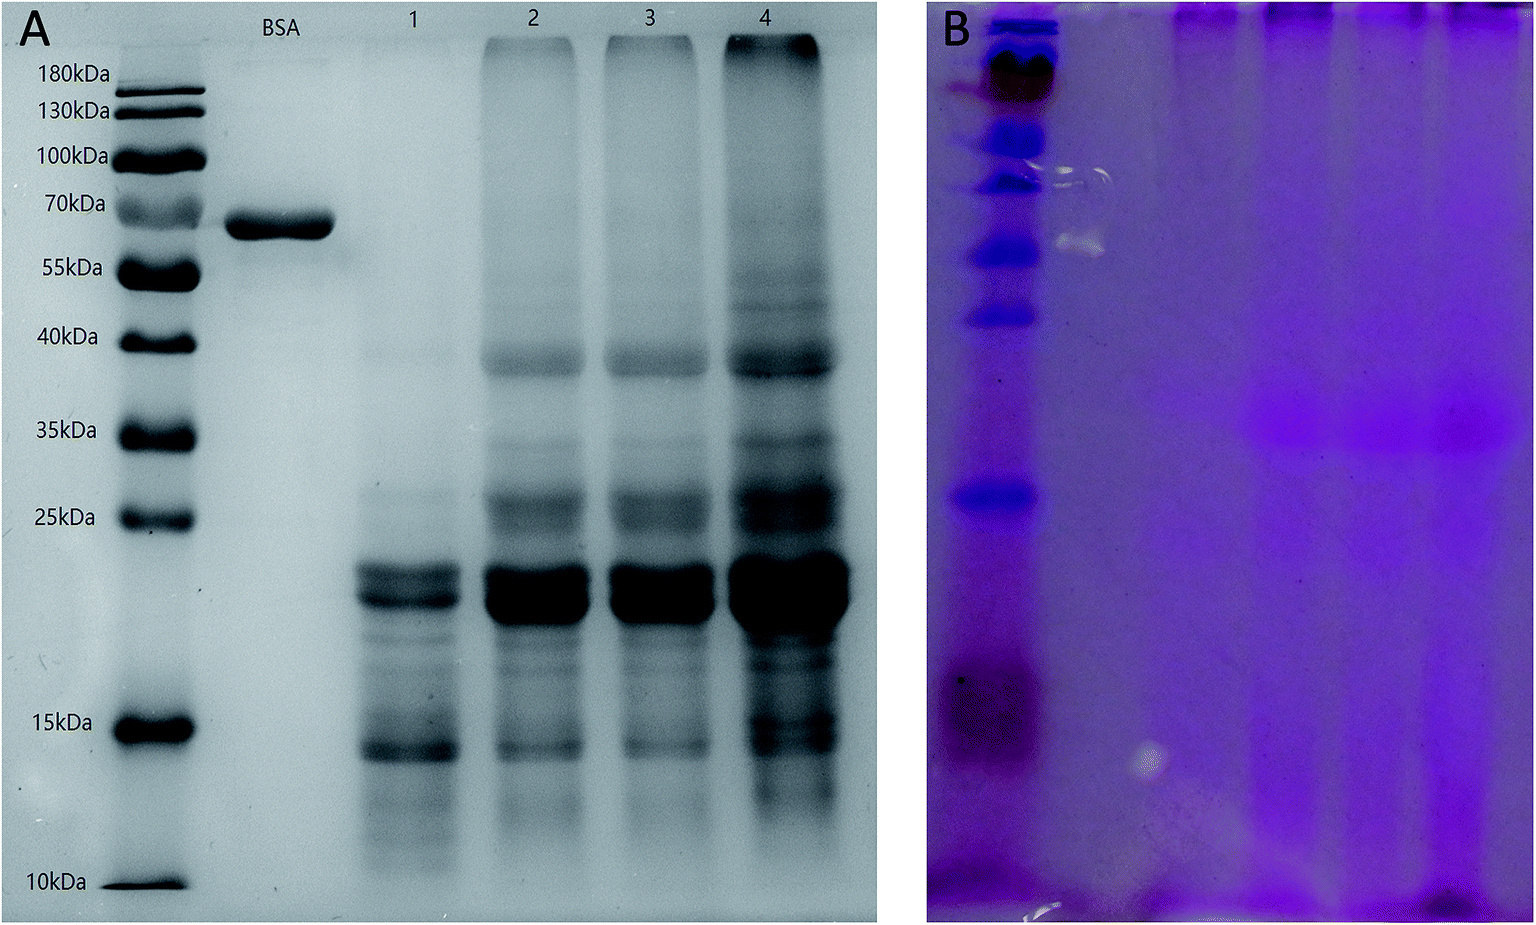
3.8. SDS-PAGE
SDS-PAGE is commonly used to provide information about the molecular weight (MW) and components of a protein.42 The electrophoresis patterns of SZSP under reducing conditions are presented in Fig. 3A and B. Lane M was the marker standards, lanes 1 to 4 are different concentrations of SZSP and lane BSA was albumin from bovine serum as a reference. The results show that SZSP was mainly composed of low molecular weight subunits and had five main bands in the range of 10–40 kDa (15, 20, 25, 35, 40 kDa). Alternatively, glycoproteins in SZSP were tested by acid Schiff staining.16 Fig. 3B shows the periodic acid Schiff staining pattern of SZSP. The lane distribution was the same as mentioned above, in the order of marker, BSA and four lanes of SZSP. Periodic acid Schiff staining showed that two glycoprotein bands were positive at 25 and 35 kDa, indicating that the 25 and 35 kDa subunits are mainly glycoproteins, which was consistent with the FTIR spectrum results, where the absorption peak at 1100 cm−1 indicated the presence of a C–O tensile vibration, further confirming that SZSP contains glycoproteins.38,39 Glycoproteins are formed by covalent bonding of oligosaccharide chains and proteins. The sugar group contains a large number of hydrophilic groups, such as hydroxyl, carboxyl and amino groups, which can improve the solubility of the protein. Studies have shown that there are some differences in the functional properties of glycoproteins and non-glycoproteins. Glycoproteins can play a better functional role and contain better biological activities. Many researchers have conducted glycosylation of non-glycoproteins through various glycosylation methods to alter the functional and structural properties of proteins, thereby improving the solubility, emulsification, foaming and gel properties of proteins.43–45 We found that SZSP contains natural glycoprotein, which may be a reason for the good foaming, emulsifying and gelation properties of SZSP.
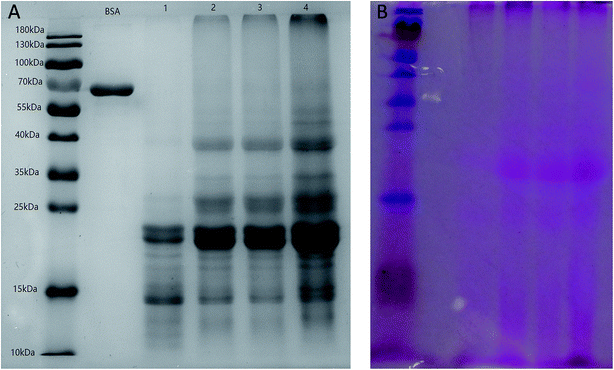 |
| | Fig. 3 SDS-PAGE patterns of SZSP. Gel electrophoresis of SZSP (A), periodic acid-Schiff stained SDS-PAGE of SZSP (B). M, marker standard; BSA, albumin from bovine serum control; lanes 1–4, different concentrations of SZSP. | |
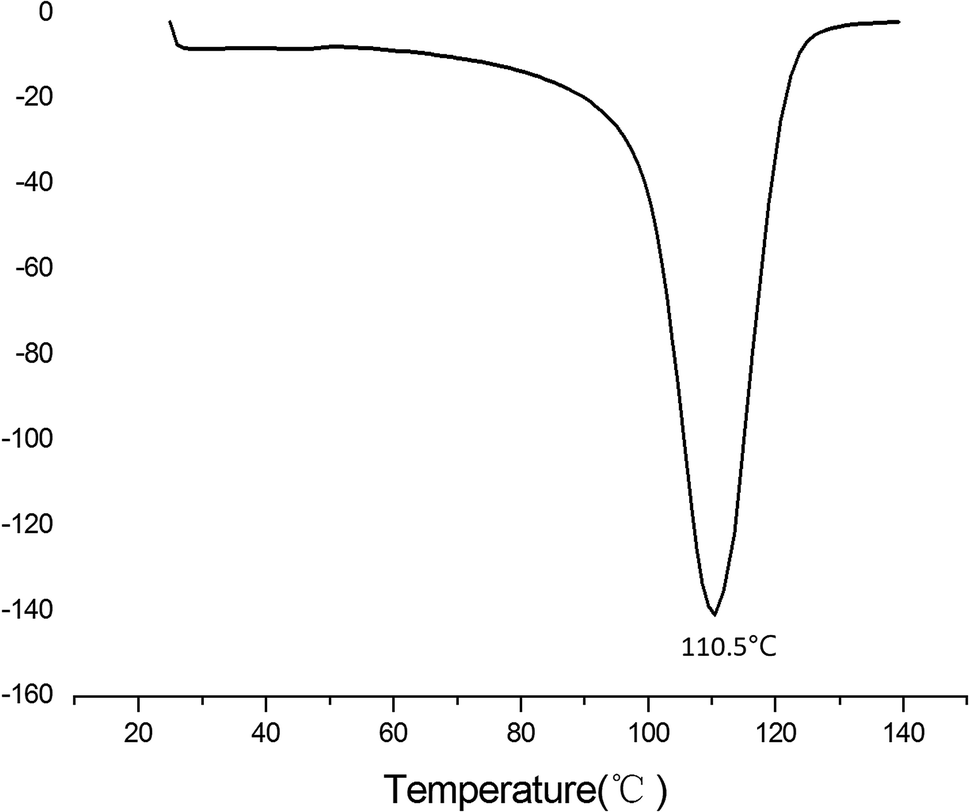
3.9. Thermal properties
Differential scanning calorimetry (DSC) can be used to analyze basic information about the thermal properties of proteins. Specifically, Td reflects the thermal stability of proteins: the higher the Td value, the better the thermal stability; and ΔH reflects the secondary structure: the higher the ΔH value, the greater the bond energy. The thermal characteristics of SZSP were determined, as shown as in Fig. 4. As the temperature increased during the heating process, the main structure of the SZSP became unstable, possibly due to the fact that the total protein contains different molecular weight proteins, showing a curvilinear change. The highest denaturation temperature of SZSP was 110.5 °C, as shown in Fig. 4, and the Td was higher than common seed proteins, such as hemp isolate (95 °C), citron seed isolate (93.7 °C) and kidney bean isolate (91 °C),14,20,46 which elucidated that SZSP has a high thermal stability. The thermal stability of the proteins was affected by their hydrophobic interactions, interactions between ionic bonds, disulfide bonds, and aromatic rings. The higher proportion of hydrophobic amino acids in SZSP could be a main reason for the higher denaturation temperature. Another reason could be related to the protein extraction by the alkaline extraction and acid precipitation method, a large amount of salt may be generated during the extraction process or a protein component with high thermal stability may be formed under high pH extraction conditions.47 The ΔH of SZSP was 61.32 J g−1, which is better than previously reported seed proteins, such as flax seed protein (ΔH = 8.25 J g−1) and peanut protein (ΔH = 6.26 J g−1).7,48 Heat treatment of proteins is the main processing method in the food industry. High protein Td values are more conducive to the preparation of different materials.49
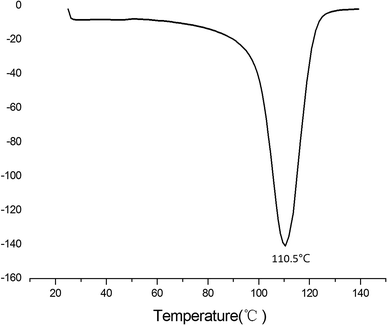 |
| | Fig. 4 DSC profiles of SZSP. | |
3.10. Sulfhydryl and disulfide bond contents
Sulfhydryl groups (SH) and disulfide bonds (SS) are important chemical bonds for maintaining the spatial structure of proteins. The SH and SS are shown in Table 4. The content of free SH in SZSP was 34.87 μM g−1, and it was higher than that of the Akebia trifoliata var. australis seed protein (10.82 μM g−1).50 Proteins with high SH content usually have a strong ability to bind or aggregate with each other. Disulfide bonds are covalent bonds that can make the spatial structure of the peptide chain more closely related to the content of sulfur-containing amino acids. The contents of disulfide bonds in SZSP were 19.86 μM g−1, which indicates that SZSP will have high thermal stability, which is consistent with the previous experimental results.47 Moreover, the disulfide bonds in SZSP were higher than that of red bean globulin (15 μM g−1) and Torreya grandis seed protein isolate (18 μM g−1).46,51
Table 4 Water absorption capacity (WAC), oil absorption capacity (OAC), free sulfhydryl group (SH), total sulfhydryl group, disulfide bond (SS) and least gelation concentration (LGC) of SZSP and SPIa
| Functional property |
SZSP |
SPI |
| Results are presented as the mean ± standard deviation (n = 3). |
| WAC (g g−1) |
3.63 ± 0.21 |
4.36 ± 0.25 |
| OAC (g g−1) |
2.38 ± 0.32 |
5.32 ± 0.36 |
| Free sulfhydryl group (μM g−1 protein) |
34.87 ± 0.61 |
— |
| Total sulfhydryl group (μM g−1 protein) |
74.59 ± 1.39 |
— |
| Disulfide bond (μM g−1 protein) |
19.86 ± 0.43 |
— |
| LGC (%) |
7.0 |
— |
3.11. Protein solubility
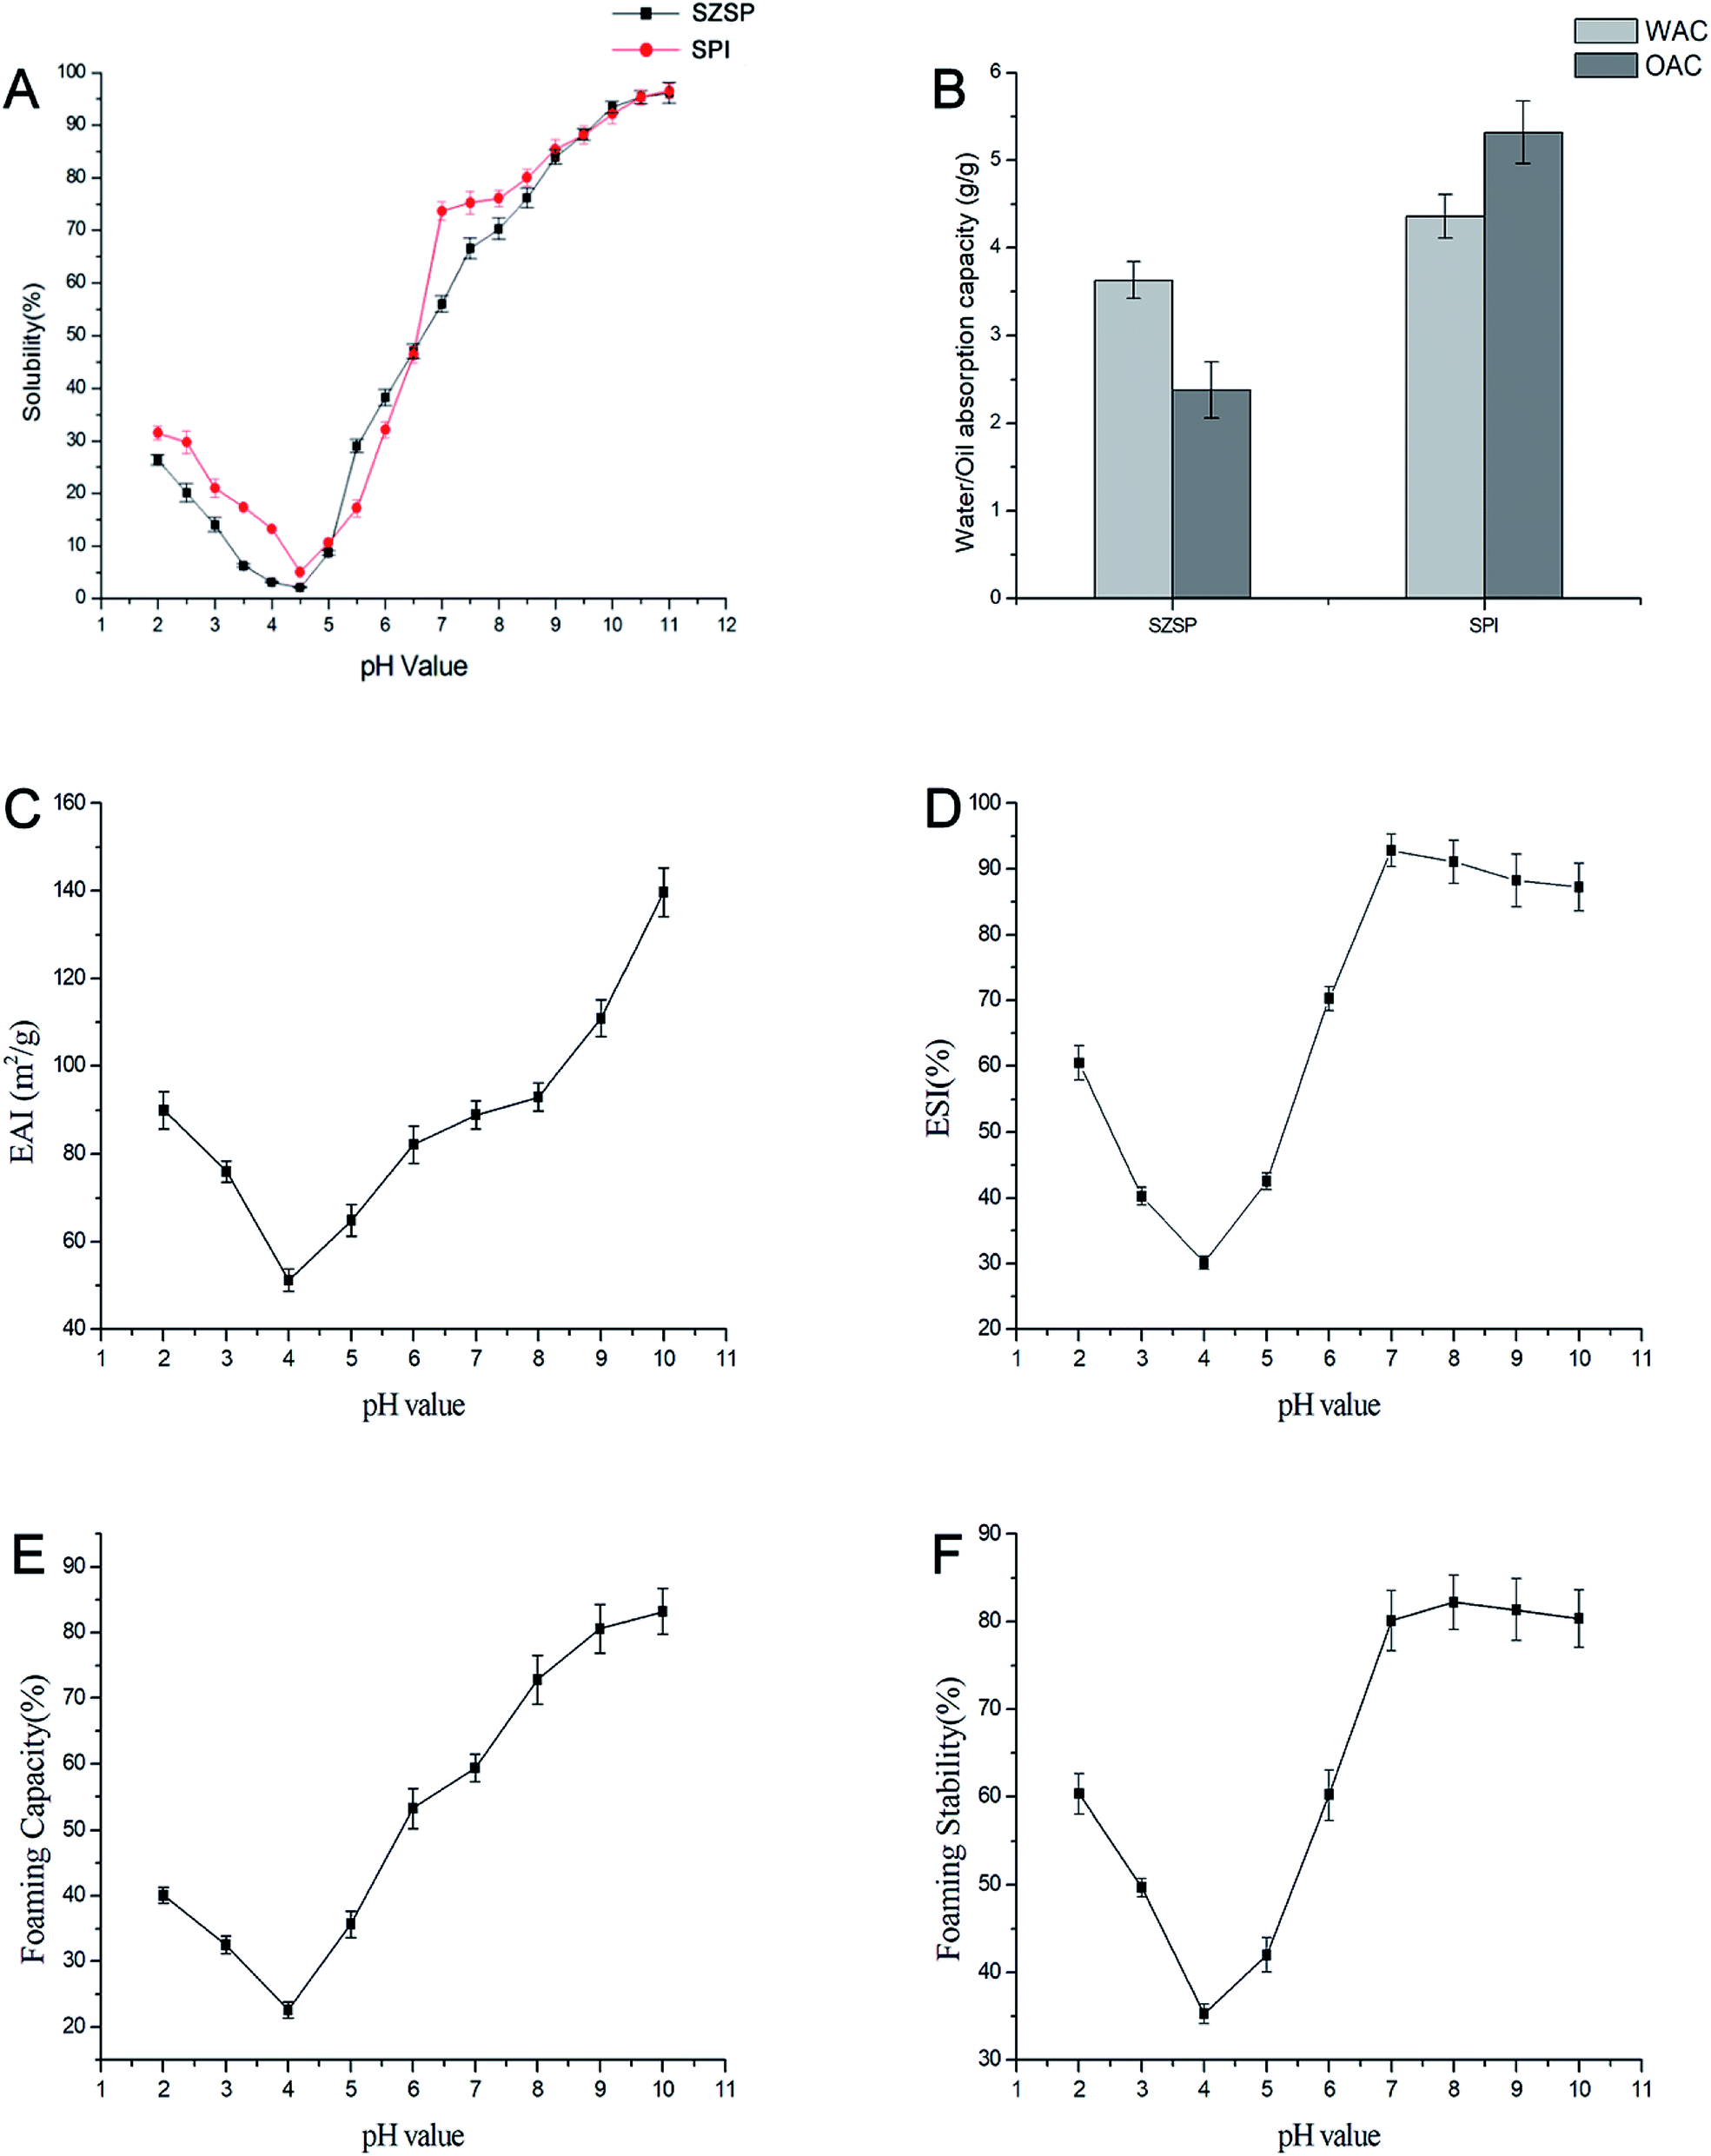
Protein solubility is one of the most important physicochemical properties, which has a great dependence on the pH value of the solution and affects the color, texture and taste of the products. The solubility of SZSP and SPI at pH 2.0–11.0 are shown in Fig. 5A. The solubility of SZSP showed a classic “U-shape” with changing pH, and there was an obvious turning at the isoelectric point. The solubility of the sample changes due to the influence of pH, which was similar to that in SPI. The solubility reached the lowest point at pH 4.2, which was consistent with the isoelectric point (pH 4.2) determined by the zeta potential. When the pH value is lower or higher than the isoelectric point, the solubility of the protein increased continuously. The lower solubility near the isoelectric point was due to the positive and negative charge balance, which weakens the interaction between water and proteins, enhances the interaction between proteins and causes protein aggregation and precipitation.52 When the pH differed from the isoelectric point, the positive and negative charge content in the solution changed, which enhanced the interactions between protein and water, leading to increased solubility. Under alkaline conditions, with the increased negative charge of the solution, the solubility growth trend accelerated until SZSP was almost completely dissolved (pH 11.0). A similar pH solubility profile was also observed for Thlaspi arvense protein, peanut protein, cashew nut protein, Indian black gram, defatted wheat germ protein and Brassica carinata protein isolate.53–56 The solubility of SZSP under neutral conditions was slightly lower than that of SPI. However, there were no differences between them at pH 9–11.
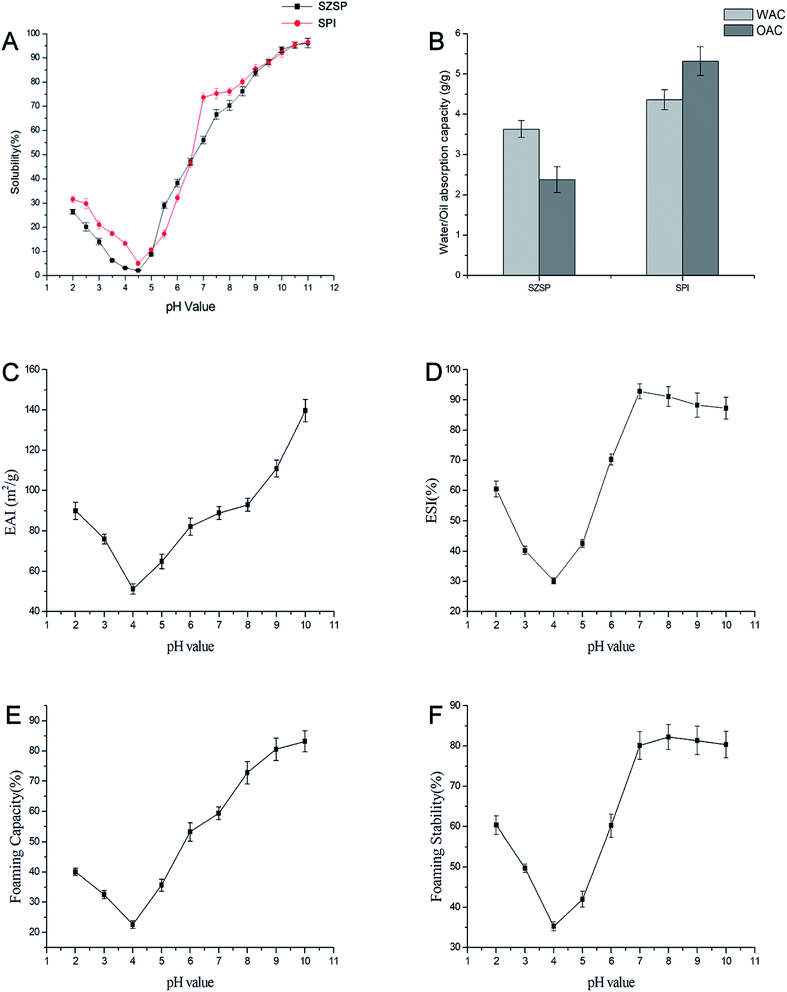 |
| | Fig. 5 Effects of pH on the functional properties of SZSP(A); WAC and OAC of SZSP and SPI(B); effect of pH on EAI(C); effect of pH on ESI(D); effect of pH on FC (E); effect of pH on FS (F). | |
3.12. WAC and OAC
WAC is an important index parameter for the ability of proteins to bind water. It is used to evaluate the strength of the interaction between protein products and water. It is mainly affected by the amino acid composition, structural conformation and hydrophobicity of proteins.50 The WAC of SZSP is shown in Fig. 5B and Table 4 using SPI as a reference. The WAC of SZSP (3.63 g g−1) was slightly less than that of SPI (4.36 g g−1), but higher than that of mung bean protein (2.1 g g−1), faba bean protein (0.95 g g−1) and black bean protein (2.9g g−1).14,57 Previous reports have indicated that proteins with a WAC of 1.49 to 4.72 g g−1 are more suitable for processing sticky foods.58 Therefore, SZSP could be a good auxiliary ingredient for sticky foods.
The OAC usually reflects the ability of non-polar side chains of proteins to bind to lipids, which can affect the taste, texture and flavor of protein products. OAC is mainly affected by the type of protein and hydrophobic residues, and when there are more hydrophobic residues, proteins will have a better OAC.59 The OAC value of SZSP was 2.38 g g−1, which was lower than that of soy protein isolate (5.32 g g−1), but higher than that of hemp protein (1.79 g g−1).14
3.13. Emulsifying properties
The emulsifying properties of food proteins are very important for many applications, such as beverages, cake, frozen desserts, mayonnaise, sauces, milks, batters and coffee creamers. Emulsifying properties can be described by the emulsifying ability (EAI) and emulsion stability (ESI) indices.60 EAI has been reported to be affected by surface hydrophobicity and solubility.50 Fig. 5C shows that when the pH value approaches the isoelectric point, the EAI has a minimum value. When it increases from 4.0 to 10.0, the EAI significantly increases from 51.22 to 139.72 m2 g−1, which is consistent with the effect of pH on the emulsifying ability of different seed proteins, such as peanut protein, Chinese quince seed protein and tree peony seed protein.5,7,61 The poor solubility of SZSP near the isoelectric point leads to aggregation and precipitation, and there is not enough protein in the solution to combine with oil to form a uniform emulsion. With the formation of an alkaline environment in the solution, the pH value increases, and the solubility and EAI significantly increase. Generally, in acid and alkali solutions with reasonable strength, the solubility of proteins and extraction efficiency will be increased. A main reason may be that the change in pH of the solution changes the amount of charges in the dispersed solution, and the secondary bond arrangements of the protein change. Protein is an amphoteric electrolyte, and the stability of a solution mostly depends on changes in the electric charge. The net electric charge near the isoelectric point tends to be 0, and the repulsion between adjacent protein molecules weakens, leading to aggregation, making SZSP unable to effectively diffuse on the oil–water interface.62 When the pH value of the solution is higher than the isoelectric point of SZSP, the protein molecules carry more negative charges, the electrostatic repulsion between the molecules increases, the folding structure of SZSP expands, such as α-helices, β-sheets, β-turns, hydrogen bonds, ionic bonds and hydrophobic bonds, and the hydrophobic groups inside the protein are exposed to the surface, which promotes binding with the oil phase and increases the contact area of the oil–water interface, thus accelerating the protein emulsification.63,64 At the same time, SZSP contains glycoprotein. Owing to the introduction of glycosyl groups, the content of hydroxyl in the molecule of the protein that contains sugar components increases, and the hydrophilicity of the protein is improved.65 Under the synergistic effects of the above two factors, SZSP can more easily reach a hydrophilic–lipophilic equilibrium state in the dispersion system, significantly improving the emulsifying ability of SZSP. The EAI of SZSP increased significantly when the pH was greater than 8, indicating that the protein contains more negative charges, which is more conducive to the formation of stable emulsions.18 Therefore, SZSP could be an alternative candidate emulsifier in the food industry.
The influence of pH on ESI is presented in Fig. 5D. The ESI of SZSP is similar to that of EAI. When the pH value is near the isoelectric point, the ESI has a minimum value. With an increase of the pH value from 4.0 to 7.0, ESI increased from 30.12% to 92.83%. This could be due to a more hydrated layer forming around the interface, which reduces the interfacial energy and delays the coalescence of droplets.7 SZSP's ESI slightly decreased from 92.83% to 87.25% when the pH increased from 7.0 to 10.0. This slight decrease of the ESI may be due to the influence of alkaline conditions on the structure of SZSP, which alters the interactions between protein molecules.18
3.14. Foaming properties
The foaming properties of proteins are important when applied in the food industry as they indicate the capacity to form an interfacial skin when the protein unfolds that keeps air bubbles in suspension and prevents their collapse.59 Foaming capacity (FC) is the ability of a protein to form a foam under certain conditions (i.e., concentration, pH and temperature), while FS represents the ability of a protein to retain a foam volume over a measured period of time. As shown in Fig. 5E, FC has a positive correlation with protein solubility, and greater solubility is a prerequisite for good FC. SZSP's FC increased from 22.61% to 83.21% as the pH increased from 4.0 to 10.0 and reached a maximum point (83.21%) at pH 10.0. The higher protein solubility improved the water–protein interaction, letting it fully interact with air during the re-stirring process, thereby allowing better air encapsulation and more foam generation. The high FC under alkaline conditions further proves that SZSP has a more flexible protein structure, which could be related to the glycoprotein components contained in SZSP because the glycosylation of the protein can increase its solubility.18,55 This result was consistent with previous reports that showed that an increase in pH is conducive to improving foaming capacity.18
The foaming stability (FS) refers to the ability to maintain foam and prevent it from bursting and coalescing for a period of time after it has been formed.66 There are many factors that affect the FS, including properties of the protein membranes such as solubility, viscosity and elasticity, pH and temperature.67 The effect of pH value on the FS of SZSP was similar to that of FC. The effect of pH on the FS of SZSP is shown in Fig. 5F. The FS increased from 35.29% to 82.21% when the pH increased from 4.0 to 10.0, reaching a maximum (82.21%) value at pH 8.0. The results show that SZSP may be a suitable foaming agent in the food industry.
3.15. Least gelation concentration (LGC)
The LGC indicates the gelation capacity, and the lower the LGC, the better the gelling ability of proteins. The LGC of SZSP was 7% (w/v), indicating significant gel-forming ability compared with soybean protein isolate (14% w/v), mung bean protein isolate (10% w/v), Chinese quince seed (8% w/v) and pinto bean protein (16% w/v),6,68,69 suggesting that SZSP has a better gelling ability than other plant protein isolates. The gel properties of proteins may be due to a combination of protein properties such as denaturation, aggregation and network formation.70 In general, the gel behavior of proteins is mainly affected by disulfide bonds, hydrogen bonds and hydrophobic interactions. In the process of gel formation, a strong reaction between proteins occurs, which alters the hydration of protein molecules and enhances the gel forming ability.
4. Conclusions
The SZSP content extracted by alkaline extraction and acid precipitation method was 83.45%, and the structure, physicochemical and functional properties of the protein were investigated. The results showed that SZSP was mainly composed of a β-sheet structure with a high random coil content and good thermal stability. Electrophoretic tests indicated that SZSP was mainly composed of proteins with a molecular weight of less than 40 kDa, and contained a certain amount of glycoprotein, which was further confirmed by FTIR analysis and Schiff reagent staining observations. SZSP has an ideal amino acid composition, and the EAAs content met the requirements of WHO/FAO for adult intake. SZSP also has outstanding functional characteristics. Under neutral and alkaline conditions, SZSP has good protein solubility, emulsification and foaming properties, which tended to decrease first and then increase with pH change. In addition, SZSP was found to have excellent gel properties during LGC determination, which means that SZSP requires less protein during processing and molding. Therefore, SZSP has good processing properties and can become a new plant protein source as a food additive and nutritional supplement.
Conflicts of interest
All authors declare no conflicts of interest.
Acknowledgements
This study was supported by grants from the National Key Research and Development Program: research on key technologies of ginseng industry and development of massive health products (2017YFC1702100); the Science and Technology Development Plan Project of Jilin Province (20180623041TC); Changchun Science and Technology Bureau Project: Key Technologies and Product Development of Traditional Chinese Medicine Health Food based on Jing Fang and Yan Fang (17YJ007). We thank LetPub (http://www.letpub.com) for its linguistic assistance during the preparation of this manuscript.
References
- L. Shen, X. Wang, Z. Wang, Y. Wu and J. Chen, Food Chem., 2008, 107, 929–938 CrossRef CAS.
- J. Aschemann-Witzel and A. O. Peschel, Food Hydrocolloids, 2019, 96, 20–28 CrossRef CAS.
- W. W. Peng, X. Z. Kong, Y. M. Chen, C. M. Zhang, Y. X. Yang and Y. F. Hua, Food Hydrocolloids, 2016, 52, 301–310 CrossRef CAS.
- Y. Q. Li, Z. X. Chen and H. Z. Mo, LWT–Food Sci. Technol., 2007, 40, 1167–1175 CrossRef CAS.
- L. L. Gao, Y. Q. Li, Z. S. Wang, G. J. Sun and H. Z. Mo, Food Chem., 2017, 240, 980–988 CrossRef.
- Y. J. Deng, L. X. Huang, C. H. Zhang, P. J. Xie, J. Cheng, X. J. Wang and S. H. Li, Food Chem., 2019, 283, 539–548 CrossRef CAS PubMed.
- H. W. Wu, Q. Wang, T. Z. Ma and J. J. Ren, Food Res. Int., 2009, 42, 343–348 CrossRef CAS.
- Chinese Pharmacopoeia Commission, The Pharmacopoeia of People's Republic of China (Part 1). China Medical Pharmaceutical Science and Technology Publishing House, Beijing, 2015, p. 343 Search PubMed.
- J. L. Shergis, X. Ni, J. Sarris, A. L. Zhang, X. Guo and C. C. Xue, Phytomedicine, 2017, 34, 38–43 CrossRef CAS.
- J. C. Zhao, Sci. and Tech. Food Ind., 2014, 35, 249–257 CAS.
- V. J. Rodríguez and V. L. Rodríguez, Phytother. Res., 2017, 31, 347–365 CrossRef.
- Y. Y. Du, B. S. He, Q. Li, J. He, D. Wang and K. Bi, J. Sep. Sci., 2017, 40, 2914–2924 CrossRef CAS.
- AOAC. Official methods of analysis of AOAC international, Association of Official Analytical Chemists, Washingto, DC, USA, 19th edn, 2000 Search PubMed.
- C. H. Tang, Z. Ten, X. S. Wang and X. Q. Yang, J. Agric. Food Chem., 2006, 54, 8945–8950 CrossRef CAS.
- U. K. Laemmli, Nature, 1970, 227, 680–685 CrossRef CAS PubMed.
- R. M. Zacharius, T. E. Zell and J. H. Morrison, Anal. Biochem., 1969, 30, 148–152 CrossRef CAS.
- M. X. Du, J. H. Xie, B. Gong, X. Xu, W. Tang, X. Li, C. Li and M. Y. Xie, Food Hydrocolloids, 2018, 76, 131–140 CrossRef CAS.
- S. A. Malomo and R. E. Aluko, Food Hydrocolloids, 2015, 43, 743–752 CrossRef CAS.
- T. Xiong, W. F. Xiong, M. T. Ge, J. H. Xia, B. Li and Y. J. Chen, Food Res. Int., 2018, 109, 260–267 CrossRef CAS PubMed.
- K. Shevkani, N. Singh, A. Kaur and J. C. Rana, Food Hydrocolloids, 2015, 43, 679–689 CrossRef CAS.
- L. Y. Wu, M. M. Zhang, X. Xin, F. R. Lai and H. Wu, Food Funct., 2019, 10, 2894–2905 RSC.
- M. M. Bradford, Anal. Biochem., 1976, 72, 248–254 CrossRef CAS PubMed.
- H. Tomotake, I. Shimaoka, J. Kayashita, M. Nakajoh and N. Kato, J. Agric. Food Chem., 2002, 50, 2125–2129 CrossRef CAS PubMed.
- X. Y. Meng, T. T. Li, T. Song, C. Chen, C. Venkitasamy, Z. L. Pan and H. E. Zhang, Food Sci. Nutr., 2019, 7, 2556–2564 CAS.
- A. P. Adebiyi and R. E. Aluko, Food Chem., 2011, 128, 902–908 CrossRef CAS.
- M. A. Malik and C. S. Saini, Food Hydrocolloids, 2017, 63, 705–715 CrossRef CAS.
- K. L. Chee, H. K. Ling and M. K. Ayob, LWT–Food Sci. Technol., 2012, 46, 0–427 CrossRef CAS.
- A. K. Stone, A. Karalash, R. T. Tyler, T. D. Warkentin and M. T. Nickerson, Food Res. Int., 2015, 76, 31–38 CrossRef CAS.
- M. R. Sandovaloliveros and O. Paredeslópez, J. Agric. Food Chem., 2013, 61, 193–201 CrossRef CAS PubMed.
- M. A. Herman, P. She, O. D. Peroni, C. J. Lynch and B. B. Kahn, J. Biol. Chem., 2010, 285, 11348–11356 CrossRef CAS PubMed.
- FAO/WHO, Protein Quality Evaluation; Report of joint FAO/WHO expert consultation, Rome, Italy, 1991 Search PubMed.
- I. Trigui, Z. Zarai, S. Chevance, S. Cheikh-Rouhou, H. Attia and M. A. Ayadi, Int. J. Biol. Macromol., 2019, 126, 454–465 CrossRef CAS PubMed.
- J. R. Lakowicz, Principles of fluorescence spectroscopy, Springer Science Business Media, New York, 3rd edn, 1983 Search PubMed.
- G. M. Palmer, P. J. Keely and T. M. Breslin, Photochem. Photobiol., 2010, 78, 462–469 CrossRef.
- H. Y. Zeng, L. H. Cai, X. L. Cai, Y. J. Wang and Y. Q. Li, J. Mol. Struct., 2011, 1001, 139–144 CrossRef CAS.
- J. L. Kong and S. N. Yu, Acta Biochim. Biophys. Sin., 2007, 39, 549–559 CrossRef CAS PubMed.
- G. M. S. El-Bahy, J. Appl. Spectrosc., 2005, 72, 111–116 CrossRef CAS.
- M. R. Almeida, R. S. Alves, L. B. Nascimbem, R. Stephani, R. Poppi and L. F. de Dliveira, Anal. Bioanal. Chem., 2010, 397, 2693–2701 CrossRef CAS PubMed.
- X. Y. Pu, X. L. Ma, L. Lu, J. Ren, H. B. Li, X. Y. Li, S. Yu, W. J. Zhang and W. B. Fan, Carbohydr. Polym., 2016, 137, 154 CrossRef CAS PubMed.
- V. Cabra, R. Arreguin, A. Galvez, M. Quirasco, R. Vazquez-Duhalt and A. Farres, J. Agric. Food Chem., 2005, 53, 725–729 CrossRef CAS PubMed.
- X. F. Ren, H. L. Ma, S. Y. Mao and H. J. Zhou, Eur. Food Res. Technol., 2014, 238, 435–442 CrossRef CAS.
- S. Mundi and R. E. Aluko, Food Res. Int., 2012, 48, 299–306 CrossRef CAS.
- J. X. Zheng, H. Yin, C. C. Shen, L. Zhang, D. F. Ren and J. Lu, Food Chem., 2020, 306, 125615 CrossRef CAS PubMed.
- R. Horax, N. Hettiarachchy and P. Chen, J. Food Sci., 2014, 79, C2215–C2221 CrossRef CAS PubMed.
- F. C. Zha, S. Y. Dong, J. J. Rao and B. C. Chen, Food Chem., 2019, 285, 130–138 CrossRef CAS PubMed.
- M. Yu, M. M. Zeng, F. Qin, Z. Y. He and J. Chen, Food Chem., 2017, 227, 453–460 CrossRef CAS PubMed.
- F. Peyrano, F. Speroni and M. V. Avanza, Innovative Food Sci. Emerging Technol., 2016, 33, 38–46 CrossRef CAS.
- P. Kaushik, K. Dowling, S. Mcknight, C. J. Barrow, B. Wang and B. Adhikari, Food Chem., 2016, 197, 212–220 CrossRef CAS PubMed.
- P. Davis and S. Williams, Allergy, 1998, 53, 102–105 CrossRef CAS PubMed.
- Y. X. Du, Y. Jiang, X. M. Zhu, H. Xiong, S. H. Shi, J. W. Hu, H. L. Peng, Q. Zhou and W. J. Sun, Food Chem., 2012, 133, 923–929 CrossRef CAS.
- G. T. Meng and C. Y. Ma, Int. J. Food Sci. Technol., 2010, 37, 687–695 CrossRef.
- P. Ivanova, V. Chalova, L. Koleva and I. Pishtiyski, Int. Food Res. J., 2013, 20, 2995–3000 Search PubMed.
- M. P. Hojilla-Evangelista, G. W. Selling, M. A. Berhow and R. L. Evangelista, J. Am. Oil Chem. Soc., 2015, 92, 905–914 CrossRef CAS.
- S. O. Ogunwolu, F. O. Henshaw, H. P. Mock, A. Santros and S. O. Awonorin, Food Chem., 2009, 115, 852–858 CrossRef CAS.
- K. X. Zhu, X. H. Sun, Z. C. Chen, W. Peng, H. F. Qian and H. M. Zhou, Food Chem., 2010, 123, 1163–1169 CrossRef CAS.
- J. Pedroche, M. M. Yust, H. Lqari, J. Girón-Calle, M. Alaiz, J. Vioque and F. Millán, Food Chem., 2004, 88, 337–346 CrossRef CAS.
- D. Tenin and J. Hardy, J. Agric. Food Chem., 1996, 44, 3029–3032 CrossRef.
- O. Aletor, A. A. Oshodi and K. Ipinmoroti, Food Chem., 2002, 78, 63–68 CrossRef CAS.
- I. A. Wani, D. S. Sogi, U. S. Shivhare and B. S. Gill, Food Res. Int., 2015, 76, 11–18 CrossRef CAS.
- M. Tirgar, P. Silcock, A. Carne and E. J. Birch, Food Chem., 2017, 215, 417–424 CrossRef CAS PubMed.
- Y. J. Deng, L. X. Huang, C. H. Zhang, P. J. Xie, J. Cheng, X. J. Wang and S. H. Li, Food Chem., 2019, 283, 539–548 CrossRef CAS PubMed.
- C. Li, J. Z. Yang, L. Yao, F. L. Qin, G. F. Hou, B. Chen, L. H. Jin, J. J. Deng and Y. H. Shen, Food Chem., 2020, 311, 125888 CrossRef PubMed.
- M. Yuliana, C. T. Truong, L. H. Huynh, Q. P. Ho and Y. H. Ju, LWT–Food Sci. Technol., 2014, 55, 621–626 CrossRef CAS.
- I. Trigui, Z. Zarai, S. Chevance, S. Cheikh-Rouhou, H. Attia and M. A. Ayadi, Int. J. Biol. Macromol., 2019, 126, 454–465 CrossRef CAS PubMed.
- F. C. Zha, Z. Y. Yang, J. J. Rao and B. C. Chen, J. Agric. Food Chem., 2019, 67, 10195–10206 CrossRef CAS PubMed.
- C. Zhong, R. Wang, Z. Zhou, S. R. Jia, Z. L. Tan and P. P. Han, J. Agric. Food Chem., 2012, 60, 10337–10342 CrossRef CAS PubMed.
- S. Saiut, S. Ketnawa, P. Chaiwut and S. Rawdkuen, Asian Journal Of Food & Agro-industry, 2009, 27, 111–161 Search PubMed.
- C. W. Coffman and V. V. Garcia, J. Food Sci. Technol., 1977, 12, 473–484 CrossRef.
- B. O. Okezie and A. B. Bello, J. Food Sci., 2010, 53, 450–454 CrossRef.
- M. Kaur and N. Singh, Food Chem., 2007, 102, 366–374 CrossRef CAS.
Footnote |
| † These authors contributed to the work equally and should be regarded as co-first authors. |
|
| This journal is © The Royal Society of Chemistry 2020 |
Click here to see how this site uses Cookies. View our privacy policy here. 
 Open Access Article
 This Open Access Article is licensed under a Creative Commons Attribution-Non Commercial 3.0 Unported Licence
 a,
Shuai Shao†b,
Rongxin Hana,
Rongrong Zhanga,
Xintong Maa,
Miao Wanga,
Zhiqiang Wana,
Daqing Zhao*a and
Mingming Yan*ac
a,
Shuai Shao†b,
Rongxin Hana,
Rongrong Zhanga,
Xintong Maa,
Miao Wanga,
Zhiqiang Wana,
Daqing Zhao*a and
Mingming Yan*ac