 Open Access Article
Flower-like hydrogen titanate nanosheets: preparation, characterization and their photocatalytic hydrogen production performance in the presence of Pt cocatalyst†
Feng Donga,
Guoqing Zhanga,
Yuan Guoa,
Baolin Zhu*b,
Weiping Huang a and
Shoumin Zhang
 *a
*a
aCollege of Chemistry, The Key Laboratory of Advanced Energy Materials Chemistry (Ministry of Education), Tianjin Key Lab of Metal and Molecule-based Material Chemistry, Nankai University, Tianjin 300071, China. E-mail: zhangsm@nankai.edu.cn
bCollege of Chemistry, National Demonstration Center for Experimental Chemistry Education (Nankai University), Tianjin 300071, China. E-mail: zhubaolin@nankai.edu.cn
First published on 23rd July 2020
Abstract
Flower-like hydrogen titanate nanosheets were prepared by a hydrothermal method and an assembling process. Then the Pt nanoparticles as cocatalysts were supported on the hydrogen titanate nanosheets through a photoreduction method. The samples were characterized by XRD, TG-DTA, ICP, SEM, TEM, XPS and UV-vis DRS. Their photocatalytic activity for H2 production was also evaluated. The TEM results revealed that the as-prepared H2Ti2O5·H2O was with flower-like structure in which nanosheets were interlaced together. The formation mechanism of flower-like H2Ti2O5·H2O nanosheets was briefly proposed. With Pt cocatalyst, the flower-like H2Ti2O5·H2O had better photocatalytic activity (hydrogen production rate: 9.28 mmol g−1 h−1) and good cycling stability than original H2Ti2O5·H2O and commercial P25 under the same conditions. It was also found that the amount of cocatalyst Pt was positively correlated with photocatalytic performance.
1. Introduction
Semiconductor photocatalysts are promising materials for solar energy conversion into chemical energy due to their potential applications in photocatalytic H2 production, water purification and reduction of CO2.1–6 For many decades, some metal oxides (CuO2, ZnO and α-Fe2O3, and etc.) have been widely applied to the photocatalysis field. Among them, TiO2 acted as the most extensively used catalyst for photocatalysis owing to its good photocatalytic activity, high stability, non-toxicity and low-cost.7–13 However, the photocatalytic activity for H2 production over TiO2 is very low, mainly due to the rapid recombination of photogenerated electrons and holes.14 So there are several ways to overcome these shortcomings and greatly enhance photocatalytic H2 production activity, such as dye sensitization,15 semiconductor composite16 and cocatalyst modification.13 Among above mentioned means, photocatalysts loaded with Pt cocatalyst exhibit most effectively improved photocatalytic H2 production activity.13Protonic titanate (the hydrated TiO2) with controlled morphology possesses excellent photocatalytic properties.17–19 The photocatalytic activity of protonic titanate is strongly affected by the crystalline phase, size, and morphology.20 Especially, protonic titanate nanosheets has superior potential for the photocatalysis owing to their layered nanostructure, high specific surface area and open lattice channels.20,21 Zhao et al. reported that layered hydrogen titanate nanosheets could be synthesized in aqueous ammonia through one-step hydrothermal method.21 However, there are currently few reports on the photocatalytic H2 production over flower-like H2Ti2O5·H2O nanosheets.
Herein, the flower-like H2Ti2O5·H2O nanosheets were obtained by a simple hydrothermal-assembling method, and its possible formation mechanism was proposed. The samples were characterized and their photocatalytic H2 production activity were investigated.
2. Experimental
2.1. Preparation of flower-like H2Ti2O5·H2O nanosheets
All chemicals were of analytic grade and consumed without pretreatment. Commercial P25 TiO2 (polycrystals of anatase and rutile, nanopowder, average size: 21 nm) and H2PtCl6 were purchased from Sigma-Aldrich Chemical Reagent Co., Ltd. Deionized water was used throughout the experiments. The H2Ti2O5·H2O nanosheets were directly prepared by one-step hydrothermal method. Typically, tetrabutyl titanate (TBOT, 7.2 mL) was quickly added into 75 mL aqueous ammonia (25–28 wt%, NH3 H2O) under constant stirring for 15 min at room temperature. Then, the mixture was heated in a 100 mL Teflon-lined stainless-steel autoclave at 140 °C for 24 h. The powders obtained were filtered, centrifuged and washed with deionized water for several times and ethanol for several times, respectively, before drying at 70 °C for 24 h in vacuum. The prepared sample was denoted as HTO*. 0.1 mL ethylamine was added to the 160 mL deionized water during the constant stirring and 2 g HTO* powders was dispersed in the above suspension under ultrasonic treatment for 1.5 h. Then the mixed suspension was then kept aging for 36 h. The produced blue precipitates were filtered, and 75 mL deionized water was added before the 45 min ultrasonic treatment and centrifugation. After washed with deionized water and ethanol for several times to remove the organic residues and further dried at 70 °C overnight, the obtained sample was denoted as HTO.2.2. Characterization
Thermogravimetric and differential thermal analysis (TG-DTA) curves were conducted by increasing temperature (20–900 °C) on a Rigaku TG8121 instrument at a heating up rate of 5 °C min−1 under air using α-Al2O3 as the standard material. The UV-vis spectra of samples was measured on UV3600 UV/vis spectrometer (Shimadzu, Kyoto, Japan) within the range 200–800 nm. The X-ray diffraction (XRD) experiments were carried out at room temperature by using a Rigaku D/Max-2500 X-ray diffractometer (CuKα_λ = 0.154 nm). Transmission electron microscopy (TEM) images of the samples were observed by a JEM-2100 transmission electron microscopy working at 200 kV. The chemical composition and oxidation state of elements on the surface of samples were recorded in X-ray photoelectron spectroscopy (XPS, Ulvac-Phi, Chigasaki, Japan) with an Al X-ray source (Al Kα 150 W, PHI 5000 Versa Probe), and the binding energy was calibrated by taking C 1s peak at 284.6 eV as reference. The morphologies of samples were detected using ZEISS MERLIN compact (field emission) X-650 scanning electron microscope (SEM) (Zeiss, Jena, Germany) operating at 25 kV. The actual Pt loadings in samples were examined by inductively coupled plasma (ICP) on an IRIS Advantage instrument. Elemental analysis was performed by elemental analyzer (Vario MACRO cube, Elementar, Germany) equipped with a METTLER x86 instrument. Brunauer–Emmett–Teller (BET) specific surface area of samples were measured by nitrogen adsorption at liquid N2 temperature on Micromeritics Tristar II 3020 apparatus made in Germany.2.3. Photocatalytic H2 evolution test
Both in situ photodeposition and the photocatalytic H2 production from the reaction solution were carried out by a Labsolar 6A online analysis system (Beijing Perfectlight Inc., China) under the Ar flow. This closed-circulation reaction system was with a Xe lamp as simulated solar light source (300 W, PLS-SXE300, wavelength region: 300–1200 nm, PerfectLight Technology Co, Ltd. Beijing). Typically, the catalyst (50 mg) was dispersed in 100 mL aqueous solution (include the 2 mL methanol as sacrificial agent, 98 mL deionized water and H2PtCl6 as cocatalyst) and kept stirring by magnetic stirrer. The distance between the lamp and reaction vessel was 10 cm. The H2PtCl6 (Pt contents: 0.5 wt%, 1.0 wt%, or 2.0 wt%) was added into the catalytic system. The whole reaction system was rinsed with high-purity Ar for 20 minutes and evacuated by vacuum pump to remove the mixed gas completely. Afterwards, the photocatalytic reactions were maintained at room temperature by flowing cooling water under the irradiation. During the photocatalytic process, the system automatically extracted generated H2 from the reactor every 30 min and compensated the pressure automatically with Ar. The amount of generated H2 were automatically monitored on-line every 30 min by an online gas chromatograph (Techcomp-GC7900(T), TCD detector, 5A molecular sieve column, Ar carrier gas). All experiments were performed under the same conditions. After the photocatalytic experiment, the used HTO catalyst (Pt loading: 0.5 wt%) was recovered by centrifugation, washed with deionized water and dried at 60 °C in vacuum for TEM test.In order to determine the relationship between the H2 peak area and the injected H2 volume (a certain amount of H2 was injected into the reaction system every 30 min under the same conditions, and then the H2 peak area was automatically displayed by GC7900 data workstation), the generated H2 standard curve could be obtained through taking the H2 peak area as ordinate (X) and the injected H2 volume as abscissa (Y), as shown in Fig. S1.† The generated H2 volume of photocatalytic reaction could be calculated by the linear regression equation (y = 2.49 × 10⁻⁴x + 0.0684; R2 = 0.99996) and then be converted to the H2 yield. Control experiments showed that no H2 production was detected in the absence of either irradiation or photocatalyst (Fig. S2†), meaning that H2 was generated by the photocatalytic reaction of photocatalyst.
3. Results and discussion
3.1. XRD
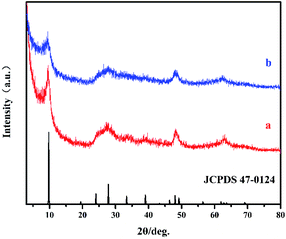
Fig. 1 shows the XRD patterns of HTO* (a) and HTO (b), in which the principal diffraction peaks at 2θ = 27.86°, 48.04 ° and 62.88° correspond well with the (301), (020) and (002) crystal planes of H2Ti2O5·H2O (JCPDS 47-0124), respectively.22 Additionally, the observed diffraction peak at around 10° of samples corresponds to the (200) crystal plane of H2Ti2O5·H2O, indicating their formation of layered structure. The (200) peak of HTO is wider and weaker compared to that of HTO*, which might be caused by the lamellar assembling of hydrogen titanate.233.2. TG-DTA
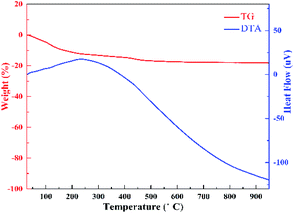
TG-DTA analysis was performed to investigate the composition of HTO. It is generally known that the sample's thermal behavior depends upon the preparation condition, chemical composition and crystalline phase.24 Fig. 2 presents the TG-DTA profiles of HTO. The total weight loss of 18.23% below 500 °C is corresponding to the loss of two water molecules in H2Ti2O5·H2O, further implying that H2Ti2O5·H2O was completely dehydrated into TiO2 beyond 500° (formula (1) and (2)). The big exothermic peak at 250 °C represents the transition of crystal form of HTO induced by the dehydration of one interlayered H2O (8.67%) during the 165–500 °C (formula (2)).18 Hence, the weight loss of 9.56% during the 25–165 °C should belong to the removal of one interlayered water (formula (1)). Thus, the dehydration process of HTO can be formulated as follows:| H2Ti2O5·H2O → H2O + H2Ti2O5 | (1) |
| H2Ti2O5 → H2O + 2TiO2 | (2) |
3.3. TEM and SEM
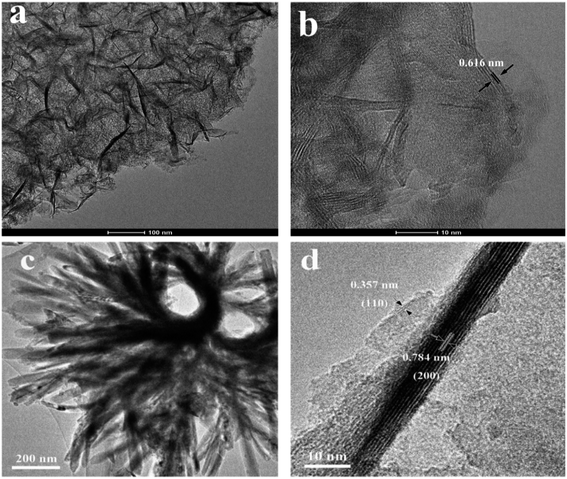
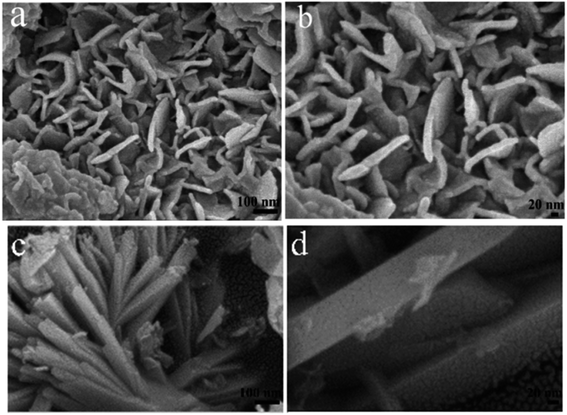
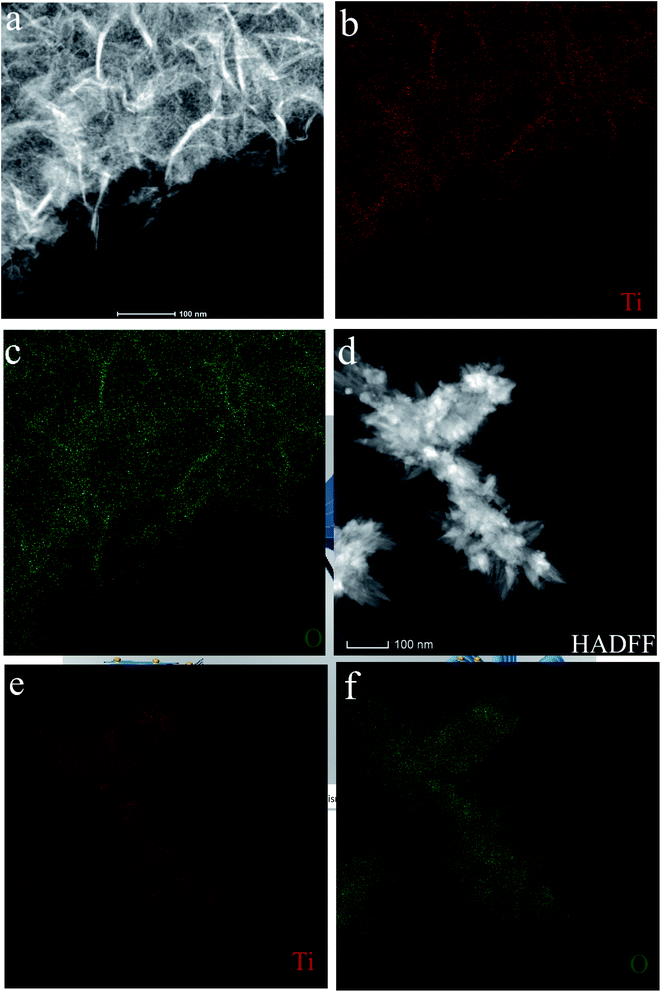
The morphology and microstructure of the as-prepared HTO* and HTO were characterized by SEM and TEM. Fig. 3a, b and 4a, b show that the morphology of HTO* is a disordered aggregation, consisted of many overlapped and edge-curled nanosheets with both width and length of more than 50 nm. From Fig. 3b, it can be seen that the interlayer spacing of HTO* is 0.616 nm. The thickness of HTO* nanosheet edge is less than 3.5 nm, which consists of more than four layers. From Fig. 3c, d and 4c, d, the morphology of HTO is flower-like cluster (average diameter: 900 nm), assembled by compact, curly and tangled nanosheets. Its measured interplanar distance is 0.357 nm, corresponded to the (110) plane of H2Ti2O5·H2O. The branch of nanosheets is more than 50 nm in width and 500 nm in length. The HTO nanosheet (edge thickness: no more than 10 nm) also consists of more than ten layers and its interlayer spacing (0.784 nm) is slightly larger than that of HTO*. Additionally, the HAADF-STEM and element mapping images of HTO* and HTO both confirm the homogenous distribution of Ti and O throughout corresponding nanosheets (Fig. 5a–f).The possible formation mechanism of flower-like nanosheets structure of HTO is schematically illustrated in Scheme 1. During the ultrasonic process, the HTO* nanosheets were exfoliated into the monolayers with the assistance of ethylamine and then assembled into the smooth nanosheets. Ethylamine could interact with the edge of HTO* nanosheets through the electrostatic force. In order to reduce the surface free energy and electrostatic repulsion during the aging process, the nanosheets were curled into the three dimensional flower-like structure.25,26 After the washing treatment, the edge of nanosheets curled and formed thicker edge of nanosheets. Its flower-like structure could effectively reduce the aggregation of HTO nanosheets. When the cocatalyst, such as H2PtCl6, were loaded on the HTO nanosheets, highly dispersed Pt nanoparticles can be obtained on HTO.27 However, the nanosheets in HTO* uncontrollably aggregated into disordered clusters due to the van der Waals force and driving force of hydrogen bond. As a result, the less active sites were exposed in HTO* compared to HTO.
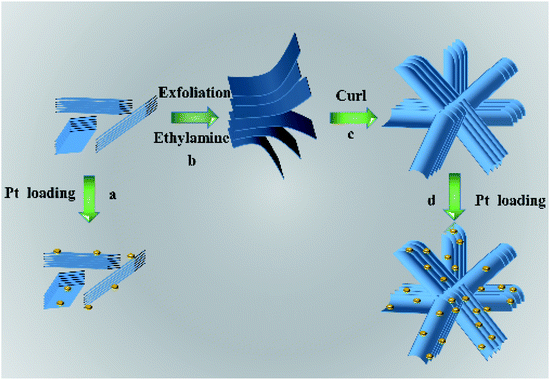 | ||
| Scheme 1 Schematic illustration of the possible formation mechanism for the flower-like H2Ti2O5·H2O nanosheets. | ||
3.4. UV-vis
Fig. 6 shows the UV-vis spectra of HTO. The UV-vis curve of HTO shows strong adsorption between 200–400 nm and absorption edge at 392 nm, which is slightly larger than the absorption edge of anatase TiO2 at 385 nm.28,29 The bandgap (Eg) of HTO can be obtained by the Tauc equation ((αhν)1/n = B(hν − Eg)),30 in which α, ν, A, and Eg represent the absorption coefficient, light frequency, the constant, and bandgap, respectively. The n factor depends on the nature of the electron transition and is equal to 1/2 or 2 for the direct and indirect transition band gaps, respectively. Because the band gap of HTO is indirect, its n is 2.30 According to Fig. 6b, the band gap of HTO (2.34 eV) is lower than that of anatase TiO2 (3.2 eV), owing to the influence of layer-structure of HTO.31 This result might be the specific basis for the enhanced visible absorption of HTO. Besides, the UV-vis curve of HTO shows an obviously decreased absorption above 400 nm, indicating its high crystallinity.32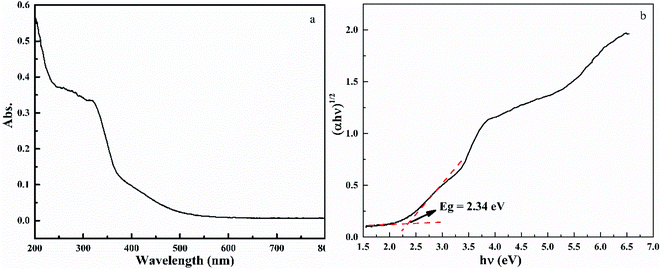 | ||
| Fig. 6 UV-vis spectra of HTO (a) and the Tauc plots (b) based on the equation (αhν)1/2 = B(hν − Eg), from which the band gap Eg of HTO is determined. | ||
3.5. XPS
XPS could detect the elemental composition and electronic state of sample. Fig. 7a shows the elements (Ti and O) in the HTO. The carbon signal of sample might due to the XPS measurement itself. Fig. 7b exhibits two peaks at the binding energy of 458.0 eV and 464.0 eV, corresponds to the Ti 2p3/2 and Ti 2p1/2 peaks, respectively, indicating the presence of Ti4+ valance state in the HTO.8,9 Fig. 7c displays the characteristic peaks of O 1s at 529.1 eV and 531.4 eV, which could be ascribed to the lattice oxygen and adsorbed oxygen or hydroxyl, respectively.18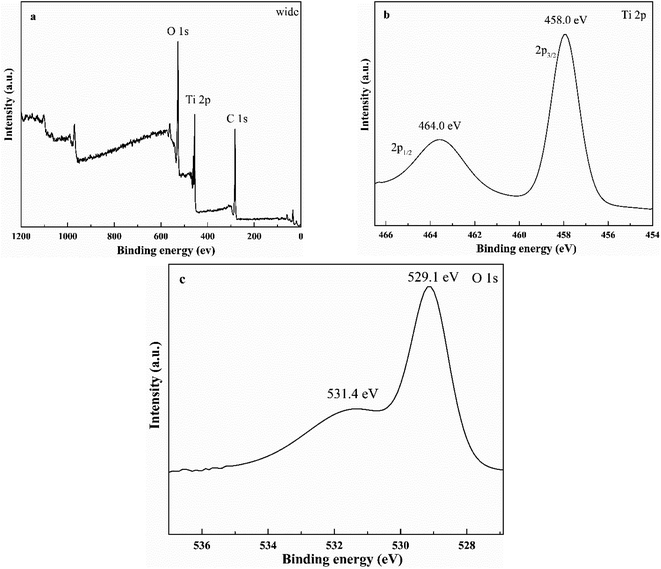 | ||
| Fig. 7 The wide XPS spectra of HTO (a) and high-resolution XPS spectra of HTO: Ti 2p peaks (b), and O 1s peaks (c). | ||
3.6. BET
Fig. S4† displays the N2 adsorption–desorption isotherms of HTO* and HTO. The BET surface area of HTO* and HTO is 41.72 and 125.18 m2 g−1, respectively. When HTO* transforms into HTO, there is a significant increase for the BET surface area, ascribing to the formation of flower-like structure of HTO. So HTO could supply more active sites for photocatalysis.3.7. Catalytic activity
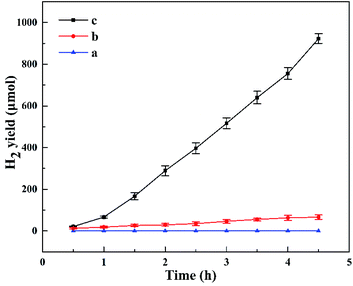
Fig. 8 shows the photocatalytic H2 evolution for HTO, HTO* and commercial P25. The H2 evolution rates of HTO, HTO* and commercial P25 are 4.10, 0.30, and 0 mmol g−1 h−1, respectively. So the HTO had the highest photocatalytic activity. Fig. 9 shows the activity curves of photocatalytic H2 evolution over HTO, HTO* and commercial P25. 0.5 wt% Pt as cocatalyst was added in the three systems. Under irradiation, the Pt4+ was first reduced to metallic Pt, where photo-electrons were eliminated by the reduction reaction. Thus the hydrogen evolution reaction (2H+ + 2e− → H2) was suppressed in the induction period, consistent with the delayed hydrogen evolution in this figure. It can be seen that the samples' hydrogen output displays the same increasing trend during the 4.5 h reaction. The H2 evolution rates of HTO, HTO* and commercial P25 are 9.28, 7.52, and 5.51 mmol g−1 h−1, respectively, and HTO exhibits the highest photocatalytic activity. According to the ICP results of used catalysts, the actual Pt contents of HTO, HTO*, and commercial P25 were 0.43, 0.39, and 0.40 wt%, respectively. According to the elemental analysis results, the actual C contents of HTO, HTO*, and commercial P25 were 0.01, 0.02, and 0.04 wt%, respectively.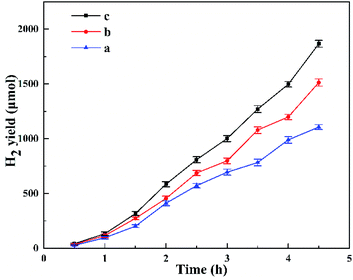 | ||
| Fig. 9 Photocatalytic H2 production patterns for P25 (a), HTO* (b) and HTO (c) in the presence of 0.5 wt% Pt cocatalyst. | ||
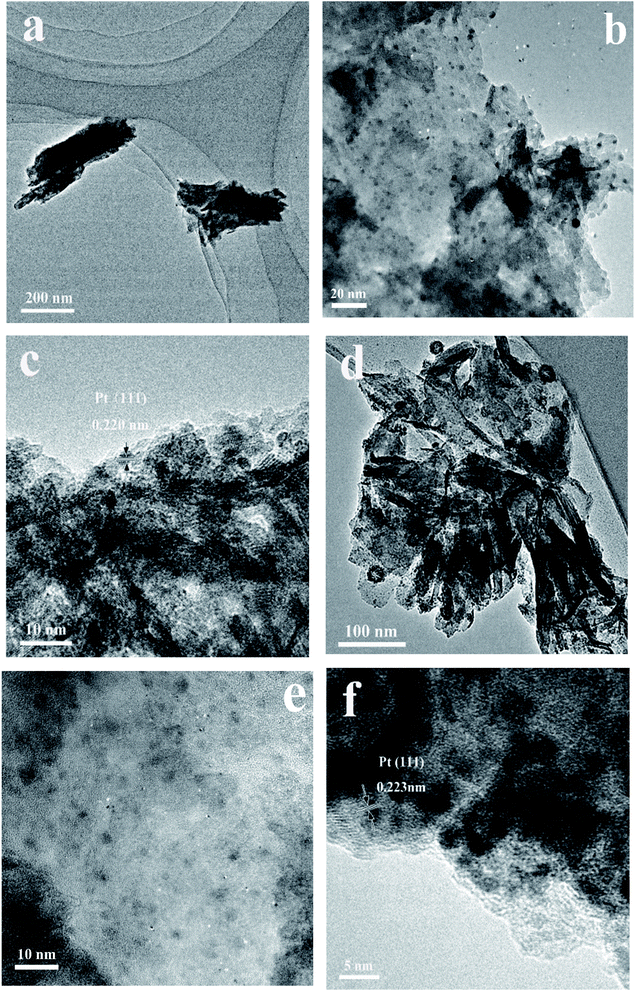
In order to investigate the structure–activity relationship of the catalysts, the microstructure of P25, HTO and HTO* after the photocatalytic reaction, which were loaded with 0.5 wt% Pt cocatalyst, are observed by TEM (Fig. 10 and S5†). The Pt nanoparticles were highly deposited both on the surface of HTO* and HTO, and the measured interplanar distance of 0.223 (HTO) and 0.220 nm (HTO*) both corresponded to the (111) plane of Pt (Scheme 1 and Fig. 10). From the TEM images, the Pt nanoparticles were more homogeneously dispersed on the HTO surface than on the HTO* surface. That should be attributed to the larger BET surface area and 3D flower-like nanosheets structure of HTO,31 as shown in Scheme 1. Compared with the HTO with Pt cocatalyst, the Pt nanoparticles were not homogeneously distributed on the P25 surface, possibly leading to its low catalytic activity (Fig. S5†). Moreover, the Pt particle size distribution on samples (P25, HTO* and HTO) were shown as Fig. S6† by TEM analysis. The average Pt nanoparticle size on P25, HTO* and HTO was 3.09, 2.77, and 2.12 nm, respectively. So the average Pt nanoparticle size of HTO was the smallest among all the samples. Overally, among these catalysts, the best activity of HTO might be attributed to two factors: (a) during the photocatalytic reaction, the more small Pt nanoparticles for H2 production presented in the HTO, which was also in good accordance with the TEM results; (b) the effective conduction of charge on the flower-like nanosheets structure facilitates the separation of photogenerated electrons and holes.33,34
Fig. 11 shows the effect of Pt content on the photocatalytic activity of catalysts. Similar with Fig. 8, the delayed hydrogen evolution also could be observed in this figure. With the increase of Pt contents (0.5 wt%, 1.0 wt% and 2.0 wt%), the hydrogen production rate of HTO increased, from 9.28 mmol g−1 h−1 to 11.51 mmol g−1 h−1 and finally to 17.98 mmol g−1 h−1. From the ICP results, the actual Pt contents of HTO (1.0 wt% Pt) and HTO (2.0 wt% Pt) were 0.83 and 1.71 wt%, respectively. Overally, the higher Pt content implies the more active sites of H2 production in the HTO. But 0.5 wt% Pt content was selected for the whole photocatalytic experiments owing to its high cost.
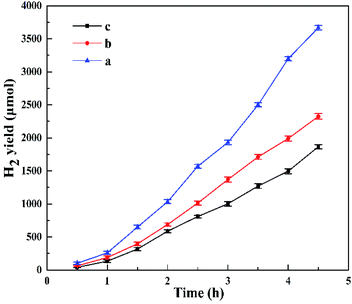 | ||
| Fig. 11 Photocatalytic activity of HTO with various Pt contents: 2.0 wt% (a), 1.0 wt% (b), 0.5 wt% (c). | ||
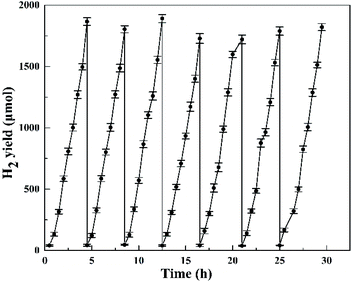
The cycling photocatalytic test was performed for seven cycles in the presence of 0.5 wt% Pt cocatalyst (the reaction system was re-evacuated by vacuum pump after every 4.5 h reaction as a cycle), as shown in Fig. 12. For every run, a total amount of around 1.8 mmol H2 was produced without apparent decrease of the activity in the closed system and the H2 evolution rate remained at around 8 mmol g−1 h−1, suggesting the HTO catalyst's high stability in the presence of 0.5 wt% Pt cocatalyst and its potential for long-term photocatalytic applications.
Comparison with other reported TiO2 catalysts is shown in Table S1,† and the HTO catalyst exhibits prominent activity for photocatalytic hydrogen evolution. Thus, this catalyst is worth of further investigation, and other photocatalytic performance of HTO, such as photodegradation of wastewater, is under research.
4. Conclusions
In summary, the HTO flower-like nanosheets structure was prepared by hydrothermal-assembling method. Through the further investigation of photocatalytic H2 production activity, the HTO with 0.5 wt% Pt cocatalyst had good catalytic performance and strong reusability under the simulated sunlight irradiation. With Pt cocatalyst, the HTO has obvious advantages than commercial P25 in photocatalytic H2 production. Moreover, Pt acts as effective cocatalyst to enhance the photocatalytic activity of HTO, and its content is positively relate with the activity of HTO. The formation mechanism of HTO indicates that 3D flower-like nanosheets morphology could provide more active Pt sites and better photocatalytic activity for H2 production. Thus, HTO-based catalysts for other catalytic reactions, chemical battery and solar cells are anticipated.Conflicts of interest
The authors declare no conflict of interest.Acknowledgements
This research was funded by the National Natural Science Foundation of China (no. 21271110, 21373120 and 21271107) and MOE Innovation Team of China (IRT13022).Notes and references
- M. R. Hoffmann, S. T. Martin, W. Y. Choi and D. W. Bahnemann, Chem. Rev., 1995, 95, 69–96 CrossRef CAS.
- X. B. Chen, S. H. Shen, L. J. Guo and S. S. Mao, Chem. Rev., 2010, 110, 6503–6570 CrossRef CAS PubMed.
- A. Kudo and Y. Miseki, Chem. Soc. Rev., 2009, 38, 253–278 RSC.
- A. V. Puga, Coord. Chem. Rev., 2016, 315, 1–66 CrossRef CAS.
- J. Schneider, M. Matsuoka, M. Takeuchi, J. L. Zhang, Y. Horiuchi, M. Anpo and D. W. Bahnemann, Chem. Rev., 2014, 114, 9919–9986 CrossRef CAS PubMed.
- D. Voiry, H. S. Shin, K. P. Loh and M. Chhowalla, Nat. Rev. Chem., 2018, 2, 105 CrossRef CAS.
- A. Fujishima and K. Honda, Nature, 1972, 238, 37–38 CrossRef CAS PubMed.
- J. G. Yu, L. F. Qi and M. Jaroniec, J. Phys. Chem. C, 2010, 14, 13118–13125 CrossRef.
- T. M. David, P. Wilson and R. Mahesh, Mater. Technol., 2018, 33, 288–300 CrossRef CAS.
- W. Zhang, H. He and Y. Tian, Chem. Sci., 2019, 10, 1664–1670 RSC.
- K. J. Chao, W. Y. Cheng and T. H. Yu, Carbon, 2013, 62, 69–75 CrossRef CAS.
- P. Wang, Z. X. Yi, J. J. Zhang, Z. Y. Cai, B. Lyu, J. H. Yang and X. Y. Wang, ChemCatChem, 2019, 11, 4252–4255 CrossRef CAS.
- Y. J. Zhang, Z. F. Xu, G. Y. Li, X. J. Huang, W. C. Hao and Y. P. Bi, Angew. Chem., Int. Ed., 2019, 58, 14229–14233 CrossRef CAS PubMed.
- M. Ni, M. K. H. Leung and D. Y. C. Leung, Renewable Sustainable Energy Rev., 2007, 11, 401 CrossRef CAS.
- S. Q. Peng, Y. Cao, F. X. Zhou, Z. D. Xu and Y. X. Li, Appl. Surf. Sci., 2019, 487, 315–321 CrossRef CAS.
- B. J. Sun, W. Zhou, H. Z. Li, L. P. Ren, P. Z. Qiao, W. Li and H. G. Fu, Adv. Mater., 2018, 30, 1804282 CrossRef PubMed.
- J. Yang, Z. Jin and X. Wang, Dalton Trans., 2003, 20, 3898–3901 RSC.
- M. Zhang, Z. Jin and J. Zhang, J. Mol. Catal. A: Chem., 2004, 217, 203–210 CrossRef CAS.
- S. Uchida, Y. Yamamoto, Y. Fujishiro, A. Watanabe, O. Itoa and T. Satoa, J. Chem. Soc., Faraday Trans., 1997, 93, 3229–3234 RSC.
- B. Zhao, F. Chen, Y. C. Jiao and J. L. Zhang, J. Mater. Chem., 2010, 20, 7990–7997 RSC.
- B. Zhao, F. Chen, Y. C. Jiao, X. N. Gu and J. L. Zhang, Chem.–Asian J., 2010, 5, 1546–1549 CrossRef CAS PubMed.
- B. Abida, L. Chirchi and S. Baranton, J. Power Sources, 2013, 241, 429–439 CrossRef CAS.
- Q. Deng, C. Huang and W. Xie, Chem. Commun., 2011, 47, 6153–6155 RSC.
- J. Xu, Y. Ao, D. Fu and C. Yuan, J. Cryst. Growth, 2008, 310, 4319–4324 CrossRef CAS.
- Z. V. Saponjic, N. M. Dimitrijevic and D. M. Tiede, Adv. Mater., 2005, 17, 965–971 CrossRef CAS.
- W. D. Yang and K. M. Hung, J. Mater. Sci., 2002, 37, 1337–1342 CrossRef CAS.
- G. R. Ma, M. Yang, F. G. Xu and L. Wang, Anal. Methods, 2017, 9, 5140–5148 RSC.
- R. Asahi, Y. Tag and W. Mannstadt, Phys. Rev. B: Condens. Matter Mater. Phys., 2000, 61, 7459–7468 CrossRef CAS.
- A. Amtout and R. Leonelli, Phys. Rev. B: Condens. Matter Mater. Phys., 1995, 51, 6842–6847 CrossRef CAS PubMed.
- P. Makuła, M. Pacia and W. Macyk, J. Phys. Chem. Lett., 2018, 9, 6814–6817 CrossRef PubMed.
- M. Machida, X. W. Ma, H. Taniguchi, J. Yabunaka and T. Kijima, J. Mol. Catal. A: Chem., 2000, 155, 131–142 CrossRef CAS.
- X. T. Wang, W. X. Shi, S. X. Wang, H. W. Zhao, J. Lin, Z. Yang, M. Chen and L. Guo, J. Am. Chem. Soc., 2019, 141, 5856–5862 CrossRef CAS PubMed.
- C. T. Kresge, M. E. Leonowicz and W. J. Roth, Nature, 1992, 359, 710–718 CrossRef CAS.
- W. Zhou, W. Li and J. Q. Wang, J. Am. Chem. Soc., 2014, 136, 9280–9283 CrossRef CAS PubMed.
Footnote |
| † Electronic supplementary information (ESI) available. See DOI: 10.1039/d0ra03698f |
| This journal is © The Royal Society of Chemistry 2020 |

