 Open Access Article
Insights on the structure-performance relationship of polyphthalamide (PPA) composites reinforced with high-temperature produced biocarbon
Mateo Gonzalez de Gortari ab,
Arturo Rodriguez-Uribe
 b,
Manjusri Misra
 *ab and
Amar K. Mohanty
 ab
ab
aSchool of Engineering, University of Guelph, Thornbrough Building, Guelph, N1G 2W1, Ontario, Canada. E-mail: mmisra@uoguelph.ca
bBioproducts Discovery and Development Centre, Department of Plant Agriculture, University of Guelph, Crop Science Building, Guelph, N1G 2W1, Ontario, Canada
First published on 21st July 2020
Abstract
Reducing greenhouse gas emissions (GHG) in vehicles requires the use of lighter-weight materials. One possible strategy is using biomass-derived carbons (biocarbon), which have a lower density compared to traditional mineral based fillers. In this study, novel composites reinforced with 20 and 30 wt% of a biocarbon produced at high temperature (950 °C) were melt compounded with polyphthalamide (PPA), followed by injection molding, and compared to talc-filled composites. Mechanical tests were performed with ASTM standard samples for tensile, flexural and impact properties, alongside thermal, spectroscopic and morphological characterizations. Surface area and elemental composition of the biocarbon and talc particles were also determined. The biocarbon and talc composites had matching mechanical properties in most of the tests (3.7 GPa for the Young's modulus of the 20 wt% talc-filled composite versus 3.7 GPa for both 20 wt% biocarbon-filled composites), with all the properties surpassing those of the unfilled, neat PPA (Young's modulus of 2.4 GPa), and the biocarbon-filled composites have a lower density than the talc-filled ones (1.277 g cm−3 for the 20 wt% talc-filled composite versus 1.176 g cm−3 for both 20 wt% biocarbon-filled composites). The main influencing factors for the better performance of the biocarbon-PPA composites were found to be the similarity of particle size between the talc and the biocarbon.
1 Introduction
Current scientific consensus is that anthropogenic greenhouse gas emissions are responsible for an increase of 1.0 °C in the global temperatures as compared to the 1880s.1 A further increase of 1.5 °C is predicted by the middle of the twenty first century if the current levels of emissions remain the same.1 Transport vehicles for both freight and passengers are among the major sources of these emissions. According to the European Union Joint Research Centre, the amount of CO2 emitted in 2018 due to the transport sector was around 7.5 gigatons.2 One of the many actions that are recommended to tackle this global issue is weight reduction in the manufacture of vehicles,3 as it has been calculated that a 10% weight reduction in vehicles can yield up to a 7% increase in fuel efficiency.4A widely used strategy to reduce weight is to replace metallic components in the interior and under the hood of cars with plastics and polymer composites. Nowadays, these materials are some of the most studied and employed alternatives for transport applications and weight reduction initiatives. Most composites are compounded with heavy fillers and, in this respect, bio-fillers can be successfully used to reduce the overall weight of these materials. Use of plastics parts in vehicles has increased significantly since the 1960s. Currently, the average plastic weight in a conventional vehicle is 351 pounds, a significant increment compared to 20 pounds or less of plastic material.5 Due to the replacement of metallic parts by plastic parts, the average fuel economy in North America of a light-duty vehicle has increased from 14.3 miles per gallon in the 1960s to 23.5 miles per gallon in 2010 [Original Equipment Manufacturer (OEM)].6,7
Replacing more specialized metallic parts by using plastics is a challenging task. The challenges arise from the thermal and mechanical conditions in which the plastics must be used. In this scenario, so-called high-performance engineering plastics can take the lead. These polymers are capable of retaining exceptional mechanical and performance characteristics above 150 °C,8 and some of these polymers do not start decomposing until a temperature range of 480 to 500 °C is reached.9 The current size of the market for these polymers is a small fraction of the global plastics market. The market of high performance polyamides was valued at USD $2642.1 million in 2018,10 whereas the market for commodity plastics (the most commonly used polymers in industry for general applications) is expected to reach USD $493 billion by 2022.11 Using Nylon price as a reference point, the price of these polymers can be 3 to 20 times higher, although the use of inexpensive and bio-based fillers can overcome the economic hurdle by reducing the cost of the composites produced.
Polyphthalamide (PPA), is found among these high-performance engineering plastics. The ASTM standard D5336-15a specifies that, for a polymer to be called PPA, there must be a minimum of 55 molar% content of isophthalic or terephthalic acid in the dicarboxylic portion of the polymer chain,12 with the rest of the molar weight being composed by a diamine co-monomer such as decamethylene diamine or hexamethylene diamine.13 This means that PPA is not a term for one specific polymer, rather PPA can be considered an umbrella term for a family of polymers. Commercial samples that only include terephthalic acid and hexamethylene cannot be used in injection molding applications, as such a polymer has a degradation temperature below its melting temperature, that is, it cannot be processed by melt compounding techniques.13 Instead, in order to produce a PPA that can be processed through standard plastic processing techniques, manufacturers use a mix of comonomers, using different ratios of diamines and isophthalic and terephthalic acid (and some other acids such as adipic acid) to create commercial products.13 Thus, PPAs' high mechanical performance has a range of values, depending on the specific comonomers used to produce the polymer: the tensile strength at break can be between 70 to 90 MPa,13 the heat deflection temperature (HDT) is around 120 °C (measured with a force of 1.8 MPa),13 and the melting point is approximately 300 °C.13
PPA has been traditionally used and studied with mineral fillers such as talc,13 as well as short and long glass fiber.14–16 Studies exist in which other materials are used, such as mesoporous silica,17 boehmite and phenylphosphinic acid,18 graphene oxide,19 boron nitride nanosheets,20 fullerenes21 and nano carbon tubes,22 among others.
Talc in particular, has been used to boost the mechanical, thermal and impact properties, such as having a higher HDT, increasing the stiffness or improving the impact resistance, among other improvements, such as surface scratching resistance and appearance.23 However, the use of talc can increase CO2 emissions when a composite is manufactured, especially compared to natural fibers and fillers.24,25
As previously mentioned, the melting and processing temperature of PPA starts at 300 °C.13 Obvious alternatives to talc, like natural fibers or biofillers (such as sawdust, etc.) cannot withstand such high temperatures. One viable alternative to bio-fillers is biocarbon. Made from almost unlimited sources of biomass, biocarbon is the solid residue left after pyrolysis. Its production costs and characteristics change depending on the temperature at which it is produced. Temperatures of pyrolysis can reach as a high as 1200 °C.26 The decomposition behavior in a thermal ramp of a biocarbon depends, mainly, on the temperature at which the pyrolysis was carried out. The thermal stability of a biocarbon produced at 500 °C can reach up to 600 °C,27 a bio-oil pyrolyzed at 900 °C remains thermally stable up to 900 °C.28 Due to these properties, biocarbon has attracted a lot of research and commercial interest in the past decade, and many biocarbon-filled composites have been developed, optimized and are currently used in commercial products.29–32 The price of biocarbon depends on the temperature at which it was produced (USD $0.0748–$0.109 per kg, for a range of 500 °C to 1000 °C).33 Even with these prices, biocarbon is still cheaper to produce than talc (USD $0.15 per kg to US$ 0.66 per kg).23 Particularly in automotive applications, biochar can play a role in reducing environmental impact of composites, as a Life Cycle Analysis (LCA) study performed by Tadele et al., showed that in the case of polypropylene (PP) composites, substituting talc with Miscanthus biochar results in reduced environmental impacts, mainly through the weight reduction achieved by the lower-weight density of the PP composites.34
This study posits that biocarbon/PPA composites could produce materials that are a viable alternative to talc-filled ones. One of the main research objectives is to investigate if this new composite can match the overall performance of a talc-filled PPA composite. As a result of the reduction in weight of the composites, this would also have a direct impact in the overall transportation costs, fuel efficiency and reduction in the emissions of GHG. Within this framework, a discussion of the advantages of biocarbon over the mineral filler is presented. To the best of the knowledge of the authors, no work using biocarbon in high performance composites with any type of PPA has been previously studied or published, adding to the significance of this research.
2 Materials and methods
2.1 Materials
PPA (Zytel HTFNFE8200 NC010) was purchased from Dupont, (Wilmington, DE, USA). According to Kemmish,13 its composition is 100 mol% terephthalic acid, for the acid fraction of the polymer, with 50 mol% of hexamethylenediamine and 50 mol% of 2-methylpentamethylene diamine for the amine fraction of the polymer, although this information is not commercially disclosed. Biocarbon (BioCM) was produced from Miscanthus grass, with an average length of 4 mm, provided by Prism Farms Limited (Leamington ON, Canada). Talc (Mistron CB) was provided by IMERYS Performance Additives (Paris, France).2.2 Production of biocarbon
In order to produce BioCM from the Miscanthus fiber, a Carbolite GLO batch type Retort Furnace (Carbolite Gero Limited, Hope Valley, United Kingdom) was employed. A rate of heating of 7.5 °C min−1 was used, reaching and maintaining a pyrolysis temperature of 950 °C for 30 minutes. To provide an inert atmosphere, a constant flow of 50 liters per hour of nitrogen was kept during the pyrolysis and cooling period of the material, until the furnace reached room temperature. The biocarbon was then removed. Due to the fact that biocarbon has a tendency to keep the shape of the original material that was pyrolyzed, a conventional blender provided with rotatory knife type blades was used to make a first reduction in size of the biocarbon particles obtained. The material was then sieved through a 425 μm mesh and, finally, ball-milled using a Pulverisette machine (FRITSCH Milling and Sizing, Inc., Pittsboro, NC, United States). The milling media consisted of 100 zirconium dioxide balls per 50 grams of biocarbon, milled in zirconium dioxide containers. Ball-milling was performed for one hour for the sample denominated BioCM/1HR, and four hours for the sample denominated BioCM/4HR, in order to obtain two different particle sizes.2.3 Production of composites
Before manufacture of the composites, the biocarbon was dried for at least 24 hours at 85 °C, while the PPA was dried for 4 hours at 120 °C. A twin-screw DSM micro-compounder (Xplore Instruments, Sittard, The Netherlands), with a 15-cc capacity, was used for the melt compounding process. The appropriate amounts of filler and polymer matrix were measured to produce the formulations given in Table 1.| Coding | Wt% of PPA | Wt% of talc | Wt% of BioCM/1Hr | Wt% of BioCM/4Hr |
|---|---|---|---|---|
| PPA | 100 | 0 | 0 | 0 |
| 80PPA/20Talc | 80 | 20 | 0 | 0 |
| 70PPA/30Talc | 70 | 30 | 0 | 0 |
| 80PPA/20BioCM/1HR | 80 | 0 | 20 | 0 |
| 70PPA/30BioCM/1HR | 70 | 0 | 30 | 0 |
| 80PPA/20BioCM/4HR | 80 | 0 | 0 | 20 |
| 70PPA/30BioCM/4HR | 70 | 0 | 0 | 30 |
The composites were melt compounded at 325 °C (the micro-extruder has three heating zones, the temperature was set to be the same in all of them), with a 100 rpm for a total time of 2 min. The resulting melts were then collected and transported via a cylindrical injector (Xplore Instruments) and injected to molds heated to 100 °C (the manufacturer recommends these conditions in order to produce the best quality PPA parts). According to the instructions provided, this ensures the maximum crystallinity of the injected samples and produces the best mechanical properties. The injection process was carried out with 16 bar pressure for 10 seconds of holding time, with an additional 12 seconds at 10 bar pressure. Tensile, flexural, and impact specimens were produced following the dimensions specified by the ASTM International standards.
2.4 Mechanical testing
In order to measure the tensile and flexural properties of the composites, an Instron Universal Testing Machine 3382 (Instron, Norwood, MA, United States) was used. In the tensile experiments, the standard ASTM D638-14 type IV specimens were employed. Following the standard, the testing speeds were 45 mm min−1 for the PPA, while the composites were tested at 5 mm min−1, in order to ensure a breaking time between 30 s and 5 min, as the standard requires. For the flexural properties, procedure B contained within ASTM D790-15 was followed, with a span of 52 mm between the supports, at a testing speed of 14 mm min−1, obtained using the calculation contained in the standard, taking into account the average dimensions of a standard flexural bar. A Zwick/Roell Impact tester (Ulm, Germany) was used to measure the impact energy of the composites, employing a 2.16 J hammer. The ASTM D256 standard was followed for impact energy analysis, in notched samples.Density was measured using an electronic Densimeter MDS-3000 (AlfaMirage, Osaka Japan), which has a resolution of 0.01 g cm−3. Two replicate samples were employed.
2.5 Analysis of fillers
A Phenom ProX microscope (Phenom-World BV, Eindhoven, Netherlands) was used in order to conduct Scanning Electron Microscopy (SEM), so that the morphology of the composites could be analyzed. The attached Energy Dispersive X-ray Spectroscopy (EDS) module, as well as included particle size analyzer software (ParticleMetric) was used to characterize the biocarbon. The voltage of the microscope was 15 kV for EDS and 10 kV for morphological analyses. Elemental analysis was taken from five images, while particle analysis used the average of five different regions of the sample. The exact methodology followed has been previously published and can be consulted for further details.35Pore volume and surface area of the biocarbon and talc were characterized using an Autosorb-iQ (Quantachrome Instruments, Boynton Beach, Florida United States). Samples between 200 to 250 mg were degassed for 3 hours at 150 °C. Nitrogen gas was employed as the adsorbent, and the temperature was kept constant by using a liquid nitrogen bath at its boiling temperature at room standard pressure conditions (−196.15 °C). The linear region of the sorption part of the curve, along with the last sorption point, were used with the Brunauer–Emmett–Teller (BET) model to calculate the dimensions of the average pore and the total volume of pores, as well as the surface area.
2.6 Infrared analysis
The attenuated total reflection infrared spectra (FTIR) of the biocarbon, raw Miscanthus fiber, talc and the composites, were measured using a Fourier-transform infrared spectroscope, Nicolet iS20 (Thermo Scientific, Waltham, MA United States). The spectrum for each sample was captured using 256 scans from 4000 cm−1 to 525 cm−1 with 0.5 cm−1 resolution.The degradation, as well as the thermal stability of the composites was measured in a thermogravimetric analysis unit, TGA Q500 (TA Instruments, New Castle, DE, United States). For each material tested, samples were cut from an injection molded sample. A 50 mL min−1 flow of nitrogen was used, heating all samples at a constant rate of 10 °C min−1 from near room temperature to reach a final temperature of 700 °C.
2.7 Thermal analysis
The differential scanning calorimetry (DSC) of the materials was performed in a DSC Q200 (TA Instruments, New Castle, DE, US). A sample from each of the composites, weighing between 5–10 mg, was encapsulated in aluminum pans, and a thermal cycle of heating, cooling, and heating was employed. The initial temperature was 0 °C, with the final temperature being 350 °C. Heating and cooling rates were both 10 °C min−1.The heat deflection temperature (HDT) of each composite produced was tested in a DMA Q500 unit (TA Instruments, New Castle, DE, United States). A bar of the size, shape and dimensions as specified in ASTM D256 was used. A force calculated to exert 0.455 MPa of stress on the bar was applied. Samples were heated from an initial temperature of 0 °C to a final temperature of 270 °C, at a heating rate of 2 °C min−1.
2.8 Thermomechanical analysis
The glass transition temperature (Tg) of the composites was investigated using a Dynamic Mechanical Thermal Analysis (DMTA) unit, model DMA Q500 (TA Instruments, New Castle, DE, United States). A specimen of the dimensions specified in ASTM D256 was used. The Tg of the sample was calculated from the graph of tan delta against temperature. A dual cantilever clamp was used, employing a frequency of 1 Hz. An initial temperature of 0 °C was established, and the sample was heated at 3 °C min−1 to reach a final temperature of 270 °C. The amplitude of the vibration was 15 μm.3 Results and discussion
3.1 Analysis of the fillers
The oxygen and carbon contents of the biocarbon samples were 81.5 ± 0.9 wt% C and 15.0 ± 1.2 wt% O for BioCM/1HR, and 80.4 ± 1.1 wt% C and 15.5 ± 0.7% O for BioCM/4HR. These contents were similar to previously published reports concerning pyrolyzed Miscanthus fiber at similar temperatures.36 These results show that the ball-milling did not significantly change or affect the elemental composition of BioCM.Table 2 shows the results of the surface area analysis of the two biocarbons and talc, while Table 3 shows their particle size analysis. The results in both tables (Tables 2 and 3) show that using the ball-milling to reduce the size of the biocarbon particles was successful, the reduction depending on the time the particles spent in the ball-mill. As the surface area of BioCM/4HR increased, its average pore volume and the average particle size decreased. The results for talc of surface area properties and particle size distribution are consistent with the material data sheet provided by the manufacturer. The talc particles, as expected for a manufactured product, have a narrow size range, with 90% of the particles found within 3 to 10 μm, while the BioCM has a wider distribution range. The BioCM/1HR has ∼80% of is particles within 2–10 μm and the BioCM/4HR has ∼87% within 2 to 10 μm, similar to the talc.
| Filler | Surface area (m2 g−1) | Total pore volume (cc g−1) | Average pore radius (nm) |
|---|---|---|---|
| Talc | 11.00 | 0.00821 | 14.92 |
| BioCM/1HR | 6.55 | 0.00141 | 4.30 |
| BioCM/4HR | 9.09 | 0.00177 | 3.89 |
| Sample | % of particles within the size range | Average particle size (μm) | Aspect ratio | ||||
|---|---|---|---|---|---|---|---|
| <2 μm | 2–3 μm | 3–5 μm | 5–10 μm | ≥10 μm | |||
| Talc | 0 | 4.52 | 54.35 | 38.51 | 2.63 | 5.15 | 0.666 |
| BioCM/1HR | 7.02 | 17.82 | 30.05 | 35.02 | 10.09 | 5.54 | 0.628 |
| BioCM/4HR | 7.75 | 32.39 | 36.17 | 19.35 | 4.37 | 4.21 | 0.617 |
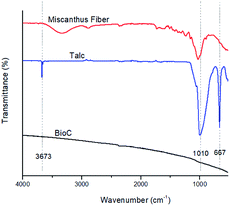
3.2 Infrared analysis of fillers and composites
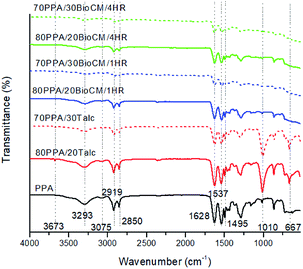
Fig. 1 shows the FTIR spectra collected for the raw Miscanthus, the talc and the BioC before ball-milling, for reference. The pyrolysis process that the biocarbon went through resulted in a spectrum without any peaks. This means that there is not a significant number of functional groups on the material that can be detected by FTIR. This has also been reported in previously published studies that employed high temperature pyrolysis in order to produce biocarbon.37 High temperatures of pyrolysis are also accompanied by an increase in the concentration of carbon and the reduction of oxygen and hydrogen, which are the more abundant elements in biomass, as previously reported.31 Talc itself shows three characteristic peaks at 3673, 1010 and 667 cm−1, corresponding to –OH vibrations of the Mg and Si hydroxides.38The FTIR spectra of the unfilled PPA and the composites are shown in Fig. 2. Previous studies39 show similar characteristic peaks of PPA: the peaks at 1628 cm−1 and 3293 cm−1 are related to vibrations of the amide group, the 3075 cm−1, 1495 cm−1 and 1537 cm−1 peaks can be attributed to the motions of the benzene rings present in the polymer matrix, and the 2850 cm−1 and 2919 cm−1 and peaks are associated with the CH2 groups present in the PPA's polymer chain. The FTIR spectra of the biocarbon composites have the same characteristic peaks as the neat PPA, at a reduced peak height, while the talc composites all have the three characteristic peaks found in the talc filler. These results indicate that both the talc and the biocarbons are not generating any significant amount of new or already present chemical bonds with the polymer matrix that can be detected through FTIR, and that mechanical properties of the composites could be attributed purely to polymer-filler interactions.
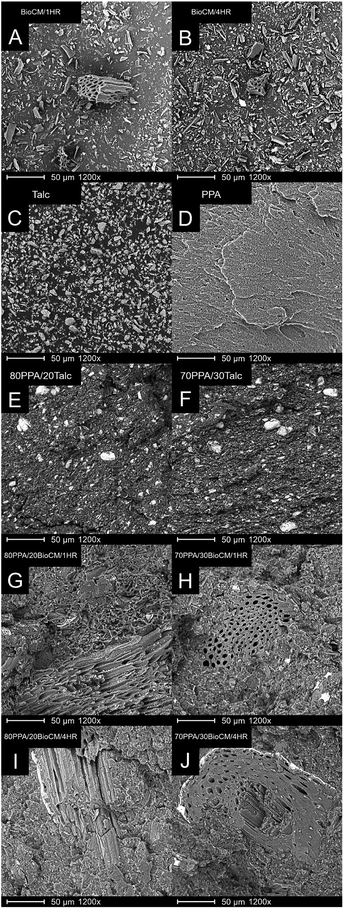
3.3 Morphological analysis
SEM images of the talc and the two biocarbons are shown in Fig. 3A–C. The talc has particles with similar shape and size, confirming the results from the particle analysis. The biocarbon BioCM/1HR shows a wider range of particle size and larger particles in general compared to BioCM/4HR, confirming the results obtained from particle analysis. The particles all have a high aspect ratio and angular, irregular shapes. The SEM image of neat PPA is shown in Fig. 3D. A homogenous matrix is observed, the micro-voids and striations being a result of the crack propagation during the impact testing.The talc-filled composites are shown in Fig. 3E and F. Both talc composites show good dispersion of the talc particles, with some small agglomerations. A stratified structure can be observed within the polymer matrix of the talc-filled composites, and larger agglomerations occur, as well as delamination of the talc particles, as has also been previously reported.40 The 20 and 30 wt% filled composites with BioCM/1HR and BioCM/4HR are very similar. However, as most biocarbon particles cannot be easily observed through SEM, and the particle size analysis showed that the majority are within a narrow range of sizes, the images were taken in locations in which larger particles were observed in order to highlight specific morphological features not easily seen otherwise. In Fig. 3G–J, it can also be observed that both the matrix and particles are not easily distinguished, suggesting good interaction and compatibility between the biocarbon particles and the PPA polymer matrix. In Fig. 3G, H and J, the pores previously observed in BioCM/1HR and BioCM4/HR are clearly visible in the images of all the biocarbon-filled composites, and no phase separation of the particles and the PPA can be seen. 80PPA/20BioCM/4HR shows smaller pores within the structure of the biocarbon, and 70PPA/30BioCM/4HR shows part of the internal structure within the biocarbon, revealing layers of sheets.
3.4 Mechanical analysis
The tensile properties of the composites and the unfilled PPA are shown in Fig. 4A. Adding talc and biocarbon to the neat PPA polymer matrix increases the Young's modulus of the resulting composites. The largest increase, of 100%, can be seen in the composites filled with 30 wt% of talc and biocarbon. The tensile strength is reduced in both talc-filled composites and in the 20 wt% filled biocarbon composites, but not significantly. The elongation at break of the neat PPA (14.11 ± 4.04%) decreased for all composites, for the 20 wt% filled composites, the talc filled one had a higher elongation (4.20 ± 0.12%) than the two biocarbon composites (3.67 ± 0.23% and 3.76 ± 0.27% for 80PPA/20BioCM/1HR and 80PPA/20BioCM/4HR, respectively), while for the 30 wt% composites, the opposite occurs; the two biocarbon composites have a higher elongation at break (2.91 ± 0.24% and 3.15 ± 0.17% for 70PPA/30BioCM/1HR and 70PPA/30BioCM/4HR, respectively) than the 30 wt% talc-filled composite (2.58 ± 0.23%). Whatever effect the fillers have on the composites, it must depend on a mechanical/physical interaction between the present particles and the PPA polymer matrix, as no apparent chemical bonding was seen based in the FTIR results. Adding talc causes an increase in the mechanical properties, a well-documented fact, and its effect can be found in a number of polymer matrices, such as polypropylene.41,42 It was found that the affinity between the biocarbon and the polymer (a non-aromatic polyamide) matrix can help elucidate the increase in the modulus: as the wt% of the biocarbon increases, so does the tensile modulus of the composites.31 The effect is more pronounced in flexural properties, as increasing the wt% of fillers also increases the modulus and the maximum flexural strength, as shown on Fig. 4B). Following the same trend as the tensile properties, the composites with the highest increase in the flexural modulus were those with 30 wt% biocarbon, with an increase of 102% relative to the unfilled PPA.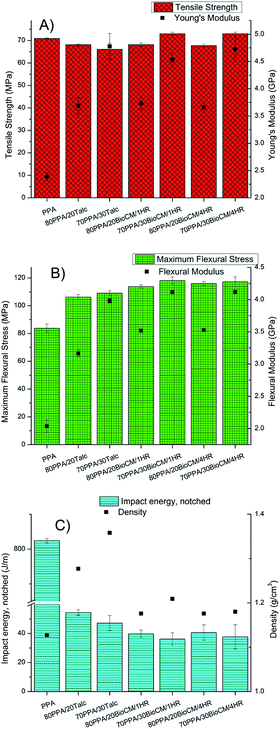 | ||
| Fig. 4 (A) Tensile properties, (B) flexural properties and (C) impact energy and density of the composites. | ||
Both tensile and flexural properties suggest that the addition of biocarbon increases the stiffness of the material. Previous studies performed with different polymer matrices,37,40,43,44 show that the addition of a high temperature biocarbon increases the tensile modulus, although in some cases it reduces the tensile strength. As for the reduction in particle size, it did not significantly affect any of the mechanical tests, as both biocarbons had a similar distribution range.
This increase in stiffness in the filled composites, in contrast with the unfilled PPA, is also suggested by the impact energy decrease that occurs with the addition of the fillers, with the lowest impact energy being that of the composites with 30 wt% of biocarbon, as can be seen in Fig. 4C, although the differences between all the composites do not seem to be significant. Above a certain critical size of 30 nm, the size of the particles does not significantly affect the mechanical properties.45 As the size of all the employed fillers is bigger than 30 nm, it explains why the two different biocarbon composites have very similar properties. It should be noted that the neat PPA matrix did not fully break so, according to the ASTM standard, it cannot be directly compared. However, it has been included for the sake of completeness, and to show how the addition of BioCM and talc significantly decreases the impact energy.
As discussed previously, the SEM images of the biocarbon-filled composites show that the biocarbon has no phase separation between the PPA matrix in the four composites, as there is no gap or void between the biocarbon and the polymer. This adhesion could then be explained by a favorable interaction between the PPA matrix and the biocarbon particles. The FTIR spectra of the composites, shown in Fig. 2, suggest that this interaction is not through a chemical bond, but rather through a van der Waals-type interaction.
In a PPA-blend with carbon nanotubes, the good compatibility between the nanofillers and the PPA has been suggested as a possible example of π stacking or aromatic–aromatic interaction, due to the presence of benzene rings in both the polymer and the carbon nanotubes.22 The data in this study could be pointing to a similar phenomenon, with further research necessary to confirm or deny this possibility.
Fig. 4C also shows that the biocarbon composites have a lower density than the talc filled ones, an 8% decrease for the equivalent 20 wt% composite and an 11% decrease for the equivalent 30 wt% composite. This is a key finding in the search for lightweight materials, especially for transport applications, as having similar mechanical properties at a lower weight is key for a material for transport applications.
3.5 Rule of mixtures
One way to explain the interaction between the particles and the filler is to employ the rule of mixtures. This rule states that the behavior of certain properties in a composite must fall within two bounds. In the particular case of the elastic modulus, the upper bound formula is as follows:| Ec(u) = EmVm + EpVp | (1) |
 | (2) |
The elastic modulus of the biocarbon-filled composites has been calculated in this study. The elastic modulus of the biocarbon has been measured in previous studies and has been estimated as 15.78 GPa.36 The volume fraction that the matrix and the particles occupy can be estimated using the fact that, in a composite, the sum of the mass of the matrix and the particle is the mass of the composite:
| mc = mm + mp | (3) |
Using the relationship that m = vρ:
| vcρc = vmρm + vpρp | (4) |
Dividing by the volume of the composite:
 | (5) |
The ratios of  and
and  are the volume fractions Vm and Vp, respectively:
| ρc = Vmρm + Vpρp | (6) |
As the sum of the volume fractions must be 1, so (1 − Vm) = Vp:
| ρc = (1 − Vp)ρm + Vpρp | (7) |
Rearranging the terms gives the particle volume fraction in terms of the densities of the composite, matrix and particles:
 | (8) |
The density of the particles, ρp, has also been previously calculated at 1.7 g cm−3.46 The bounds, as well as the volume fractions of each composite and their elastic (Young's) moduli, are shown on Fig. 5. It is apparent that the biocarbon-filled composites have elastic moduli above what the upper bound of the rule of mixtures predicts. This suggests that there is an interaction between the polymer and the biocarbon that cannot be explained solely by adding the mechanical properties of the PPA polymer matrix and the biocarbon particles.
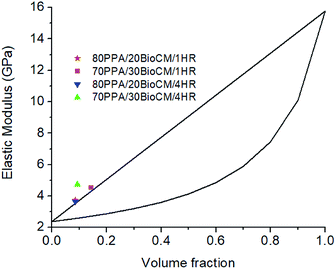 | ||
| Fig. 5 Rule of mixtures showing the predicted behavior of the composites versus the experimental results. | ||
3.6 Thermal properties
Typical thermogravimetric curves of the composites can be seen in Fig. 6. In terms of thermal degradation, there is a change in the temperature at which 2 wt% of the composite is lost for the two types of particle-filled composite. The 30 wt% 4 hours ball-milled biocarbon-filled composite in particular, has an increase of 20 °C with respect to the unfilled PPA, as shown in Table 4. However, the temperatures at which 5 and 10 wt% of the composites are lost and the maximum degradation temperature all show no significant change for any of the filled composites with respect to the unfilled PPA. As shown in Fig. 6, the filler content of the biocarbon and talc is within the expected value, with a small difference being due to the inherent error of producing each sample in the compounding machine. The result showing that the polymer has an increased thermal stability of 2% weight loss with a 30 wt% biocarbon-filled composite is similar to what has been found in other polymer matrices, such as polypropylene.40 Table 4 clearly shows the HDT boosting properties of talc, as the 30 wt% talc-filled composite shows an increase of ∼85%, compared to the neat PPA. The highest increase in HDT due to the BioCM, is for the composite with 30% BioCM/1HR, with an increase of ∼32%, compared to the neat PPA.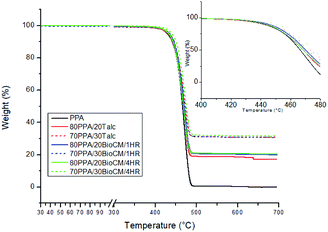 | ||
| Fig. 6 TGA analysis of the composites and the unfilled PPA, with an inset showing the early stages of thermal degradation. | ||
![[thin space (1/6-em)]](https://www.rsc.org/images/entities/char_2009.gif) δ signal of the DMA analysis and the HDT analysis
δ signal of the DMA analysis and the HDT analysis
| Material | 2% weight loss temperature [°C] | 5% weight loss temperature [°C] | 10% weight loss temperature [°C] | Maximum degradation temperature [°C] | Glass transition temperature (tan![[thin space (1/6-em)]](https://www.rsc.org/images/entities/char_2009.gif) δ) [°C] δ) [°C] |
HDT at 0.455 MPa, at 0.2% strain [°C] |
|---|---|---|---|---|---|---|
| PPA | 404.86 ± 8.10 | 429.71 ± 0.33 | 441.72 ± 0.01 | 471.55 ± 1.22 | 140.77 ± 9.84 | 122.30 ± 17.97 |
| 80PPA/20Talc | 409.34 ± 1.16 | 432.42 ± 1.19 | 443.47 ± 1.27 | 472.04 ± 1.05 | 138.45 ± 10.80 | 141.70 ± 21.32 |
| 70PPA/30Talc | 414.11 ± 5.55 | 434.88 ± 2.09 | 445.98 ± 1.32 | 473.34 ± 1.10 | 144.99 ± 2.14 | 225.70 ± 2.04 |
| 80PPA/20BioCM/1HR | 411.46 ± 4.24 | 433.33 ± 0.70 | 444.88 ± 0.01 | 470.36 ± 0.57 | 143.47 ± 2.13 | 139.56 ± 7.83 |
| 70PPA/30BioCM/1HR | 416.28 ± 1.58 | 435.99 ± 1.70 | 447.07 ± 1.78 | 471.69 ± 1.73 | 144.87 ± 0.10 | 161.92 ± 0.89 |
| 80PPA/20BioCM/4HR | 413.15 ± 4.18 | 433.93 ± 1.72 | 445.15 ± 2.61 | 470.94 ± 3.03 | 134.16 ± 1.66 | 139.85 ± 13.67 |
| 70PPA/30BioCM/4HR | 425.28 ± 0.81 | 439.75 ± 1.00 | 449.74 ± 0.96 | 473.31 ± 0.84 | 149.42 ± 0.08 | 155.79 ± 5.82 |
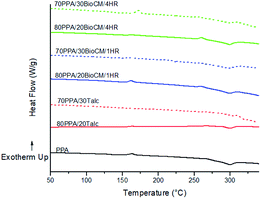
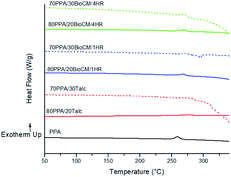
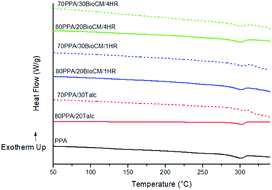
Fig. 7 to Fig. 9 show the results of the DSC analysis, while Table 5 shows the relevant enthalpy information (see also Fig. 8). The crystallinity of polymer composites can be calculated from the measured enthalpies of the composite, which requires ΔH0f (the enthalpy of crystallization of a theoretical 100% crystalline form of the unfilled PPA). However, this data has not been calculated.47 The Tg cannot be clearly seen for the neat PPA or the composites from the DSC curve, although it has been reported at 117 °C for the unfilled PPA.22 A small exothermic peak is also observed in all the composites, which decreases in height in more highly loaded composites. The Tm does not change significantly from the unfilled PPA to the composites. The decrease in the ΔHf in comparison with the unfilled PPA indicates that the fillers are affecting the energy required for a crystallization process within the polymer matrix. Although there is a small increase for the ΔHf, going from 80PPA/20BioCM/1HR to 70PPA/30BioCM/1HR, the difference is small enough to be attributable to an error when measuring the sample, as the ΔHc of the composites follows the same trend for all composites and fillers, it decreases as the wt% of the filler increases. The addition of the BioCM particles increases the Tc which, according to previous studies performed with other polymer matrices, means the particles could act as nucleating agents and enhance the crystallization process.37,40,43,48
| Material | Tm [°C] | ΔHf [J g−1] | Tc [°C] | ΔHc [J g−1] |
|---|---|---|---|---|
| PPA | 299.20 | 14.08 | 259.22 | 27.50 |
| 80PPA/20Talc | 300.09 | 9.731 | 277.44 | 16.44 |
| 70PPA/30Talc | 300.66 | 8.176 | 280.74 | 12.95 |
| 80PPA/20BioCM/1HR | 298.84 | 11.35 | 268.72 | 18.81 |
| 70PPA/30BioCM/1HR | 299.07 | 12.34 | 272.45 | 16.53 |
| 80PPA/20BioCM/4HR | 298.65 | 12.62 | 269.55 | 18.53 |
| 70PPA/30BioCM/4HR | 299.29 | 7.766 | 269.59 | 15.68 |
The addition of talc also aided the crystallization process in both talc-filled composites, as can be seen from the increase of the cold crystallization temperature. Studies performed with a polypropylene matrix show that talc can perform the role of a nucleating agent for the polymer matrix to form spherulites,42,49 suggesting the same possibility for PA. These results coincide with the morphology observed, in which the talc was seen to influence the structure of the polymer matrix, especially for the 30 wt% filled composites.
3.7 Thermomechanical analysis
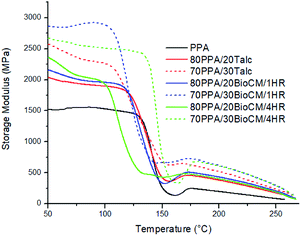
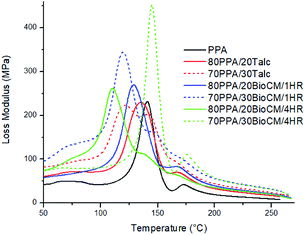
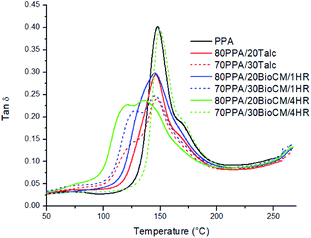
Fig. 10 to Fig. 12 show the thermomechanical properties of the unfilled PPA polymer and the particle-filled composites. Due to the viscoelastic nature of polymers, two different terms appear when these materials are tested: storage modulus, which corresponds to the change in the elastic modulus of the polymer with respect to the loading frequency, and loss modulus, which corresponds to the damping or dissipative behavior while under the dynamic load. The ratio between them is called tan![[thin space (1/6-em)]](https://www.rsc.org/images/entities/char_2009.gif) δ. The results show that, as both the talc and BioCM particles are added, there is an increase of the storage modulus, the largest increase occurring at 30 wt% of the 1 hour ball-milled biocarbon composite. As indicated by the DSC results, this data also confirms inhibition of the movement of the PPA chains by the two fillers, as the addition of the filler impedes the motion of the chains, thus increasing the stiffness of the material. Fig. 10 and 11 show that all the composites have similar behavior: a glassy state up to 100–120 °C, a leathery region up to ∼150 °C, followed by a rubbery plateau up to ∼210 °C and, finally, rubbery flow. Fig. 12 shows that the Tg of the composites has not shifted significantly. The reduction in magnitude of the peak tan
δ. The results show that, as both the talc and BioCM particles are added, there is an increase of the storage modulus, the largest increase occurring at 30 wt% of the 1 hour ball-milled biocarbon composite. As indicated by the DSC results, this data also confirms inhibition of the movement of the PPA chains by the two fillers, as the addition of the filler impedes the motion of the chains, thus increasing the stiffness of the material. Fig. 10 and 11 show that all the composites have similar behavior: a glassy state up to 100–120 °C, a leathery region up to ∼150 °C, followed by a rubbery plateau up to ∼210 °C and, finally, rubbery flow. Fig. 12 shows that the Tg of the composites has not shifted significantly. The reduction in magnitude of the peak tan![[thin space (1/6-em)]](https://www.rsc.org/images/entities/char_2009.gif) δ associated with the Tg e for all composites suggests that there is an increasing amount of friction between the polymer chains compared to the unfilled PPA. Thus, this analysis confirms what was apparent from the results gathered from the DSC and the morphology analysis of the samples: that the fillers were acting as nucleating agents.
δ associated with the Tg e for all composites suggests that there is an increasing amount of friction between the polymer chains compared to the unfilled PPA. Thus, this analysis confirms what was apparent from the results gathered from the DSC and the morphology analysis of the samples: that the fillers were acting as nucleating agents.
4 Conclusions
The present study characterizes the PPA-biocarbon composites. The produced BioCM, with a reduced surface area, and wider particle size distribution, in both its ball-milling time configurations, acted as an effective alternative to talc, as the biocarbon-filled composites matched the properties of the same wt% talc-filled composites (with the exception of impact energy and heat deflection temperature), but at 10% lower density. No new functional groups were found between the PPA and the depleted BioCM, which given its mechanical properties when blended together, and the composites surpassing the predicted values using the rule of mixtures, suggests that the properties of the biocarbon-filled composites cannot be attributed solely to physical interactions between the particles and the matrix. Thermal performance was not affected, and an increase in HDT was found in both talc and biocarbon filled composites. DSC and DMA data suggest that the biocarbon particles acted as nucleating agents, increasing the friction between the polymer chains. Further research needs to be conducted in other to obtain the maximum amount of biocarbon that enhances the mechanical properties in a PPA matrix, as well as fully explaining what interaction is responsible for the good compatibility between the biocarbon and the polymer matrix.Conflicts of interest
There are no conflicts to declare.Acknowledgements
The authors are thankful for the financial support from the following to carry out this research: (i) the Ontario Ministry of Agriculture, Food and Rural Affairs (OMAFRA)/University of Guelph – Bioeconomy for Industrial Uses Research Program (Project #030332); (ii) the Natural Sciences and Engineering Research Council (NSERC), Canada Discovery Grants Project #400320 and 401111; (iii) the NSERC - Collaborative Research and Development Grants (CRD) Project #401637 with the partner industries Prism Farms Limited and Competitive Green Technologies, Lamington, Ontario, Canada.References
- V. Masson-Delmotte, P. Zhai, H.-O. Pörtner, D. Roberts., J. Skea, P. R. Shukla, A. Pirani, W. Moufouma-Okia, C. Péan, R. Pidcock, S. Connors, J. B. R. Matthews, Y. Chen, X. Zhou, M. I. Gomis, E. Lonnoy, T. Maycock, M. Tignor and T. Waterfield, 2018: Summary for Policymakers, IPCC, 2018 Search PubMed.
- M. Crippa, G. Oreggioni, D. Guizzardi, M. Muntean, E. Schaaf, E. Lo Vollulo, E. Solazzo, F. Monforti-Ferrario, J. G. J. Olivier and E. Vignati, Fossil CO2 and GHG emissions of all world countries – 2019 Report, European Union Joint Research Centre, 2019 Search PubMed.
- R. Sims, R. Schaeffer, X. Cruz-Núñez, M. D'Agosto, D. Dimitriu, M. J. Figueroa Meza, L. Fulton, S. Kobayashi, O. Lah, A. McKinnon, P. Newman, M. Ouyang, J. J. Schauer, D. Sperling and G. Tiwari, 2014: Transport, IPCC, 2014 Search PubMed.
- Energy and Environmental Analysis Inc., Technology to Improve the Fuel Economy of Light Trucks to 2015, 2006 Search PubMed.
- Economics & Statistics Department American Chemistry Council, Plastics and Polymer Composites in Light Vehicles, 2019 Search PubMed.
- B. T. Fichman, Annual Energy Review 2011, U.S. Energy Information Administration, 2012 Search PubMed.
- American Chemistry Council – Plastics Division and the Society of Plastics Engineers Automotive Division, 199 Ways Automotive Plastics Save OEM Costs, 2013 Search PubMed.
- D. Parker, J. Bussink, H. T. van de Grampel, G. W. Wheatley, E.-U. Dorf, E. Ostlinning, K. Reinking, F. Schubert, O. Jünger and R. Wagener, in Ullmann's Encyclopedia of Industrial Chemistry, ed. Wiley-VCH Verlag GmbH & Co. KGaA, Wiley-VCH Verlag GmbH & Co. KGaA, Weinheim, Germany, 2012 Search PubMed.
- V. Mittal, in High Performance Polymers and Engineering Plastics, ed. V. Mittal, John Wiley & Sons, Inc., Hoboken, NJ, USA, 2011, pp. 1–20 Search PubMed.
- Market Research Future, High Performance Polyamide Market Size, Price, Competitive Analysis, Business Growth, Trend, Outlook, Future Technologies Forecast to 2025|MRFR, accessed October 30, 2019, https://www.marketresearchfuture.com/reports/high-performance-polyamide-market-4460 Search PubMed.
- Market Research Future, Commodity Plastic Market Research - Industry Size, Share, Analysis, Forecast to 2022, accessed October 30, 2019, https://www.marketresearchfuture.com/reports/commodity-plastic-market-2771 Search PubMed.
- D20 Committee, Classification System and Basis for Specification for Polyphthalamide (PPA) Injection Molding Materials, ASTM International, 2015 Search PubMed.
- D. Kemmish, Practical Guide to High Performance Engineering Plastics, Smithers Rapra, Shrewsbury, 2011 Search PubMed.
- J. Guo, J. Wang, Y. Wu, Y. He, H. Song and X. Chen, Polym. Eng. Sci., 2019, 59, 246–253 CrossRef CAS.
- B. E. Hempy and J. S. Lyons, Polym. Test., 1999, 18, 439–447 CrossRef CAS.
- J. S. Lyons, Polym. Test., 1998, 17, 237–245 CrossRef CAS.
- Q. Li, H. Yu, F. Wu, J. Song, X. Pan and M. Zhang, Appl. Surf. Sci., 2016, 363, 338–345 CrossRef CAS.
- X.-B. Lin, L. Chen, J.-W. Long, D. Shuang-Lan and Y.-Z. Wang, Chem. Eng. J., 2018, 334, 1046–1054 CrossRef CAS.
- Z. Wang, X. Tong, J. Yang, X. Wang, M. Zhang, G. Zhang, S. Long and J. Yang, Compos. Sci. Technol., 2019, 175, 6–17 CrossRef CAS.
- S. Ryu, H. Oh and J. Kim, Polymers, 2019, 11, 1628 CrossRef CAS PubMed.
- A. Y. Pulyalina, A. A. Larkina, M. V. Tataurov, L. V. Vinogradova and G. A. Polotskaya, Fullerenes, Nanotubes, Carbon Nanostruct., 2020, 28, 54–60 CrossRef CAS.
- M. Lee, K. Son, J. Kim, D. Kim, B. H. Min and J. H. Kim, Compos. Sci. Technol., 2018, 164, 260–266 CrossRef CAS.
- V. Flaris, in Functional Fillers for Plastics, ed. M. Xanthos, Wiley-VCH Verlag GmbH & Co. KGaA, Weinheim, FRG, 2005, pp. 207–220 Search PubMed.
- D. Civancik-Uslu, L. Ferrer, R. Puig and P. Fullana-i-Palmer, Sci. Total Environ., 2018, 626, 927–940 CrossRef CAS PubMed.
- S. M. Luz, A. Caldeira-Pires and P. M. C. Ferrão, Resour. Conserv. Recycl., 2010, 54, 1135–1144 CrossRef.
- G. Maschio, C. Koufopanos and A. Lucchesi, Bioresour. Technol., 1992, 42, 219–231 CrossRef CAS.
- M. Picard, S. Thakur, M. Misra, D. F. Mielewski and A. K. Mohanty, Sci. Rep., 2020, 10, 3310 CrossRef CAS PubMed.
- S. Arnold, A. Rodriguez-Uribe, M. Misra and A. K. Mohanty, J. Clean. Prod., 2018, 172, 2748–2758 CrossRef CAS.
- P. Quosai, A. Anstey, A. K. Mohanty and M. Misra, R. Soc. Open Sci., 2018, 5, 171970 CrossRef PubMed.
- M. R. Snowdon, F. Wu, A. K. Mohanty and M. Misra, RSC Adv., 2019, 9, 6752–6761 RSC.
- E. O. Ogunsona, A. Codou, M. Misra and A. K. Mohanty, J. Polym. Environ., 2018, 26, 3574–3589 CrossRef CAS.
- A. K. Mohanty, S. Vivekanandhan, J.-M. Pin and M. Misra, Science, 2018, 362, 536–542 CrossRef CAS PubMed.
- J. Yoder, S. Galinato, D. Granatstein and M. Garcia-Pérez, Biomass Bioenergy, 2011, 35, 1851–1862 CrossRef CAS.
- D. Tadele, P. Roy, F. Defersha, M. Misra and A. K. Mohanty, Clean Technol. Environ. Policy, 2020, 22, 639–649 CrossRef CAS.
- T. Wang, A. Rodriguez-Uribe, M. Misra and A. K. Mohanty, BioResources, 2018, 13, 3720–3739 CAS.
- E. O. Ogunsona, M. Misra and A. K. Mohanty, Composites, Part A, 2017, 98, 32–44 CrossRef CAS.
- E. Behazin, M. Misra and A. K. Mohanty, Composites, Part B, 2017, 118, 116–124 CrossRef CAS.
- S. A. Parry, A. R. Pawley, R. L. Jones and S. M. Clark, Am. Mineral., 2007, 92, 525–531 CrossRef CAS.
- Y. Liu, J. Yi and X. Cai, Polym. Bull., 2011, 67, 361–374 CrossRef CAS.
- M. A. Abdelwahab, A. Rodriguez-Uribe, M. Misra and A. K. Mohanty, Molecules, 2019, 24, 4026 CrossRef CAS PubMed.
- L. Lapcik, P. Jindrova, B. Lapcikova, R. Tamblyn, R. Greenwood and N. Rowson, J. Appl. Polym. Sci., 2008, 110, 2742–2747 CrossRef CAS.
- K. Wang, N. Bahlouli, F. Addiego, S. Ahzi, Y. Rémond, D. Ruch and R. Muller, Polym. Degrad. Stab., 2013, 98, 1275–1286 CrossRef CAS.
- O. Das, D. Bhattacharyya, D. Hui and K.-T. Lau, Composites, Part B, 2016, 106, 120–128 CrossRef CAS.
- J. Andrzejewski, M. Misra and A. K. Mohanty, J. Appl. Polym. Sci., 2018, 135, 46449 CrossRef.
- S.-Y. Fu, X.-Q. Feng, B. Lauke and Y.-W. Mai, Composites, Part B, 2008, 39, 933–961 CrossRef.
- C. E. Brewer, V. J. Chuang, C. A. Masiello, H. Gonnermann, X. Gao, B. Dugan, L. E. Driver, P. Panzacchi, K. Zygourakis and C. A. Davies, Biomass Bioenergy, 2014, 66, 176–185 CrossRef CAS.
- T. Grätzl, Y. van Dijk, N. Schramm and L. Kroll, Compos. Struct., 2019, 208, 557–565 CrossRef.
- E. Behazin, M. Misra and A. K. Mohanty, ACS Omega, 2017, 2, 2191–2199 CrossRef CAS PubMed.
- E. Ferrage, F. Martin, A. Boudet, S. Petit, G. Fourty, F. Jouffret, P. Micoud, C. Bourgerette, J. Ferret, Y. Saint-Gerard and S. Buratto, J. Mater. Sci., 2002, 37, 1561–1573 CrossRef CAS.
| This journal is © The Royal Society of Chemistry 2020 |

