 Open Access Article
A ratiometric fluorescence sensor based on enzymatically activatable micellization of TPE derivatives for quantitative detection of alkaline phosphatase activity in serum†
Jeongmoo Lee‡
ab,
Seoyun Kim‡ab,
Tae Hoon Kimc and
Seoung Ho Lee *ab
*ab
aDepartment of Chemistry, Daegu University, Gyeongsan 38453, Republic of Korea. E-mail: slee@daegu.ac.kr; Fax: +82-53-210-7913; Tel: +82-53-850-6444
bInstitute of Natural Sciences, Daegu University, Gyeongsan 38453, Republic of Korea
cDepartment of Food Science and Biotechnology, Daegu University, Gyeongsan 38453, Republic of Korea
First published on 20th July 2020
Abstract
A novel ratiometric fluorescence assay via enzymatically activatable micellization in aqueous solution was devised for quantitative detection of alkaline phosphatase (ALP) activity. We demonstrated that the dephosphorylation of the water-soluble, phosphate-functionalized, fluorophore monomer P-TPE-TG, induced by an enzymatic reaction of ALP, leads to micelle formation in aqueous solution because its water-soluble functionality is reduced. The dephosphorylation-induced micellization of P-TPE-TG exhibited a ratiometric sensing response for various ALP concentrations (10–200 mU mL−1) and provided a suitable sensing platform for naked eye detection with increased fluorescence quantum yield (Φ = 3.2%), even compared to a typical TPE-based sensor (Φ = 1.0%), where ALP can be sensed with a detection limit of 0.034 mU mL−1. In addition, P-TPE-TG displayed excellent sensing performance at concentrations from 0 to 50 mU mL−1 in diluted human serum (10%), which offers the capability to exploit ratiometric responses for bioactive substances under practical conditions.
Introduction
Enzymes are involved in many complex chemical reactions in living organisms. As an example, alkaline phosphatase (ALP) plays an important role associated with dephosphorylation in various metabolic processes in cells.1,2 Deregulation of the dephosphorylation induced by abnormal levels of ALP can lead to serious problems in the liver, kidney, gallbladder, etc.3,4 Accordingly, during the past several decades, numerous fluorescence sensors for monitoring ALP's activity have been designed and developed.5–7 In particular, considerable efforts have focused on the development of efficient fluorogenic systems that work in practical blood conditions.8,9 However, relatively few reports of effective ALP sensors that operate in the real blood system have been reported because most fluorescence sensors are limited in converting their detection into fluorescence signals in the presence of various interfering substances.10Fluorescence chemosensors based on the aggregation-induced emission (AIE) effect have attracted considerable attention due to their tremendous potential as effective turn-on sensing tools.11,12 In particular, tetraphenylethylene (TPE) derivatives have been widely studied as representative AIE compounds.13,14 These TPE derivatives do not emit light but exhibit strong fluorescence resulting from the restriction of their motion in the aggregated state. Moreover, the AIE effect of TPE aggregates tends to increase as their motions are further confined, resulting in enhanced fluorescence.15,16 However, since the solubility issue of aggregated TPE in aqueous solution, which can affect the photophysical properties, hinders the application to practical biosensors, a new type of sensing platform based on TPE derivatives is required.17
A micelle refers to an aggregate of amphiphilic molecules above a certain concentration under particular solvent conditions. In aqueous media, when micelles are formed, hydrophobic units of the inner part are surrounded by hydrophilic groups, which stabilize and allow the aggregates to dissolve well.18,19 The micelle formation in aqueous media is mainly affected by the hydrophobic degree of the amphiphiles and various environmental factors such as pH, solvent polarity, and temperature. Since such characteristics for micellization can provide a useful platform for drug delivery, molecular encapsulation, and chemical sensors, numerous application studies based on micelle formation and relaxation have been conducted.20,21 In particular, micelle-based probes have been considered a promising candidate as potential chemo- and bio-sensors due to their structural flexibility and versatility, along with the possibility of controlled adjustment of the parameters.22–24
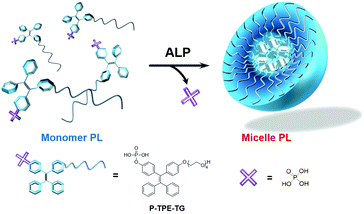
In this work, we report a novel ratiometric fluorescence sensory system for quantitative detection of ALP, which is based on enzymatically activatable micellization. As shown in Fig. 1, phosphate-functionalized (P) tetraphenylethylene (TPE) with a tetraethylene glycol unit (TG), P-TPE-TG, was designed to be soluble in water and emit blue light. Dephosphorylation of P-TPE-TG with ALP induced a micellar structure in aqueous solutions, where TPE derivatives with decreased hydrophilicity were self-assembled. The micellization of P-TPE-TG by enzymatic reaction gave rise to ratiometric fluorescence colour changes with increased quantum yield. This new system affords practical sensing ability for the detection of ALP's activity in human serum.
Results and discussion
Synthesis
The water-soluble P-TPE-TG and amphiphilic counterpart TPE-TG forming micelles in aqueous solutions were synthesized, as outlined in Scheme 1. The control monomer P-TPE was also prepared, which is water-soluble but can be aggregated by enzymatic reaction with ALP.25 Compound 1 was synthesized in 64.0% yield from commercially available benzophenone and 4,4′-dihydroxybenzophenone via an Ti-catalyzed reaction, as described in the literature (Scheme S1†).26 A phosphonate ester group was readily incorporated into 1 to produce 2 in 43% yield. Then, alkylation of 1 and 2 with monotosylated-tetraethylene glycol was performed to give 3 and TPE-TG in 79% and 45% yield, respectively. Finally, the phosphonate ester group was hydrolysed with bromotrimethylsilane in MeOH/CH2Cl2 (1![[thin space (1/6-em)]](https://www.rsc.org/images/entities/char_2009.gif) :
:![[thin space (1/6-em)]](https://www.rsc.org/images/entities/char_2009.gif) 4, v/v). The water-soluble P-TPE-TG and P-TPE were obtained as pale-yellow solids in good yields (56–65%). The structures of P-TPE-TG, TPE-TG, and P-TPE were fully characterized by 1H-NMR, 13C-NMR, 31P-NMR and ESI-MS spectroscopy (see the ESI†).
4, v/v). The water-soluble P-TPE-TG and P-TPE were obtained as pale-yellow solids in good yields (56–65%). The structures of P-TPE-TG, TPE-TG, and P-TPE were fully characterized by 1H-NMR, 13C-NMR, 31P-NMR and ESI-MS spectroscopy (see the ESI†).
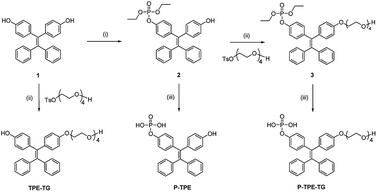 | ||
Scheme 1 Synthesis of P-TPE-TG and its catalysed form TPE-TG. Reaction conditions: (i) ClPO(OEt)2, TMA, THF, rt; (ii) K2CO3, CH3CN, 80 °C; (iii) TMSBr, MeOH/CH2Cl2 (1![[thin space (1/6-em)]](https://www.rsc.org/images/entities/char_2009.gif) : :![[thin space (1/6-em)]](https://www.rsc.org/images/entities/char_2009.gif) 4, v/v), rt. 4, v/v), rt. | ||
Enzymatic activation of P-TPE-TG
Dephosphorylation of P-TPE-TG by ALP was investigated with high performance liquid chromatography (HPLC) after incubating a solution of P-TPE-TG (1.0 × 10⁻⁵ M) with ALP (100 mU mL−1) for 20 minutes for the enzymatic reaction in 10 mM Tris–HCl buffer solution at pH 7.4. Fig. 2 shows HPLC traces before and after the enzymatic reaction of P-TPE-TG, and its catalyzed form TPE-TG, in CH3CN/H2O (1/2, v/v). The peak of P-TPE-TG at approximately 12.5 minutes of elution time appeared at approximately 13.7 minutes after the reaction with ALP (Fig. 2a and b). Interestingly, the peak of the P-TPE-TG incubated with the ALP corresponds to the elution time of its catalyzed form TPE-TG (Fig. 2c). Thus, we confirmed that P-TPE-TG undergoes a dephosphorylation that removes a hydrophilic phosphate group after an enzymatic reaction with ALP, thereby increasing its hydrophobic nature.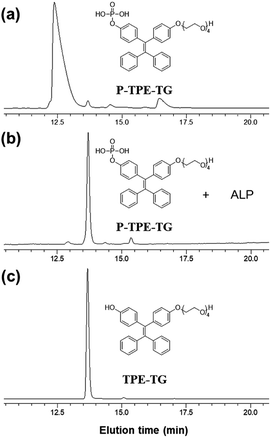 | ||
| Fig. 2 HPLC traces of (a) P-TPE-TG (1.0 × 10⁻⁵ M), (b) P-TPE-TG (1.0 × 10⁻⁵ M) incubated with ALP (100 mU mL−1) for 20 min, and (c) TPE-TG (1.0 × 10⁻⁵ M). Absorbance was monitored at 330 nm. | ||
Structural studies of P-TPE-TG for ALP
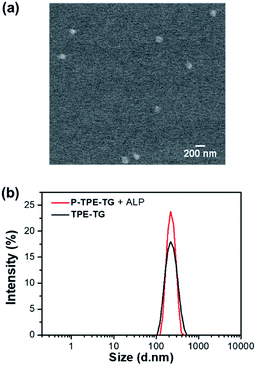
The micellization of P-TPE-TG induced by enzymatic reaction with ALP was demonstrated by field emission scanning electron microscopy (FE-SEM), atomic force microscopy (AFM), and dynamic light scattering (DLS) studies. A solution of P-TPE-TG (1.0 × 10⁻⁵ M) incubated with ALP (100 mU mL−1) was deposited on a carbon grid, the SEM image of which shows micellar agglomerates (bright contrast) with an average grain size of approximately 116.4 nm (Fig. 3a). This observation is consistent with AFM results, where three-dimensional AFM image of dephosphorylated P-TPE-TG displays micelle-like particles with an average size of 112.4 nm (Fig. S1†). As shown in Fig. 3b, the DLS result also exhibits similar features as its distribution profile represents an average size of 219.4 nm with a maximum size of approximately 458.7 nm. In the SEM image, the size of solid state can be contracted by dryness compared to that of the solution state in DLS.27,28 As expected, none of SEM, AFM or DLS result was obtained for P-TPE-TG that was not incubated with ALP. Interestingly, TPE-TG (1.0 × 10⁻⁵ M) exhibited similar features to those of P-TPE-TG incubated with ALP in DLS results (Fig. 3b). Then, we performed the concentration-dependent experiments in DLS, where P-TPE-TG was not detectable although its concentration increased in aqueous solutions, but TPE-TG showed increased particle size after 2.0 × 10⁻⁶ M (Fig. S2†), indicating that micelle formation commenced at this concentration. Based on the above observation, the aggregation of P-TPE-TG by ALP in aqueous media is attributed to the intermolecular hydrophobic interaction between the TPE units with reduced hydrophilic properties caused by dephosphorylation of P-TPE-TG. Thus, we considered that the aggregated TPE units were located inside the aggregate, thereby forming a micellar structure in aqueous solutions.Optical response of P-TPE-TG to ALP
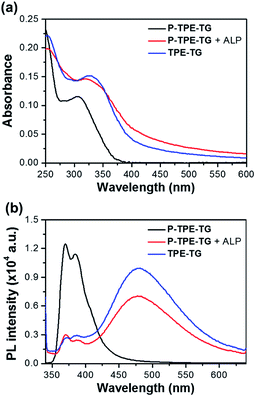
The aggregation of TPE units in the micellar structure was further clarified by UV/vis absorption and fluorescence spectroscopy. Fig. 4 shows the UV/vis absorption and fluorescence emission spectra of P-TPE-TG (1.0 × 10⁻⁵ M) in the presence of ALP (100 mU mL−1) and TPE-TG in 10 mM Tris–HCl buffer solution (pH 7.4, 37 °C). Many previous studies of TPE-based fluorescence sensors showed that due to freely-rotating groups of a TPE unit, the excited molecules relax through these rotations leading to non-fluorescence emission, and this rotation can be reduced through the formation of intermolecular aggregates, thereby exhibiting fluorescence at approximately 470–480 nm. As shown in Fig. 4b, however, the water-soluble P-TPE-TG exhibits a structured fluorescence band at λmax = 385 nm; remarkably, it does not display the emission corresponding to TPE aggregates often seen from common TPE-based sensors at a longer emission wavelength. The fact that P-TPE-TG is not aggregated in water is attributed to the high water solubility induced by both phosphate and TG groups. Since P-TPE-TG does not aggregate, the strong monomeric emission of P-TPE-TG is possibly due to the structural rigidity of TPEs resulting from the surrounding water-soluble TG groups.29The addition of ALP (100 mU mL−1) induced significant fluorescence changes, where the monomeric emission at 385 nm was reduced while the excimer-like band was increased at 475 nm. As shown in Fig. 4a, in addition, the absorption spectrum of P-TPE-TG was slightly red-shifted (Δλ = 15 nm) with the scattered feature by ALP. Based on above observations, the dephosphorylated TPE moieties of P-TPE-TG are likely to aggregate in the ground state due to its increased hydrophobic feature. This intermolecular aggregation causes restrictions on the molecular rotations of the TPE moieties, which results in strong excimer-like emission as seen in previously reported TPE-based sensors with AIE system. Interestingly, both UV/vis and fluorescence spectral results of P-TPE-TG with ALP were also similar to those of the catalyzed form TPE-TG. The slightly reduced fluorescence of dephosphorylated P-TPE-TG compared to that of TPE-TG at λmax = 475 nm is attributed to the quenching effect of the ALP, which is supported by the additional experiment that fluorescence of TPE-TG can be quenched by ALP (Fig. S3†). The concentration-dependent fluorescence changes provide clear information for the aggregation of TPE units, in which TPE-TG showed stronger excimer-like fluorescence with increasing concentration, whereas P-TPE-TG showed its monomeric fluorescence even at very high concentration (Fig. S4†). Especially, the excimer-like fluorescence intensity at 475 nm was markedly increased at 2.0 × 10⁻⁶ M, confirming the critical concentration for aggregation of TPE-TG. These results indicate that dephosphorylation of P-TPE-TG allows photophysical interaction between TPE units, suggesting that micelle-like structures with TPE aggregates can be formed in aqueous solutions.
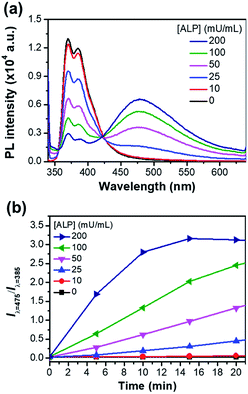
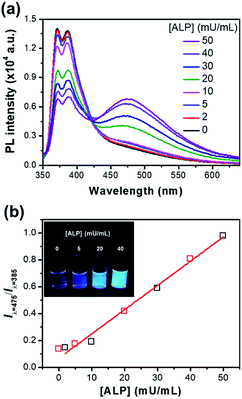
Fig. 5a shows the ratiometric fluorescence changes of P-TPE-TG incubated with various amounts of ALP for 10 minutes in 10 mM Tris–HCl buffer solution (pH 7.4, 37 °C). As the ALP concentration increases, the fluorescence intensity at 385 nm gradually decreases and the excimer-like fluorescence at 475 nm is intensively enhanced, where an isoemissive point at 424 nm is observed, indicating the emission from two distinct species. As shown in Fig. 5b, S5 and S6,† the fluorescence changes (Iλ=475/Iλ=385) as a function of time were accelerated at the higher ALP concentrations, where the ALP's activity can be quantitatively monitored with an analytical detection limit (ADL) of <0.034 mU mL−1 (Fig. S5†).30 This result indicates that a higher concentration of ALP gives rise to a faster cleavage reaction of P-TPE-TG, which promotes the generation of TPE-TG.
We then evaluated the potential of the micellar structure to act as a sensor by comparing the sensing responses of P-TPE-TG with those of the control monomer P-TPE as a result of an enzymatic reaction with ALP. Compound 1, the product of the enzymatic reaction of water-soluble P-TPE with ALP, can form a randomly aggregated structure in aqueous solutions.31 Interestingly, P-TPE-TG exhibits approximately three-fold increased fluorescence compared to P-TPE in the presence of ALP, as shown in Fig. 6. The increased fluorescence is attributed to the fact that the micellar structure allows more restriction than randomly aggregated structures in the conformational flexibility of TPE moieties, which would otherwise lead to nonradiative decay through the rotatory motion.32 In addition, since the TPE units are structurally located inside the micelle, the water contact of luminescence units can be reduced, thereby inhibiting the nonradiative decay caused by contact with a high polar solvent.33 As a result, this study clearly shows that the newly designed P-TPE-TG based on enzymatically activatable micellization can be a useful tool for monitoring ALP's activity.
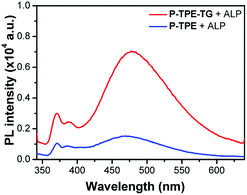 | ||
| Fig. 6 Fluorescence responses of P-TPE-TG (1.0 × 10⁻⁵ M) and P-TPE incubated with ALP (100 mU mL−1) for 20 minutes in 10 mM Tris–HCl buffer solution, at 37 °C, pH 7.4. Excitation at 330 nm. | ||
ALP detection of P-TPE-TG in serum
In order to provide practical insight into the bioanalytical applications of P-TPE-TG, the detection of ALP's activity was investigated in human serum at 37 °C, and pH 7.4 (Fig. 7). The solution was prepared with 1.0 × 10⁻⁵ M of P-TPE-TG in 10% diluted serum (10 mM Tris–HCl buffer/serum, 9![[thin space (1/6-em)]](https://www.rsc.org/images/entities/char_2009.gif) :
:![[thin space (1/6-em)]](https://www.rsc.org/images/entities/char_2009.gif) 1, v/v) at pH 7.4 and incubated for 60 minutes after the addition of ALP. Fig. 7a showed the ratiometric fluorescence changes of P-TPE-TG at various ALP concentrations in 10% diluted serum, where the fluorescence was gradually red-shifted with increasing ALP concentration. The titration profile of the fluorescence ratio changes and the corresponding fluorescence colour changes enabled the ALP concentration in serum to be approximately measured. Given that the normal concentration of ALP in 10% diluted serum is 4.0 to 19.0 mU mL−1, the P-TPE-TG can quantitatively detect the activity (>190 mU mL−1) of surplus ALP in practical serum conditions.34
1, v/v) at pH 7.4 and incubated for 60 minutes after the addition of ALP. Fig. 7a showed the ratiometric fluorescence changes of P-TPE-TG at various ALP concentrations in 10% diluted serum, where the fluorescence was gradually red-shifted with increasing ALP concentration. The titration profile of the fluorescence ratio changes and the corresponding fluorescence colour changes enabled the ALP concentration in serum to be approximately measured. Given that the normal concentration of ALP in 10% diluted serum is 4.0 to 19.0 mU mL−1, the P-TPE-TG can quantitatively detect the activity (>190 mU mL−1) of surplus ALP in practical serum conditions.34
Finally, we explicitly tested whether the specified concentration of ALP could be probed by this system. Based on the calibration plot derived from the titration profile of P-TPE-TG for ALP, 20 mU mL−1 of ALP concentration was evaluated, resulting in the recovery rate of 94.80% (measured value of 18.96 ± 0.84 mU mL−1) as shown in Table 1 and Fig. S7.† This result is comparable to the result (recovery rate: 127.20%) obtained by the well-known Kind and King's method for detecting the ALP's activity using disodium phenyl phosphate (DPP).35 Thus, this study clearly demonstrates that the newly designed florescence sensor based on enzymatically activatable micellization can be a useful tool for the activity assay of ALP even in real biological applications.
Experimental
Instrumentation
NMR spectra were recorded using a Bruker instrument (AVANCE III 500), operating at 500 MHz for 1H-NMR and at 125 MHz for 13C-NMR. UV/vis absorption spectra were recorded using a Sinco Mega-2100 UV-vis spectrometer. Steady-state fluorescence spectra were obtained with a Shimadzu fluorometer RF-6000. A 1 cm quartz cuvette was used for all spectral measurements. DLS experiments were performed with Zetasizer Nano S90 from Malvern Panalytical. SEM images were obtained with a Hitachi FE-SEM S-4300. HPLC studies were performed with Shimadzu LC-10A (HPLC pump) and SPD-10A (UV detector). ALP activity using ALP assay kit was monitored using ELISA reader (Infinite F200) from Tecan Austria GmBH.Sample preparation
A 1 cm quartz cuvette was used for all spectral measurements. Stock solutions (5.0 mM) of TPE-TG, P-TPE, and P-TPE-TG were prepared in DMSO. The solution was kept at rt. The ALP (stock solutions = 5 U mL−1 in 10 mM, pH 7.40 Tris–HCl buffer solution containing 1 mM MgCl2, 0.1 mM ZnCl2) was tested to evaluate the fluorogenic response of P-TPE and P-TPE-TG. For all fluorescence measurements, the excitation was made at 330 nm and the fluorescence emission was monitored at 385 nm and 475 nm.Fluorescence quantum yield is reported relative to known standards (quinine sulphate, Φ = 0.55 in 0.5 M H2SO4). The pH of the buffer solution was adjusted with 0.1 M HCl using a Lab 850 Benchtop pH meter.
To obtain clear SEM or AFM patterns, micellized P-TPE-TG was filtered using a hydrophobic syringe filter (0.45 μm) to remove large particles. After the films were prepared by drop-casting a filtered solution of micellized P-TPE-TG onto a copper grid or a silicon wafer, they were sufficiently washed in a deionized water bath and dried at rt for 24 hours to remove residual water.
To evaluate the activity of ALP using DPP, commercially available ALP assay kit from Asan Pharm. Co. was used and carried out according to the procedure provided by the company. Absorbance was monitored at 517 nm.
Serum lipid extraction with organic solvent
Normal human serum purchased from Sigma-Aldrich Chemical Company was used and its specifications are listed in Table S1.† Extraction with a chloroform–methanol mixture was based on the methodology of Folch et al.36 After 4 mL of normal human serum was added to 10 mL of chloroform–methanol (2![[thin space (1/6-em)]](https://www.rsc.org/images/entities/char_2009.gif) :
:![[thin space (1/6-em)]](https://www.rsc.org/images/entities/char_2009.gif) 1, v/v), the mixture was agitated manually for 1 minute and centrifuged at 4000 rpm for 10 minutes at rt. After centrifugation, the aqueous phase was collected and repeated once more with hexane.37
1, v/v), the mixture was agitated manually for 1 minute and centrifuged at 4000 rpm for 10 minutes at rt. After centrifugation, the aqueous phase was collected and repeated once more with hexane.37
Synthetic procedure
Compound 1 was prepared in a good yield as described in the literature.26Synthesis of compound 2
To a solution of 4,4'-(2,2-diphenylethene-1,1-diyl)diphenol (1) (1.2 g, 3.2 mmol) in dried THF (15 mL), TMA (1.0 g, 16.1 mmol) was added. After stirring for 5 minutes, diethyl phosphorochloridate (0.6 g, 3.6 mmol) was added to the reaction mixture. The resulting mixture was vigorously stirred at rt for 24 hours under argon gas. After the solvent was removed in vacuo, the reaction mixture was acidified with 5% aqueous HCl solution (5 mL), and then extracted with CH2Cl2 (200 mL). The organic layer was separated and washed with water (100 mL) and dried over anhydrous MgSO4, and the solvent was evaporated to yield a yellow solid. The pure product was isolated by column chromatography on silica gel using ethyl acetate![[thin space (1/6-em)]](https://www.rsc.org/images/entities/char_2009.gif) :
:![[thin space (1/6-em)]](https://www.rsc.org/images/entities/char_2009.gif) hexane (1
hexane (1![[thin space (1/6-em)]](https://www.rsc.org/images/entities/char_2009.gif) :
:![[thin space (1/6-em)]](https://www.rsc.org/images/entities/char_2009.gif) 1) as the eluent. Yield: 43%; 1H NMR (500 MHz, CDCl3): 7.10–7.05 (m, 6H), 6.94–6.91 (m, 6H), 6.83 (d, 2H, J = 8.7 Hz), 6.57 (d, 2H, J = 8.7 Hz), 4.20–4.14 (m, 3H), 1.31 (t, 6H, J = 14.2 Hz); 13C NMR (125 MHz, acetone-d6): δ 149.59, 149.54, 143.49, 141.69, 140.18, 139.12, 132.36, 130.98, 127.81, 126.60, 119.40, 119.36.
1) as the eluent. Yield: 43%; 1H NMR (500 MHz, CDCl3): 7.10–7.05 (m, 6H), 6.94–6.91 (m, 6H), 6.83 (d, 2H, J = 8.7 Hz), 6.57 (d, 2H, J = 8.7 Hz), 4.20–4.14 (m, 3H), 1.31 (t, 6H, J = 14.2 Hz); 13C NMR (125 MHz, acetone-d6): δ 149.59, 149.54, 143.49, 141.69, 140.18, 139.12, 132.36, 130.98, 127.81, 126.60, 119.40, 119.36.
General procedure for TPE-TG and 3
To a solution of compound 1 (0.4 g, 1.0 mmol) or 2 (0.5 g, 1.0 mmol) in dried CH3CN (20 mL), dried K2CO3 (0.1 g, 0.6 mmol) was added. After stirring for 5 minutes, monotosylated TG (0.4 g, 1.2 mmol) was added to the reaction mixture. The resulting mixture was vigorously stirred at 80 °C for 6 hours under argon gas. After the reaction mixture was allowed to rt, the solvent was removed in vacuo. The reaction mixture was acidified with 5% aqueous HCl solution (30 mL), and then extracted with ethyl acetate (150 mL). The organic layer was separated, washed with water (50 mL) and dried over anhydrous MgSO4, and the solvent was evaporated to yield a yellow solid. The pure product was isolated by column chromatography on silica gel using ethyl acetate as the eluent.General procedure for P-TPE and P-TPE-TG
Compound 2 (0.7 g, 1.0 mmol) or 3 (0.7 g, 1.0 mmol) was dissolved in 15 mL of CH3OH/CH2Cl2 (v/v, 1![[thin space (1/6-em)]](https://www.rsc.org/images/entities/char_2009.gif) :
:![[thin space (1/6-em)]](https://www.rsc.org/images/entities/char_2009.gif) 4) and cooled in an ice/water bath. Bromotrimethylsilane (TMSBr, 0.98 mL) was added to the solution dropwise. Upon the completion of the addition, the reaction mixture was allowed to warm to rt and stirred for another 4 hours. The excess of bromotrimethylsilane and the solvent were removed in vacuo.
4) and cooled in an ice/water bath. Bromotrimethylsilane (TMSBr, 0.98 mL) was added to the solution dropwise. Upon the completion of the addition, the reaction mixture was allowed to warm to rt and stirred for another 4 hours. The excess of bromotrimethylsilane and the solvent were removed in vacuo.
The residue was dissolved in saturated NaHCO3 and then washed three times with CH2Cl2. The aqueous phase was acidified with 5% aqueous HCl solution and poured into ethyl acetate. The organic layer was dried over anhydrous MgSO4, filtered and evaporated under reduced pressure. The product was stored as a yellow solid.
Conclusions
We have devised a new sensing approach based on a micelle that is capable of quantitatively monitoring ALP's activity. The dephosphorylation of water-soluble P-TPE-TG by an enzymatic reaction of ALP induced the formation of a micellar structure and exhibited a ratiometric sensing behaviour with a very low ADL (0.034 mU mL−1) in aqueous solutions. We also demonstrated that the micellar fluorescence system of TPE derivatives provides an excellent sensing platform with superior photophysical properties compared to the known TPE-based sensors. Considering that P-TPE-TG can quantitatively monitor the activity of ALP in human serum, which fluorogenic detections struggle to achieve because of interference from various metabolic processes, the micelle-based sensor is potential candidate as efficient sensor for detecting bioactive substances in practical bio-conditions.Conflicts of interest
There are no conflicts to declare.Acknowledgements
This research was supported by the Daegu University Research Grant 2017.Notes and references
- J. E. Coleman, Annu. Rev. Biophys. Biomol. Struct., 1992, 21, 441 CrossRef PubMed.
- Z. Song, R. T. Kwok, E. Zhao, Z. He, Y. Hong, J. W. Y. Lam, B. Liu and B. Z. Tang, ACS Appl. Mater. Interfaces, 2014, 6, 17245 CrossRef CAS PubMed.
- Z. Song, Y. Hong, R. T. K. Kwok, B. Liu and B. Z. Tang, J. Mater. Chem. B, 2014, 2, 1717 RSC.
- L. Xu, X. He, Y. Huang, P. Ma, Y. Jiang, X. Liu, S. Tao, Y. Sun, D. Song and X. Wang, J. Mater. Chem. B, 2019, 7, 1284 RSC.
- G. R. Casey and C. I. Stains, Chem.–Eur. J., 2018, 24, 7810 CrossRef CAS PubMed.
- Z. Lu, J. Wu, W. Liu, G. Zhang and P. Wang, RSC Adv., 2016, 6, 32046 RSC.
- F. Wang, X. Hu, J. Hu, Q. Peng, B. Zheng, J. Du and D. Xiao, J. Mater. Chem. B, 2018, 6, 6008 RSC.
- W. Zhang, H. Yang, N. Li and N. Zhao, RSC Adv., 2018, 8, 14995 RSC.
- D. Li, Y. Jiang, S. Chen, Q. Zhao, Y. Zhang, W. Wang, Y. Sun, P. Ma, D. Song and X. Wang, Sens. Actuators, B, 2020, 307, 127589 CrossRef.
- Q. Zuo, Y. Chen, Z.-P. Chen and R.-Q. Yu, Talanta, 2020, 209, 120528 CrossRef CAS PubMed.
- R. T. K. Kwok, C. W. T. Leung, J. W. Y. Lam and B. Z. Tang, Chem. Soc. Rev., 2015, 44, 4228 RSC.
- J. Mei, N. L. C. Leung, R. T. K. Kwok, J. W. Y. Lam and B. Z. Tang, Chem. Rev., 2015, 115, 11718 CrossRef CAS PubMed.
- M. Gao and B. Z. Tang, ACS Sens., 2017, 2, 1382 CrossRef CAS PubMed.
- Y. Dong, W. Wang, C. Zhong, J. Shi, B. Tong, X. Feng, J. Zhi and Y. Dong, Tetrahedron Lett., 2014, 55, 1496 CrossRef CAS.
- D. D. La, S. V. Bhosale, L. A. Jones and S. V. Bhosale, ACS Appl. Mater. Interfaces, 2018, 10, 12189 CrossRef CAS PubMed.
- D. Ding, K. Li, B. Liu and B. Z. Tang, Acc. Chem. Res., 2013, 46, 2441 CrossRef CAS PubMed.
- Y. Li, H. Zhong, Y. Huang and R. Zhao, Molecules, 2019, 24, 4593 CrossRef CAS.
- Y. Bae, S. Fukushima, A. Harada and K. Kataoka, Angew. Chem., Int. Ed., 2003, 42, 4640 CrossRef CAS PubMed.
- S. W. Lee, S. Y. Lee and S. H. Lee, Tetrahedron Lett., 2019, 60, 151048 CrossRef.
- M. Grzelczak, L. M. L. Marzan and R. Klajn, Chem. Soc. Rev., 2019, 48, 1342 RSC.
- S. Jung, T. E. Park and S. H. Lee, Tetrahedron Lett., 2019, 60, 2022 CrossRef CAS.
- X. Xue, J. Xu, P. C. Wang and X.-J. Liang, J. Mater. Chem. C, 2016, 4, 2719 RSC.
- T. E. Park and S. H. Lee, Dalton Trans., 2020, 49, 4660 RSC.
- Y. J. Jang, B. Kim, E. Roh, H. Kim and S. H. Lee, Sci. Rep., 2020, 10, 1 CrossRef.
- F.-Y. Cao, Y. Long, S.-B. Wang, B. Li, J.-X. Fan, X. Zeng and X.-Z. Zhang, J. Mater. Chem. B, 2016, 4, 4534 RSC.
- X.-F. Duan, J. Zeng, J.-W. Lu and Z.-B. Zhang, J. Org. Chem., 2006, 71, 9873 CrossRef PubMed.
- A. Bootz, V. Vogel, D. Schubert and J. Kreuter, Eur. J. Pharm. Biopharm., 2004, 57, 369 CrossRef PubMed.
- E. D. H. Mansfield, Y. Pandya, E. A. Mun, S. E. Rogers, I. Abutbul-Ionita, D. Danino, A. C. Williams and V. V. Khutoryanskiy, RSC Adv., 2018, 8, 6471 RSC.
- S. Song, H.-F. Zheng, D.-M. Li, J.-H. Wang, H.-T. Feng, Z.-H. Zhu, Y.-C. Chen and Y.-S. Zheng, Org. Lett., 2014, 16, 2170 CrossRef CAS PubMed.
- Analytical detection limit (ADL) was calculated using the equation
 , where δc=0 is the standard deviation of the blank and m is the slope of the calibration plot.
 - X. Gu, G. Zhang, Z. Wang, W. Liu, L. Xiao and D. Zhang, Analyst, 2013, 138, 2427 RSC.
- K. Choi and A. D. Hamilton, Angew. Chem., Int. Ed., 2001, 40, 3912 CrossRef CAS PubMed.
- M. P. Robin, S. A. M. Osborne, Z. Pikramenou, J. E. Raymond and R. K. O'Reilly, Macromolecules, 2016, 49, 653 CrossRef CAS PubMed.
- G. Li, H. Fu, X. Chen, P. Gong, G. Chen, L. Xia, H. Wang, J. You and Y. Wu, Anal. Chem., 2016, 88, 2720 CrossRef CAS PubMed.
- V. Kumar and K. D. Gill, in Basic Concepts in Clinical Biochemistry: A Practical Guide, Springer, 2018, pp. 107–109 Search PubMed.
- J. Folch, M. Lees and G. M. S. Stanley, J. Biol. Chem., 1957, 467, 226 Search PubMed.
- T. P. L. Ferraz, M. C. Fiuza, M. L. A. D. Santos, L. P. D. Carvalho and N. M. Soares, J. Biochem. Biophys. Methods, 2004, 58, 187 CrossRef CAS PubMed.
Footnotes |
| † Electronic supplementary information (ESI) available. See DOI: 10.1039/d0ra03584j |
| ‡ The authors equally contributed to this work. |
| This journal is © The Royal Society of Chemistry 2020 |

