 Open Access Article
Computational searches for crystal structures of dioxides of group 14 elements (CO2, SiO2, GeO2) under ultrahigh pressure†
Hitoshi Nabataa,
Makito Takagib,
Kenichiro Saita *c and
Satoshi Maeda
 *cdef
*cdef
aGraduate School of Chemical Sciences and Engineering, Hokkaido University, Sapporo 060-8628, Japan
bGraduate School of Nanobioscience, Yokohama City University, Yokohama, Kanagawa 236-0027, Japan
cDepartment of Chemistry, Faculty of Science, Hokkaido University, Sapporo 060-0810, Japan. E-mail: ksaita@sci.hokudai.ac.jp; smaeda@eis.hokudai.ac.jp
dInstitute for Chemical Reaction Design and Discovery (WPI-ICReDD), Hokkaido University, Sapporo 001-0021, Japan
eJST, ERATO Maeda Artificial Intelligence for Chemical Reaction Design and Discovery Project, Sapporo 060-0810, Japan
fResearch and Services Division of Materials Data and Integrated System (MaDIS), National Institute for Materials Science (NIMS), Tsukuba 305-0044, Japan
First published on 9th June 2020
Abstract
In this study, we focused on the effect of pressure on the crystal structures of dioxides of group 14 elements, i.e. SiO2, GeO2, and CO2. Systematic searches for their crystal structures using the artificial force induced reaction method generated 219 and 147, 102 and 63, and 148 and 76 structures for SiO2, GeO2, and CO2, respectively, at 1 and 106 atm. At 1 atm, cristobalite-like, quartz, anatase-like, and stishovite were stable structures for SiO2 and GeO2. At 106 atm, structures of stishovite and CaCl2 type were relatively stable for SiO2 and GeO2. At 1 atm of CO2, molecular crystals were the most stable, whereas, quartz-like and cristobalite-like structures were obtained as stable structures at 106 atm. We discuss these pressure dependent structural variations systematically using the obtained structural dataset.
Introduction
The pressure inside the Earth ranges from 1 atm (≈100 kPa) to 3.6 million atm (≈360 GPa).1 Unusual crystal structures, which cannot be synthesized under ambient pressure, sometimes appear in ultrahigh pressure environments, and it is interesting from chemical and geological viewpoints.Oxygen and silicon are the two most abundant elements in the Earth's crust, and silicon dioxide (also known as silica) SiO2 is the most abundant chemical composition in the crust.2 Therefore, SiO2 is an important composition in the field of mineralogy. As seen in a SiO2 phase diagram,3 SiO2 has various polymorphs, and their stabilities depend on temperature and pressure. Under normal pressure (1 atm), SiO2 crystals tend to form a three-dimensional network structure composed of tetrahedral SiO4 with 4-fold-coordinated Si atoms such as quartz4,5 and cristobalite.6,7 In ultrahigh pressure environments (105 to 106 atm), on the other hand, the crystal structures which contain 6-fold-coordinated Si atoms such as stishovite (rutile-type)8 and CaCl2-type9 become dominant. Furthermore, α-PbO2-type and pyrite-type SiO2 crystals appear as post-stishovite phases at pressures above 106 atm.10,11
Germanium dioxide (GeO2) is a chemical analogue of SiO2 and several polymorphs have been reported. GeO2 has similar properties to SiO2 with respect to temperature and pressure.12 At 1 atm, GeO2 can exist in a quartz-like 4-fold-coordinated structure or in a rutile-type 6-fold-coordinated structure.13 It is reported that GeO2 can form PbO2-type14 and pyrite-type15 structures under ultrahigh pressure.
It is well known that carbon dioxide (CO2) crystal exists as a molecular crystal (such as dry ice) under normal pressure. Over the past two decades, however, it has been clarified experimentally that CO2 can form non-molecular crystal structures like SiO2 crystals under ultrahigh pressure (>105 atm). Phases I (dry ice), II,16 III,17 IV,18,19 and VII20 have been reported as molecular CO2 crystal phases, while phases V (tridymite-like21 and cristobalite-like22), VI,23 and VIII24 have been reported as non-molecular CO2 crystal phases.
Previous theoretical studies have successfully reproduced properties of known crystal phases and proposed unidentified crystal structures of AO2 (A = C, Si, or Ge) under ultrahigh pressure.25–44 These theoretical predictions were made by stochastic trials including genetic algorithms, or by geometry optimization or MD simulation starting from a known structure or an intuitive initial guess. Since a stable structure in an ultrahigh pressure environment might be completely different from that under normal pressure, especially in the case of CO2, it is not easy to comprehensively collect all polymorphs of AO2. Therefore, to this system, an application of a systematic search method which can obtain fully unbiased results without relying on any previous knowledge or human intuition would be beneficial.
We have developed a single component artificial force induced reaction (SC-AFIR) method as an automated reaction path search method for molecular systems.45 The SC-AFIR method computes approximate reaction paths called AFIR paths starting from a stable structure to the other stable structures systematically without needing any arbitrary input like collective variables. By applying the SC-AFIR method to newly found stable structures one after another, a so-called reaction path network on which all stable structures are linked through there interconversion pathways can be generated automatically. The SC-AFIR method is available not only in molecular systems but also in crystalline systems by adopting the periodic boundary conditions (PBC/SC-AFIR),46 where the PBC/SC-AFIR method computes AFIR paths for phase transitions between stable crystalline phases.
In this study, by using the PBC/SC-AFIR method, we theoretically explored AO2 (A = C, Si, or Ge) crystal structures at 1 and 106 atm respectively. The stable structures (crystal phases) at each pressure and their properties, as the enthalpies and volumes, were discussed. Furthermore, changes of the stability of each crystal structure depending on pressure were discussed, by performing re-optimization of the obtained structures by the systematic searches at 1, 1 × 10⁵, 3 × 10⁵, 6 × 10⁵, and 1 × 10⁶ atm. Using the resultant structural data, similarities and differences among the dioxides of group 14 elements were discussed. Moreover, through these applications, the performance of the PBC/SC-AFIR method was demonstrated.
Methods
The density functional theory (DFT) calculation with the Perdew–Burke–Ernzerhof (PBE) functional and the DZP basis set implemented in SIESTA 4.0 program47 was used for calculating the potential energy and its gradient. The pseudopotentials were prepared using the parameters in the GGA pseudopotential database;48 the non-relativistic pseudopotential which includes the nonlinear core correction (NLCC) was applied to a silicon atom, but the nonrelativistic pseudopotential without NLCC was applied to a carbon or an oxygen atom. For germanium atom, the relativistic pseudopotential with NLCC was used. The Fermi–Dirac function was used for the electron smearing (the Gaussian smearing), and the electronic temperature was set to 300 K. The spin state was not fixed. The Monkhorst–Pack grid, which decides k-point sampling, and the mesh cutoff were set to 2 × 2 × 2 and 100 Ry., respectively.The systematic explorations of the crystal structures were performed by using the PBC/SC-AFIR method46 implemented in the GRRM program.49 In the method, the artificial force, which was defined by the AFIR function, was added between two systematically chosen fragments in the given system, and then structural deformations were induced systematically. The AFIR method is available not only in isolated molecular systems but also periodic systems. Here, the SC-AFIR algorithm was used, and the model collision energy parameter γ was set to 1000.0 kJ mol−1. The all atoms in the unit cell were chosen as the target in the SC-AFIR algorithm. No symmetrical restrictions were considered. In this study, compositions A2O4 and A3O6 (A = C, Si, or Ge) in a unit cell were taken into account. Eight initial structures were randomly generated for each composition. A search was terminated if the last 3n AFIR paths did not update the set of the lowest n equilibrium (EQ) structures (n is the number of atoms in the unit cell). All obtained EQs in the A2O4 and A3O6 unit cells were extended to generate structures in the A6O12 unit cell and reoptimized in the A6O12 unit cell to obtain the final dataset in the A6O12 unit cell. Therefore, all structures presented below are optimized structures in the A6O12 unit cell. To consider pressure effect, the structure searches and further geometry optimizations were performed on the function of the enthalpy E + PV rather than the electronic (potential) energy E, where P is the pressure and V is the volume.50 In this study, 1 or 106 atm was applied as the constant values of P in the structure searches. All obtained structures are available in the ESI.†
Results and discussion
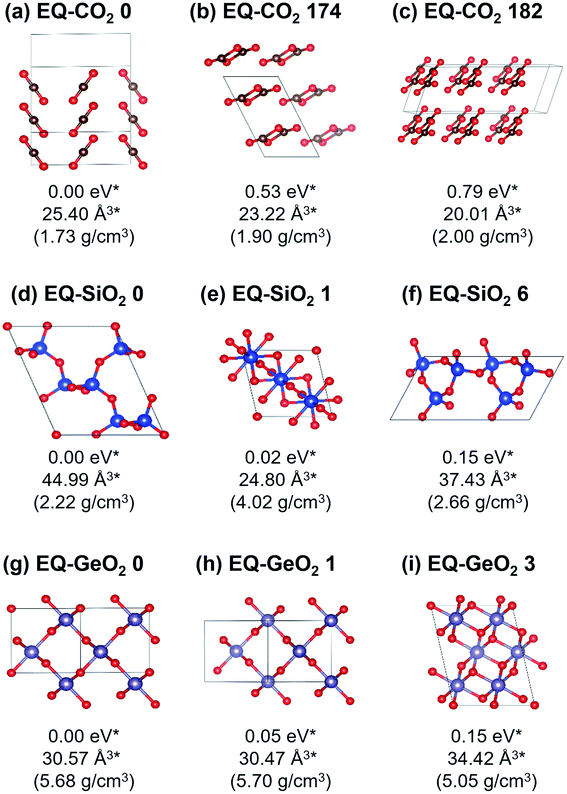
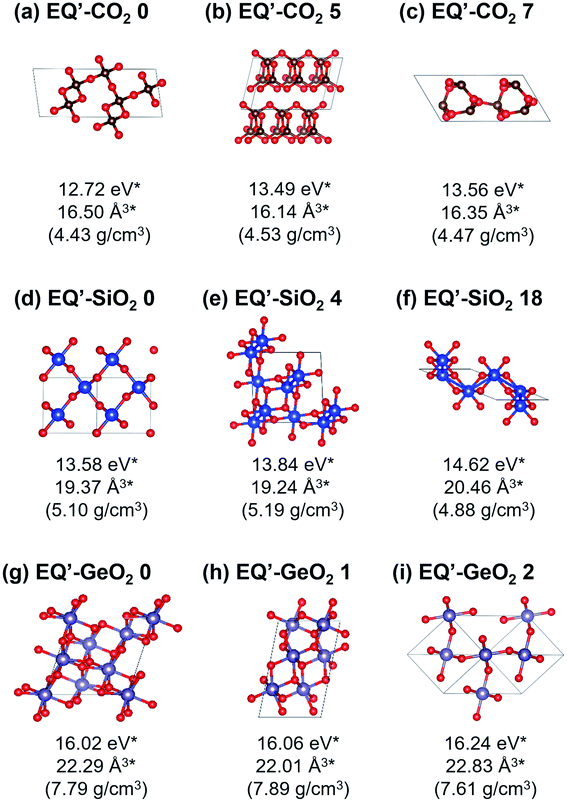
At 1 atm, 219, 102, and 148 equilibrium (EQ) structures were obtained by our systematic searches for CO2, SiO2, and GeO2, respectively. Fig. 1 shows relatively stable structures among the obtained EQ structures at 1 atm. The EQ structures were labeled in ascending order (from zero) of the enthalpy, and the value of enthalpy is the relative to the lowest enthalpy structure in each composition. The lowest enthalpy structure of CO2 (EQ-CO2 0, Fig. 1(a)), which was obtained under 1 atm, was a molecular crystal known as phase III. Many patterns with different orientations and densities were obtained, and they were lying at the low enthalpy region (∼0.23 eV/CO2). Molecular crystal structures containing 1,3-dioxetanedione and 1,2-dioxetanedione were also found (EQ-CO2 174, Fig. 1(b)). Linear CO2 chain crystal structures were appeared as the non-molecular crystals of CO2, even under 1 atm (EQ-CO2 182, Fig. 1(c)). In the case of SiO2, the lowest enthalpy structure was a cristobalite-like structure, which had a tetrahedral SiO4 network (EQ-SiO2 0, Fig. 1(d)). The second lowest enthalpy structure was rutile-type structure, stishovite (EQ-SiO2 1, Fig. 1(e)). Stishovite has an octahedral SiO6 network. The structure of quartz was obtained as the third most stable structure (EQ-SiO2 6, Fig. 1(f)). Note that the structures, such as α-cristobalite, tridymite, and coesite, could not be described by the small unit cells adopted during the searches. In the case of GeO2, the lowest enthalpy structure was a six-coordinated CaCl2-type structure (EQ-GeO2 0, Fig. 1(g)), and the second lowest enthalpy structure was rutile-type structure (EQ-GeO2 1, Fig. 1(h)). At 1 atm, their enthalpies were almost same. The anatase-type structure (EQ-GeO2 3, Fig. 1(i)) was obtained as the third lowest enthalpy structure. Four-coordinated crystal structures such as quartz-like and cristobalite-like structures were also found, however, the stability of these structures was different from in the case of SiO2. At 1 atm, the relative enthalpy of 4-fold-coordinated GeO2 crystal structures was higher than 6-fold structures.Under 106 atm, 147, 63, and 76 EQ structures were obtained for CO2, SiO2, and GeO2 respectively. Relatively stable structures among the obtained EQ structures at 106 atm are shown in Fig. 2. The EQs obtained at 106 atm are labeled with a prime symbol. The enthalpy values are relative to the most stable EQ of each composition at 106 atm. All structures obtained at 106 atm had smaller volumes per unit composition, higher densities, and higher enthalpies than those obtained at 1 atm, because 106 atm of pressure corresponds to 0.6325 eV Å−3. This means if EQ-CO2 0 (25.40 Å3/CO2), which is stable at 1 atm, was put under 106 atm, then the PV term of the enthalpy increased by 16.07 eV/CO2. The larger volume unit cell, the PV term of the enthalpy becomes much larger. For CO2, the lowest enthalpy EQ structure under 106 atm was a 4-fold-coordinated cristobalite-like structure (EQ′-CO2 0, Fig. 2(a)). This structure was similar to the most stable EQ structure in SiO2 at 1 atm, but its density is higher than the case of SiO2. The second lowest enthalpy structure was a layered CO2 structure with 4-coordinated CO4 (EQ′-CO2 5, Fig. 2(b)). Such layered structures were also observed in SiO2 and GeO2 at 1 atm. The quartz-like structure was also obtained as the third lowest enthalpy structure (EQ′-CO2 7, Fig. 2(c)). The lowest enthalpy structure of SiO2 under 106 atm was a 6-fold-coordinated CaCl2-type structure (EQ′-SiO2 0, Fig. 2(d)). The α-PbO2-like structure (EQ′-SiO2 4, Fig. 2(e)) was also stable. The anatase-type structure was obtained, but it had relatively high enthalpy (EQ′-SiO2 18, Fig. 2(f)). In contrast to the case of 1 atm, the stishovite structure was not found in 6-fold-coordinated structures, and any 4-fold-coordinated structures as well. The lowest enthalpy EQ structure in GeO2 under 106 atm was a 7-fold-coordinated structure which has distorted augmented triangular prism structure (EQ′-GeO2 0, Fig. 2(g)). The 6-fold pyrite-like (EQ′-GeO2 1, Fig. 2(h)) and CaCl2-type (EQ′-GeO2 2, Fig. 2(i)) structures were appeared as the second and the third lowest enthalpy structures at 106 atm. The α-PbO2-like structure (16.43 eV/GeO2) was also stable (EQ′-GeO2 4).
For the group 14 dioxide systems, many crystalline phases have been reported both experimentally and theoretically.4–32 Previous theoretical studies have been done by various ways including applications of sophisticated stochastic methods such as USPEX (Universal Structure Predictor: Evolutionary Xtallography),42 CALYPSO (Crystal structure AnaLYsis by Particle Swarm Optimization),43 and SSW (Stochastic Surface Walking).41 To the best of our knowledge, our systematic structure searches generated all known crystal structure types at ∼1 or ∼106 atm that can be expressed within the A2O4 and A3O6 unit cells (A = C, Si, or Ge). Structures missed by our searches can be categorized into two types: (A) structures that cannot be expressed within the A2O4 and A3O6 unit cells and (B) structures that are stable only under higher pressure than 106 atm. As already noted above, some stable SiO2 crystals such as α-cristobalite, tridymite, and coesite fall into the category (A). The exact α-PbO2-type10 and pyrite-type11 structures also fall into the category (A). The post-pyrite phases such as cotunnite-type and Fe2P-type reported for SiO2 (ref. 35 and 39) and 6-fold-coordinated crystal structures of CO2 (ref. 30) discovered at higher pressure conditions fall into the category (B). This does not mean the PBC/SC-AFIR method cannot find these structures with any computational setting. These were missed just because of the computational settings, i.e. the unit cell sizes and the pressure, adopted in this study. It should also be noted that our searches yielded a number of unreported metastable structures for each composition. Among structures described above, the crystal structures of CO2 containing 1,3-dioxetanedione and 1,2-dioxetanedione found at 1 atm and 4-fold-coordinated and 6-fold-coordinated layered structures of the three compositions are those newly found by our searches. Also, the 7-fold-coordinated structure of GeO2 taking distorted augmented triangular prism frame found at 106 atm is a newly found relatively stable structure. These results demonstrated usefulness of the PBC/SC-AFIR method in exploration of unknown crystal structures under an arbitrary pressure.
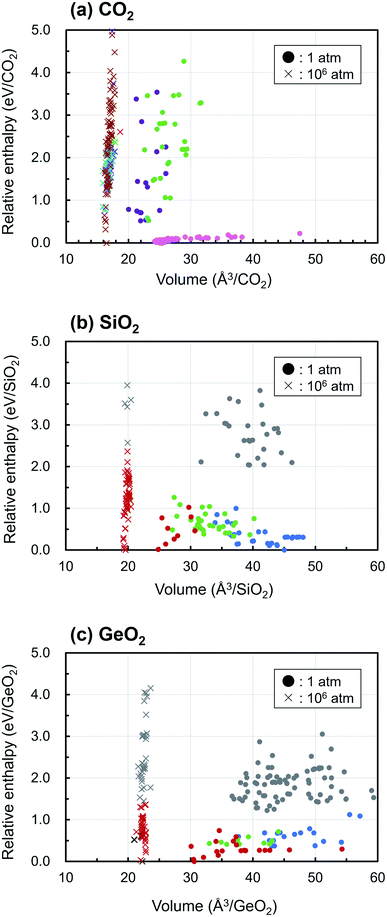
Fig. 3 displays the enthalpy-volume distributions of the obtained EQ structures, where the EQ structures obtained under 1 and 106 atm were plotted with circles and with cross marks, respectively. The values of enthalpy are relative to that of the lowest EQ structure at each pressure. In Figure 3(a), 173 of 219 EQ structures were classified as the CO2 molecular crystal taking different molecular arrangements, which was represented by “dry ice” and they were lying at the low enthalpy region (∼0.23 eV/CO2). In the region of smaller volume and higher enthalpy, other dioxetanedione molecule crystal and linear CO2 chain crystal structures distribute at 1 atm. Under 106 atm, only one EQ structure, which was located at 2.61 eV/CO2, corresponded to the molecular crystal, and it contained linear CO2 molecules. Most of EQ structures have dense 3D network structure at 106 atm, and molecular crystals become thermodynamically unfavorable. SiO2 crystals acquire 4-fold-coordinated three-dimensional network structures and 6-fold-coordinated rutile-type structures under 1 atm, and they show wide distribution of volume. Under 1 atm, various densities of SiO2 crystal structures exist in thermodynamically stable region. On the other hand, at 106 atm, only post-stishovite phases, 6-fold-coordinated CaCl2-type, and α-PbO2-like structures are relatively stable. These structures are obtained in GeO2 at 1 atm. Although GeO2 shows similar behavior to SiO2, the relative enthalpy of 4-fold-coordinated structure is higher than that of 6-fold-coordinated structure at 1 atm. Under 106 atm, 7-fold-coordinated structures appear and high dense 6-fold-coordinated structures such as pyrite-like, CaCl2-type, and α-PbO2-like are relatively stable.
For all compositions, the ultrahigh pressure makes the volume of crystal structure to small, and this causes reducing the number of EQ structures and the volume variation of structures. As a result, the density of crystal increases and the more highly coordinated structures become stable. For example, in the case of CO2, the EQ structures which were obtained at 106 atm were located between 12.7–18 eV/CO2 region relative to at 1 atm, because 106 atm of pressure corresponds to 0.6325 eV Å−3, as described above. The relative enthalpy of the most stable structure at 106 atm is higher by 12.72 eV/CO2, 13.58 eV/SiO2, 16.02 eV/GeO2 than at 1 atm, respectively. So that the lower density structure such as molecular crystal almost disappeared at 106 atm.
In addition, the changes of the relative enthalpy from 1 atm to 106 atm were investigated by further structural optimization calculations with different pressures for the EQ structures obtained by the searches. The re-optimizations of the EQ structures obtained under 1 atm were performed by gradually increasing the pressure to 1 × 10⁵, 3 × 10⁵, 6 × 10⁵, and, 1 × 10⁶ atm, while the re-optimizations of the EQ structures obtained under 106 atm were carried out by decreasing the pressure vice versa. The newly obtained lists of EQ structures at each pressure were merged. The trends in the relative stability of structure for pressure in the range of 1 to 106 atm are shown in Fig. 4. For better understanding of these trends, the changes of the relative enthalpy relative to the most stable EQ at each pressure are also shown in Fig. 5. In the case of CO2, the dry ice crystal has the most stable structure at 1 atm, but at 3 × 10⁵ atm, the relative enthalpy is similar to that of linear CO2 chain crystal, and at 6 × 10⁵ atm, the linear CO2 chain crystal has the most stable structure. At 1 × 10⁶ atm, both molecular and linear CO2 crystals become unstable, and the structure with 3D network structures become relatively stable. Such plots of relative enthalpy change show the transition of stable crystal phases. For SiO2, at 1 atm, 4-fold-coordinated crystal structures such as cristobalite-like are relatively stable, and the stishovite is also stable. It changes to the denser CaCl2 structure as the pressure increases, and the CaCl2-type structure was stable even at 106 atm. In the 6-fold-coordinated crystal phases, the anatase-type crystal, which has a sparse three-dimensional structure, becomes relatively unstable with increasing pressure, and the dense pyrite-like structure becomes relatively stable. The behavior of 6-fold-coordinated GeO2 crystals is similar to that of SiO2. At low pressure, the CaCl2-type structure is relatively stable, as is the case with SiO2, but at high pressure, the pyrite-type structure and the 7-fold-coordinated structure are relatively stable.
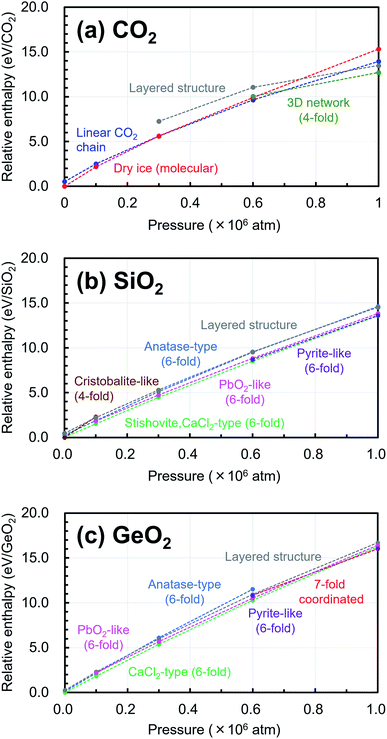 | ||
| Fig. 4 Trends in the relative stability of structure for pressure in the range of 1 atm to 106 atm relative to the most stable structure under 1 atm are shown in (a) CO2, (b) SiO2, (c) GeO2. | ||
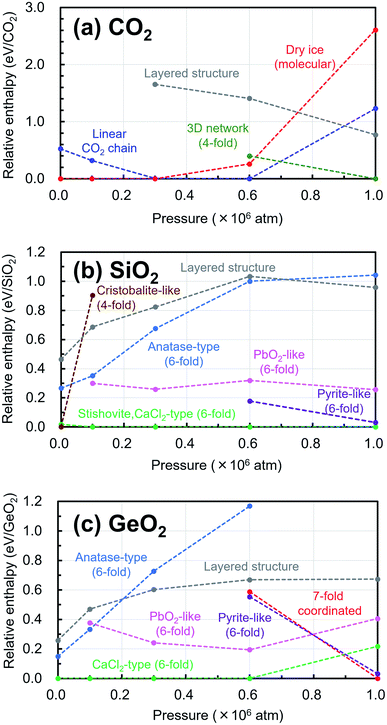 | ||
| Fig. 5 Trends in the relative enthalpy values relative to the most stable structure under each pressure are shown in (a) CO2, (b) SiO2, (c) GeO2. | ||
Under ultrahigh pressure, CO2 has crystal phases similar to SiO2 under atmospheric pressure. Also, SiO2 in ultrahigh pressure has crystal phases similar to GeO2 under atmospheric pressure. This means that crystals of dioxide of a group 14 element exhibit similar properties to those of the next heavier element among the same group by applying ultrahigh pressure. Because a heavier element has a larger atomic radius than a lighter element, it can form structures of higher coordination. Under high pressure, more stable (lower enthalpy) structures should have smaller volume, and the effect of the atomic radius is strongly reflected in the trends of relative stability of crystal structures.
Finally, we summarize limitations of the present study. One is the A2O4 and A3O6 unit cells adopted in the automated searches. Due to the small unit cells, some known crystal phases that need a larger unit cell are excluded from the obtained crystal structure data. Second is the lack of the thermal effects on the stability. Third is computational errors arisen from computational parameters such as DFT functional and orbital basis functions adopted in this study. Due to the second and third limitations, the stability order among crystal structures discussed above may differ from those by the more accurate calculations taking account of the thermal effects. However, for all the in total >1000 crystal structures obtained over five different pressure conditions, it will take huge computational costs to perform accurate calculations taking account of the thermal effects. Although such calculations may be done for a few specific structures, it is beyond the scope of this paper which aimed to survey the overall trends in structural changes depending on pressure in different group 14 dioxide crystals.
Conclusions
In this study, unbiased searches for crystal structures of dioxides of group 14 elements, SiO2, GeO2, and CO2 were performed using the PBC/SC-AFIR method. A number of crystal structures including known structures have been obtained by our systematic searches. Moreover, some unreported structural phases were predicted as output of the present searches. These results encourage further applications of the PBC/SC-AFIR method to similar targets.Using the obtained structural data list, we focused on the effect of pressure on the crystal structures. The results of crystal structural searches under the ambient pressure and ultrahigh pressure were successfully compared by considering the enthalpy. Comparisons were also made among the three dioxides, and structural similarity in crystal structures at different pressures was discussed. These results suggest that crystals of dioxide of a group 14 element shows similar properties to those of the next heavier element among the same group by applying ultrahigh pressure. This means that under ultrahigh pressure, CO2 has crystal phases similar to SiO2 under atmospheric pressure, and under ultrahigh pressure, SiO2 has crystal phases similar to GeO2 under atmospheric pressure.
Conflicts of interest
The authors declare no competing financial interests.Acknowledgements
Most parts of the computations were performed using Research Center for Computational Science (RCCS), Okazaki, Japan. MT was supported by JSPS Research Fellowships for Young Scientists (PD). This work was supported by JST-CREST (No. JPMJCR14L5), JST-ERATO (No. JPMJER1903), and JSPS-WPI.Notes and references
- A. M. Dziewonski and D. L. Anderson, Phys. Earth Planet. Inter., 1981, 25, 297–356, DOI:10.1016/0031-9201(81)90046-7
.
- S. R. Taylor and S. M. McLennan, Philos. Trans. R. Soc., A, 1981, 301, 381–399, DOI:10.1098/rsta.1981.0119
.
- M. Kayama, H. Nagaoka and T. Niihara, Minerals, 2018, 8, 267, DOI:10.3390/min8070267
.
- K. J. Kingma, H.-K. Mao and R. J. Hemley, High Pres. Res., 1996, 14, 363–374, DOI:10.1080/08957959608201422
.
- R. J. Hemley, A. P. Jephcoat, H. K. Mao, L. C. Ming and M. H. Manghnani, Nature, 1988, 334, 52–54, DOI:10.1038/334052a0
.
- Y. Tsuchida and T. Yagi, Nature, 1990, 347, 267–269, DOI:10.1038/347267a0
.
- D. M. Hatch and S. Ghose, Phys. Chem. Miner., 1991, 17, 554–562, DOI:10.1007/BF00202234
.
- E. C. T. Chao, J. J. Fahey, J. Littler and D. J. Milton, J. Geophys. Res., 1962, 67, 419–421, DOI:10.1029/JZ067i001p00419
.
- K. J. Kingma, R. E. Cohen, R. J. Hemley and H.-K. Mao, Nature, 1995, 374, 243–245, DOI:10.1038/374243a0
.
- L. S. Dubrovinsky, N. A. Dubrovinskaia, V. Prakapenka, F. Seifert, F. Langenhorst, V. Dmitriev, H.-P. Weber and T. Le Bihan, Phys. Earth Planet. Inter., 2004, 143–144, 231–240, DOI:10.1016/j.pepi.2003.06.006
.
- Y. Kuwayama, K. Hirose, N. Sata and Y. Ohishi, Phys. Chem. Miner., 2011, 38, 591–597, DOI:10.1007/s00269-011-0431-6
.
- J. P. Itie, A. Polian, G. Calas, J. Petiau, A. Fontaine and H. Tolentino, Phys. Rev. Lett., 1989, 63, 398–401, DOI:10.1103/PhysRevLett.63.398
.
- A. W. Laubengayer and D. S. Morton, J. Am. Chem. Soc., 1932, 54, 2303–2320, DOI:10.1021/ja01345a019
.
- V. B. Prakapenka, L. S. Dubrovinsky, G. Shen, M. L. Rivers, S. R. Sutton, V. Dmitriev, H.-P. Weber and T. Le Bihan, Phys. Rev. B: Condens. Matter Mater. Phys., 2003, 67, 132101/1–132101/4, DOI:10.1103/PhysRevB.67.132101
.
- S. Ono, T. Tsuchiya, K. Hirose and Y. Ohishi, Phys. Rev. B: Condens. Matter Mater. Phys., 2003, 68, 134108/1–134108/7, DOI:10.1103/PhysRevB.68.134108
.
- C. S. Yoo, H. Kohlmann, H. Cynn, M. F. Nicol, V. Iota and T. Le Bihan, Phys. Rev. B: Condens. Matter Mater. Phys., 2002, 65, 104103/1–104103/6, DOI:10.1103/PhysRevB.65.104103
.
- R. C. Hanson, J. Phys. Chem., 1985, 89, 4499–4501, DOI:10.1021/j100267a019
.
- J.-H. Park, C. S. Yoo, V. Iota, H. Cynn, M. F. Nicol and T. Le Bihan, Phys. Rev. B: Condens. Matter Mater. Phys., 2003, 68, 014107/1–014107/9, DOI:10.1103/PhysRevB.68.014107
.
- F. Datchi, V. M. Giordano, P. Munsch and A. M. Saitta, Phys. Rev. Lett., 2009, 103, 185701/1–185701/4, DOI:10.1103/PhysRevLett.103.185701
.
- W. Sontising, Y. N. Heit, J. L. McKinley and G. J. O. Beran, Chem. Sci., 2017, 8, 7374–7382, 10.1039/C7SC03267F
.
- C. S. Yoo, H. Cynn, F. Gygi, G. Galli, V. Iota, M. Nicol, S. Carlson, D. Häusermann and C. Mailhiot, Phys. Rev. Lett., 1999, 83, 5527–5530, DOI:10.1103/PhysRevLett.83.5527
.
- M. Santoro, F. A. Gorelli, R. Bini, J. Haines, O. Cambon, C. Levelut, J. A. Montoya and S. Scandolo, Proc. Natl. Acad. Sci. U. S. A., 2012, 109, 5176–5179, DOI:10.1073/pnas.1118791109
.
- V. Iota, C. S. Yoo, J. H. Klepeis, Z. Jenei, W. Evans and H. Cynn, Nat. Mater., 2007, 6, 34–38, DOI:10.1038/nmat1800
.
- A. Sengupta and C.-S. Yoo, Phys. Rev. B: Condens. Matter Mater. Phys., 2009, 80, 014118/1–014118/6, DOI:10.1103/PhysRevB.80.014118
.
- B. Holm, R. Ahuja, A. Belonoshko and B. Johansson, Phys. Rev. Lett., 2000, 85, 1258–1261, DOI:10.1103/PhysRevLett.85.1258
.
- I. Gimondi and M. Salvalaglio, J. Chem. Phys., 2017, 147, 114502/1–114502/11, DOI:10.1063/1.4993701
.
- Y. Han, J. Liu, L. Huang, X. He and J. Li, npj Quantum Mater., 2019, 4, 10/1–10/7, DOI:10.1038/s41535-019-0149-0
.
- J.-H. Parq, S. K. Lee, S.-M. Lee and J. Yu, J. Phys. Chem. C, 2016, 120, 23152–23164, DOI:10.1021/acs.jpcc.6b07833
.
- J. A. Montoya, R. Rousseau, M. Santoro, F. A. Gorelli and S. Scandolo, Phys. Rev. Lett., 2008, 100, 163002, DOI:10.1103/PhysRevLett.100.163002
.
- C. Lu, M. Miao and Y. Ma, J. Am. Chem. Soc., 2013, 135, 14167–14171, DOI:10.1021/ja404854x
.
- S. A. Bonev, F. Gygi, T. Ogitsu and G. Galli, Phys. Rev. Lett., 2003, 91, 065501/1–065501/4, DOI:10.1103/PhysRevLett.91.065501
.
- X. Yong, H. Liu, M. Wu, Y. Yao, J. S. Tse, R. Dias and C. S. Yoo, Proc. Natl. Acad. Sci. U. S. A., 2016, 113, 11110–11115, DOI:10.1073/pnas.1601254113
.
- Q. Y. Hu, J.-F. Shu, A. Cadien, Y. Meng, W. G. Yang, H. W. Sheng and H.-K. Mao, Nat. Commun., 2015, 6, 6630, DOI:10.1038/ncomms7630
.
- C. Rajappa, S. B. Sringeri, Y. Subramanian and J. Gopalakrishnan, J. Chem. Phys., 2014, 140, 244512/1–244512/11, DOI:10.1063/1.4885141
.
- A. Metsue and T. Tsuchiya, Phys. Chem. Miner., 2012, 39, 177–187, DOI:10.1007/s00269-011-0473-9
.
- D. M. Teter, R. J. Hemley, G. Kresse and J. Hafner, Phys. Rev. Lett., 1998, 80, 2145–2148, DOI:10.1103/PhysRevLett.80.2145
.
- W. Liu, X. Wu, Y. Liang, C. Liu, C. R. Miranda and S. Scandolo, Proc. Natl. Acad. Sci. U. S. A., 2017, 114, 12894–12899, DOI:10.1073/pnas.1710651114
.
- Z. Łodziana, K. Parlinski and J. Hafner, Phys. Rev. B: Condens. Matter Mater. Phys., 2001, 63, 134106/1–134106/7, DOI:10.1103/PhysRevB.63.134106
.
- S. Wu, K. Umemoto, M. Ji, C.-Z. Wang, K.-M. Ho and R. M. Wentzcovitch, Phys. Rev. B: Condens. Matter Mater. Phys., 2011, 83, 184102/1–184102/4, DOI:10.1103/PhysRevB.83.184102
.
- X.-J. Zhang, C. Shang and Z.-P. Liu, Phys. Chem. Chem. Phys., 2017, 19, 4725–4733, 10.1039/c6cp06895b
.
- C. Shang, X.-J. Zhang and Z.-P. Liu, Phys. Chem. Chem. Phys., 2014, 16, 17845–17856, 10.1039/C4CP01485E
.
- A. R. Oganov and C. W. Glass, J. Chem. Phys., 2006, 124, 244704/1–244704/15, DOI:10.1063/1.2210932
.
- Y. Wang, J. Lv, L. Zhu and Y. Ma, Phys. Rev. B: Condens. Matter Mater. Phys., 2010, 82, 094116/1–094116/8, DOI:10.1103/PhysRevB.82.094116
.
- E. Zurek and W. Grochala, Phys. Chem. Chem. Phys., 2015, 17, 2917–2934, 10.1039/C4CP04445B
.
- S. Maeda, Y. Harabuchi, M. Takagi, K. Saita, K. Suzuki, T. Ichino, Y. Sumiya, K. Sugiyama and Y. Ono, J. Comput. Chem., 2018, 39, 233–250, DOI:10.1002/jcc.25106
.
- M. Takagi, T. Taketsugu, H. Kino, Y. Tateyama, K. Terakura and S. Maeda, Phys. Rev. B, 2017, 95, 184110/1–184110/11, DOI:10.1103/PhysRevB.95.184110
.
- J. M. Soler, E. Artacho, J. D. Gale, A. García, J. Junquera, P. Ordejón and D. Sánchez-Portal, J. Phys.: Condens. Matter, 2002, 14, 2745–2779, DOI:10.1088/0953-8984/14/11/302
; E. Artacho, J. M. Cela, J. D. Gale, A. García, J. Junquera, R. M. Martin, P. Ordejón, D. Sánchez-Portal, J. M. Soler, SIESTA 4.0.2, The Siesta Group, 2018, https://departments.icmab.es/leem/siesta/ Search PubMed
.
- Translation of Abinit's GGA Pseudo Database to Siesta Format, https://departments.icmab.es/leem/siesta/Databases/Pseudopotentials/periodictable-gga-abinit.html Search PubMed.
- S. Maeda, K. Ohno and K. Morokuma, Phys. Chem. Chem. Phys., 2013, 15, 3683–3701, 10.1039/C3CP44063J
; S. Maeda, Y. Harabuchi, Y. Sumiya, M. Takagi, K. Suzuki, K. Sugiyama, Y. Ono, M. Hatanaka, Y. Osada, T. Taketsugu, K. Morokuma and K. Ohno, GRRM (a developmental version), Hokkaido University, 2019 Search PubMed
.
- M. Takagi and S. Maeda, ChemRxiv, 2020 DOI:10.26434/chemrxiv.12115581.v
.
Footnote |
| † Electronic supplementary information (ESI) available: All obtained structures of the A6O12 unit cell in the Cartesian representation. See DOI: 10.1039/d0ra03359f |
| This journal is © The Royal Society of Chemistry 2020 |

