 Open Access Article
Highly selective and sensitive simultaneous nanomolar detection of Cs(I) and Al(III) ions using tripodal organic nanoparticles in aqueous media: the effect of the urea backbone on chemosensing†
Jayanti Mishraab,
Manpreet Kaurc,
Navneet Kaur *c and
Ashok K. Ganguli
 *d
*d
aCentre for Nanoscience and Nanotechnology (UIEAST), Panjab University, Chandigarh, 160014, India. E-mail: jayanti.mishra2001@gmail.com
bDepartment of Chemistry, East Point College of Engineering and Technology, Virgo Nagar Post, Avalahalli, Bengaluru, 560049, Karnataka, India
cDepartment of Chemistry, Panjab University, Chandigarh, 160014, India. E-mail: navneetkaur@pu.ac.in
dDepartment of Chemistry, Indian Institute of Technology, Hauz Khas, New Delhi, 110016, India. E-mail: ashok@chemistry.iitd.ac.in
First published on 15th June 2020
Abstract
Chemosensing plays a very important role in the detection of essential/pollutant ions in aqueous media. In this manuscript, two tripodal ligands, i.e., 1-(2-hydroxybenzyl)-3-(4-nitrophenyl)-1-phenylurea (ligand 1) and 1-(2-hydroxybenzyl)-3-(4-nitrophenyl)-1-phenylthiourea (ligand 2) have been synthesised, which differ in the linker molecule, i.e., urea and thiourea in ligand 1 and ligand 2, respectively. The ligands were characterised by NMR, IR and mass spectroscopic techniques. Ligands 1 and 2 (2 mM) were further employed for the generation of their organic nanoparticles (ONPs) (0.01 mM) of size 20–25 nm and 30–35 nm, respectively, by the reprecipitation method. The chemosensing properties of 1-ONP and 2-ONP solutions were investigated. 1-ONP showed simultaneous recognition behaviour towards Cs(I) and Al(III) with the limits of detection of ∼220 and ∼377 nM, respectively, in an aqueous medium, while 2-ONP did not show any recognition behaviour towards any ion.
Introduction
The qualitative and quantitative detection of metal ions, irrespective of whether they have a positive or negative impact, is very crucial for life on the Earth. If the presence of essential metal ions is below the required limit, the deficiency will cause malnutrition. On the other hand, if such metal ions are more than required, the excess will cause abnormalities as well. For example, copper is very important for the lives of plants and animals because it is a part of several vital enzymes and proteins like cytochrome oxidase, ceruloplasmin, monoamine oxidase, and tyrosinase.1 On the other hand, a genetic disorder, Wilson's disease, causes the excess accumulation of copper in the body, further causing hepatic and neurological deficits like dystonia and Parkinsonism.2 The excess of one metal ion induces the irregularity and absorption of other metal ions in plants and animals.3 Similarly, if harmful or heavy metal ions exceed the limit, it would create danger for terrestrial and aquatic life by posing a threat to the functioning of enzymes. Heavy metals like Cd, Hg, and Pb can displace the required metals in the enzymes, resulting in their denaturing.4 This manuscript discusses the synthesis of two new tripodal organic ligands (1 and 2), the development of their nanoparticles (1-ONP and 2-ONP, respectively) by an economical and simple reprecipitation method, and the application of 1-ONP in the highly selective and sensitive simultaneous chemosensing of Cs(I) and Al(III) by different mechanisms in aqueous media up to the nanomolar level.A sensor responds to any physical, chemical or binary input parameter (like temperature, light, heat, motion, moisture, and pressure) and converts it into an electrical or electronic output readable signal.5–10 There are various types of sensors such as chemical, biological, potentiometric, electrochemical, chemomechanical, colourimetric, voltammetric, piezoelectric, optical (i.e., fluorescence), electromechanical, and thermal sensors.11–15 A good sensor should be cost-effective, selective, sensitive, and specific, have no interference from other ions and should be stable over a wide pH range with an accurate and precise detection of the analyte.16–19 The interaction between the host and the guest should be effective enough for successful detection with a low detection limit and response time.16–19 Fluorescence spectroscopy is a very sensitive optical transduction technique. The efficiency of a chemosensor depends upon rapid sensitisation, intensity decay lifetime, chemical and photostability, fast target delivery and suitable solubility.20,21 A typical fluorescent chemosensor bears a recognition site linked to a fluorophore that behaves as the signal source, which transforms the recognition behaviour of the sensor into a fluorescence signal.22
The excess and deficiency of metal ions are both hazardous for the environment. Na/K-dependent ATPase is activated by Cs(I) in the absence of K(I).23 Cs(I) can also be a substitute for K(I) in muscles and erythrocytes.24 Cs(I) easily binds to the anionic intracellular components of erythrocytes, resulting in a decrease in the ability to release oxygen in tissues.25 Aluminium inhibits glutamate dehydrogenase and interferes with the Kreb's cycle. Aluminium excess can also interfere with the glycolysis pathway, bioenergetic pathways in mitochondria and haematopoiesis. It can trigger Alzheimer's disease by affecting the protein folding.26 Thus, recognition of metal ions is very necessary for checking and controlling their presence and amount for the maintenance of balance.27
Many macrocyclic compounds, like naphthalene,28,29 calixarenes bearing dansyl groups,30 squaraine,31 dioxycoumarin,32 anthracene33 etc. have been reported for cesium ion detection. Kaur et al. have prepared a chemosensor for Cs(I) applicable in aqueous medium bearing mixed imine and amide linkage.34 Arvand et al. prepared zeolite-modified sol–gel electrodes for the potentiometric determination of Cs(I) ions.35
Jiang et al. synthesised a fluorescent sensor based on Schiff base directed 8-hydroxyquinoline-5-carbaldehyde for Al(III) detection with a detection limit of 10−7 M in weakly acidic aqueous medium.36 Bera et al. reported a neutral imidazol carrier i.e. 2-(4,5-dihydro-1,3-imidazol-2-yl)phenol-based liquid membrane electrode in a poly(vinyl chloride) (PVC) matrix for the potentiometric sensing of Al(III) having a detection limit of 7 × 10⁻⁷ M.37 Maity and Govindaraju reported a conformationally constrained (coumarin–pyrrolidinyl–triazolyl–bipyridyl) fluoroionophore conjugate using click chemistry, applicable as an Al(III) chemosensor for up to submicromolar detection (1.0 × 10⁻⁷ M) by internal charge transfer in CH3CN.38 Mashhadizadeh and Talemi synthesised a potentiometric sensor for Al(III) in the presence of gold nano-particles using a carbon paste electrode modified with silica sol–gel and mercaptosuccinic acid (MSA), having limit of detection of 1.6 × 10⁻⁷ M. Without gold nanoparticles, it showed sensing for Cu(II) with a limit of detection of 4.0 × 10⁻⁷ M.39 Gholivand et al. prepared an electrochemical sensor for Al(III) using PVC membrane and a Schiff base, i.e. N,N′-bis(salicylidene)-1,2-phenylenediamine (salophen), as the membrane carrier having a limit of detection of 6.0 × 10⁻⁷ M.40
Many recognition studies have been reported but they are largely applicable in organic medium. Successful chemosensing in environmental and biological media needs sensing in aqueous media. Taking inspiration from the reports discussed above combined with the applicability in aqueous media, we developed tripodal compounds and generated their organic nanoparticles by the reprecipitation method, for the efficient and simultaneous recognition of multiple metal ions. The ONPs having 0.01 mM concentration of ligands are sufficient for the selective and sensitive binding of metal ions in an aqueous medium. 1-ONP shows a strong and selective simultaneously response for Cs(I) and Al(III) in comparison with 2-ONP. The 1-ONP can effectively determine Cs(I) and Al(III) to limits of detection of 220 and 377 nM, respectively, in an aqueous medium.
Experimental
Materials and instruments
Analytical grade chemicals were used. Salicylaldehyde was purchased from Loba Chemie, aniline and sodium borohydride were purchased from SDFC and used without further purification. Glass slides coated with silica gel (Kieselgel 60 PF254, Merck) were used for TLC studies. Chloroform was purified by simple distillation over K2CO3. Metal nitrates (Sigma-Aldrich) and tetrabutylammonium salts of anions were used as sources of cations and anions, respectively.Characterisation of ligands was done by NMR, mass and IR spectroscopic methods. NMR studies were performed by BRUKER SPECTROSPIN at 300 MHz. Mass studies were performed on a BRUKER MICROTOF-QII instrument as well as WATERS Q-TOF MICROMASS instrument. FT-IR studies were performed using a Thermo Fisher Scientific NICOLET iS50 FT-IR. Elemental analysis was performed on a FLASH 2000 Organic Elemental Analyzer from Thermo Fisher Scientific. The optical properties of compounds were studied by UV-Vis spectroscopy, i.e. Shimadzu 2600 UV spectrophotometer for absorption spectra, and fluorescence spectroscopy, i.e. SHIMADZU RF-5301PC spectrofluorophotometer for emission spectra. Fluorescence spectroscopic studies were conducted on a SHIMADZU RF-5301PC spectrofluorophotometer having a xenon lamp as the excitation source using quartz cells (1 cm path length).
The size, shape and distribution of ONPs were investigated using a scanning electron microscope (SEM) (JSM-IT300 JEOL) operated at 20 kV voltage, with silicon wafers as substrates to coat the samples followed by gold coating (to make the samples conducting for analysis) and a transmission electron microscope (TEM) (JEM-2100 JEOL) operated at an accelerating voltage of 200 kV using a 300-mesh copper grid mounted with 2–3 drops of a distilled water dispersion of ONPs. Dynamic light scattering spectroscopy (DLS) (Malvern ZETASIZER NANO ZSP) was used for the characterisation of organic nanoparticles (ONPs).
Synthetic procedures
![[double bond, length as m-dash]](https://www.rsc.org/images/entities/char_e001.gif) N) Schiff base formation. Excess NaBH4 (20 mM, 758 mg) was added slowly for the reduction of the Schiff base, which resulted in the disappearance of colour and led to effervescence. After sometime, when the effervescence stopped, the mixture was covered and stirred for 3–4 hours at room temperature. Methanol was evaporated from the mixture and distilled water was added followed by of chloroform then shaken vigorously, which resulted in the formation of two layers. The aqueous layer contained excess NaBH4 while the chloroform layer contained the reduced Schiff base. The chloroform layer was extracted and evaporated to obtain the saturated or reduced Schiff base product. The synthesis of ligand 1 was carried out by adding 4-nitrophenyl isocyanate (5 mM, 820.6 mg) to dry chloroform and refluxing at 75–85 °C for 5–6 hours. A yellow precipitate appeared which was filtered and dried to obtain ligand 1. It was characterised by ESI-MS (m/z value) = 364.1305 [M − H]− and 386.1122 [M − Na]+; 1H NMR (300 MHz, CDCl3
N) Schiff base formation. Excess NaBH4 (20 mM, 758 mg) was added slowly for the reduction of the Schiff base, which resulted in the disappearance of colour and led to effervescence. After sometime, when the effervescence stopped, the mixture was covered and stirred for 3–4 hours at room temperature. Methanol was evaporated from the mixture and distilled water was added followed by of chloroform then shaken vigorously, which resulted in the formation of two layers. The aqueous layer contained excess NaBH4 while the chloroform layer contained the reduced Schiff base. The chloroform layer was extracted and evaporated to obtain the saturated or reduced Schiff base product. The synthesis of ligand 1 was carried out by adding 4-nitrophenyl isocyanate (5 mM, 820.6 mg) to dry chloroform and refluxing at 75–85 °C for 5–6 hours. A yellow precipitate appeared which was filtered and dried to obtain ligand 1. It was characterised by ESI-MS (m/z value) = 364.1305 [M − H]− and 386.1122 [M − Na]+; 1H NMR (300 MHz, CDCl3![[thin space (1/6-em)]](https://www.rsc.org/images/entities/char_2009.gif) :
:![[thin space (1/6-em)]](https://www.rsc.org/images/entities/char_2009.gif) DMSO-d6 (4
DMSO-d6 (4![[thin space (1/6-em)]](https://www.rsc.org/images/entities/char_2009.gif) :
:![[thin space (1/6-em)]](https://www.rsc.org/images/entities/char_2009.gif) 1), 25 °C) peaks of 1: δ = 8.81 (s, 1H, –OH), 7.54 (s, 1H, –NH), 7.21 (d, 2H, ArH), 6.78 (d, 2H, ArH), 6.53 (m, 2H, ArH), 6.46 (m, 1H, ArH), 6.36 (d, 2H, ArH), 6.22 (m, 1H, ArH), 6.0 (m, 1H, ArH), 5.81 (m, 2H, ArH) and 4.02 (s, 2H, –CH2). 13C NMR (300 MHz, CDCl3
1), 25 °C) peaks of 1: δ = 8.81 (s, 1H, –OH), 7.54 (s, 1H, –NH), 7.21 (d, 2H, ArH), 6.78 (d, 2H, ArH), 6.53 (m, 2H, ArH), 6.46 (m, 1H, ArH), 6.36 (d, 2H, ArH), 6.22 (m, 1H, ArH), 6.0 (m, 1H, ArH), 5.81 (m, 2H, ArH) and 4.02 (s, 2H, –CH2). 13C NMR (300 MHz, CDCl3![[thin space (1/6-em)]](https://www.rsc.org/images/entities/char_2009.gif) :
:![[thin space (1/6-em)]](https://www.rsc.org/images/entities/char_2009.gif) DMSO-d6 (4
DMSO-d6 (4![[thin space (1/6-em)]](https://www.rsc.org/images/entities/char_2009.gif) :
:![[thin space (1/6-em)]](https://www.rsc.org/images/entities/char_2009.gif) 1), 25 °C) peaks of 1: δ = 160.07 (1C, ArC–OH), 150.77 (1C, CO), 146.86 (1C, ArC–NH), 145.81 (1C, ArC–NO2), 135.24 (1C, ArC–N), 134.65 (1C, ArC), 133.98 (1C, ArC), 132.88 (2C, ArC), 132.58 (1C, ArC), 129.31 (2C, ArC), 127.80 (1C, ArC), 124.11 (2C, ArC), 123.82 (2C, ArC), 121.13 (1C, ArC), 117.96 (1C, ArC) and 54.51 (1C, –CH2) ppm. FTIR peaks at 3341.36 cm−1 (–NH stretching), 3067.91 cm−1 (–OH stretching), 1643.85 cm−1 (–C
1), 25 °C) peaks of 1: δ = 160.07 (1C, ArC–OH), 150.77 (1C, CO), 146.86 (1C, ArC–NH), 145.81 (1C, ArC–NO2), 135.24 (1C, ArC–N), 134.65 (1C, ArC), 133.98 (1C, ArC), 132.88 (2C, ArC), 132.58 (1C, ArC), 129.31 (2C, ArC), 127.80 (1C, ArC), 124.11 (2C, ArC), 123.82 (2C, ArC), 121.13 (1C, ArC), 117.96 (1C, ArC) and 54.51 (1C, –CH2) ppm. FTIR peaks at 3341.36 cm−1 (–NH stretching), 3067.91 cm−1 (–OH stretching), 1643.85 cm−1 (–C![[double bond, length as m-dash]](https://www.rsc.org/images/entities/char_e001.gif) O stretching), 1593.21 cm−1 (–NH bending), 1533.11 cm−1 (aromatic –C
O stretching), 1593.21 cm−1 (–NH bending), 1533.11 cm−1 (aromatic –C![[double bond, length as m-dash]](https://www.rsc.org/images/entities/char_e001.gif) C– bending), 1485.26 cm−1 (Ar-NO2) and 1381.27 cm−1 (aliphatic –CH bending). Elemental analysis: C = 65.25%, N = 10.14%, H = 4.62% and O = 19.99% for C: 66.11%; H: 4.72%; N: 11.56% and O: 17.61% [Fig. 7S–10S†].
C– bending), 1485.26 cm−1 (Ar-NO2) and 1381.27 cm−1 (aliphatic –CH bending). Elemental analysis: C = 65.25%, N = 10.14%, H = 4.62% and O = 19.99% for C: 66.11%; H: 4.72%; N: 11.56% and O: 17.61% [Fig. 7S–10S†].Similarly, for the synthesis of ligand 2, the reaction of the reduced Schiff base with 4-nitrophenyl isothiocyanate (5 mM, 900.9 mg) was carried out in dry chloroform and refluxed at 75–85 °C for 5–6 hours. The chloroform was allowed to evaporate, leaving behind a dark maroon liquid that was left overnight, followed by the addition of chilled diethyl ether. This was shaken vigorously and kept in the refrigerator. The liquid turned into a yellow powder after 5–6 hours and ether was evaporated, leaving behind ligand 2. It was characterised by 1H NMR (300 MHz, CDCl3![[thin space (1/6-em)]](https://www.rsc.org/images/entities/char_2009.gif) :
:![[thin space (1/6-em)]](https://www.rsc.org/images/entities/char_2009.gif) DMSO-d6 (4
DMSO-d6 (4![[thin space (1/6-em)]](https://www.rsc.org/images/entities/char_2009.gif) :
:![[thin space (1/6-em)]](https://www.rsc.org/images/entities/char_2009.gif) 1), 25 °C) peaks of 2: δ = 8.71 (s, 1H, –OH), 8.28 (s, 1H, –NH), 7.21 (d, 2H, ArH), 6.8 (d, 2H, ArH), 6.46 (m, 2H, ArH), 6.4 (m, 1H, ArH), 6.28 (d, 1H, ArH), 6.17 (t, 1H, ArH), 6.09 (m, 1H, ArH), 5.96 (m, 1H, ArH), 5.80 (m, 2H, ArH) and 4.47 (s, 2H, –CH2) ppm [Fig. 11S†]. 13C NMR (300 MHz, CDCl3
1), 25 °C) peaks of 2: δ = 8.71 (s, 1H, –OH), 8.28 (s, 1H, –NH), 7.21 (d, 2H, ArH), 6.8 (d, 2H, ArH), 6.46 (m, 2H, ArH), 6.4 (m, 1H, ArH), 6.28 (d, 1H, ArH), 6.17 (t, 1H, ArH), 6.09 (m, 1H, ArH), 5.96 (m, 1H, ArH), 5.80 (m, 2H, ArH) and 4.47 (s, 2H, –CH2) ppm [Fig. 11S†]. 13C NMR (300 MHz, CDCl3![[thin space (1/6-em)]](https://www.rsc.org/images/entities/char_2009.gif) :
:![[thin space (1/6-em)]](https://www.rsc.org/images/entities/char_2009.gif) DMSO-d6 (4
DMSO-d6 (4![[thin space (1/6-em)]](https://www.rsc.org/images/entities/char_2009.gif) :
:![[thin space (1/6-em)]](https://www.rsc.org/images/entities/char_2009.gif) 1), 25 °C) peaks of 2: δ = 181.10 (1C, –CS), 154.39 (1C, ArC–OH), 146.19 (1C, ArC–NH), 143.06 (ArC–NO2), 142.24 (ArC–N, 1C), 129.92 (1C, ArC), 129.41 (2C, ArC), 128.64 (1C, ArC), 127.48 (2C, ArC), 126.25 (1C, ArC), 124.86 (2C, ArC), 123.43 (1C, ArC), 121.51 (2C, ArC), 119.02 (1C, ArC), 115.31 (1C, ArC) and 53.51 (–CH2, 1C) ppm [Fig. 12S†]. ESI-MS (m/z value) = 378.2277 [M − H]− [Fig. 13S†]. FTIR peaks at 3468.91 cm−1 (–NH stretching), 3272.77 cm−1 (–OH stretching), 1595.79 cm−1 (aromatic –C
1), 25 °C) peaks of 2: δ = 181.10 (1C, –CS), 154.39 (1C, ArC–OH), 146.19 (1C, ArC–NH), 143.06 (ArC–NO2), 142.24 (ArC–N, 1C), 129.92 (1C, ArC), 129.41 (2C, ArC), 128.64 (1C, ArC), 127.48 (2C, ArC), 126.25 (1C, ArC), 124.86 (2C, ArC), 123.43 (1C, ArC), 121.51 (2C, ArC), 119.02 (1C, ArC), 115.31 (1C, ArC) and 53.51 (–CH2, 1C) ppm [Fig. 12S†]. ESI-MS (m/z value) = 378.2277 [M − H]− [Fig. 13S†]. FTIR peaks at 3468.91 cm−1 (–NH stretching), 3272.77 cm−1 (–OH stretching), 1595.79 cm−1 (aromatic –C![[double bond, length as m-dash]](https://www.rsc.org/images/entities/char_e001.gif) C– bending), 1515.42 cm−1 (Ar-NO2), 1421.62 cm−1 (NCN stretch), 1301.81 cm−1 (Ar–NO2), 1180.63 cm−1 (–C
C– bending), 1515.42 cm−1 (Ar-NO2), 1421.62 cm−1 (NCN stretch), 1301.81 cm−1 (Ar–NO2), 1180.63 cm−1 (–C![[double bond, length as m-dash]](https://www.rsc.org/images/entities/char_e001.gif) S) and 853.73 cm−1 (para-substituted benzene) [Fig. 14S†]. Elemental analysis: C = 60.34%, N = 10.81%, H = 5.33%, S = 7.89% and O = 15.62% for C: 63.31%; H: 4.52%; N: 11.07%; S: 8.45% and O: 12.65%.
S) and 853.73 cm−1 (para-substituted benzene) [Fig. 14S†]. Elemental analysis: C = 60.34%, N = 10.81%, H = 5.33%, S = 7.89% and O = 15.62% for C: 63.31%; H: 4.52%; N: 11.07%; S: 8.45% and O: 12.65%.
| Limit of detection = 3σ/m |
For further insight, the interference studies, pH studies, response time studies and ionic strength environment studies were done. The stability of the ONPs was observed under various pH values as well as under the high ionic strength of a heavy salt, i.e. tetrabutylammonium perchlorate. The stability of the ONP–analyte complex was investigated with respect to time at various concentrations of the analytes. The interference study was performed to investigate the perturbation in the fluorescence emission spectra of the host–analyte complex caused by other metal ions if any. At first, the complex of the ONP–analyte (metal ions) was formed, after which, other cations/anions were added separately, shaken and allowed to displace the earlier metal ion from the complex, which was tracked by recording the fluorescence emission spectra of the solutions. If the fluorescence emission spectrum deviated from an earlier one, the added metal ion was able to displace the earlier bound ion from the complex, thus interfering with the complex; otherwise, the added metal ion is not able to disturb the complex.
Results and discussion
Synthesis and characterisation of ligand 1 and 2
Ligands 1 and 2 were synthesised in multiple steps [Scheme 1]. Firstly, we synthesised the Schiff base from the reaction of salicylaldehyde with aniline and this was confirmed by 1H NMR, which showed the characteristic chemical shift at 8.651(s) ppm of the Schiff base proton of the (–HC![[double bond, length as m-dash]](https://www.rsc.org/images/entities/char_e001.gif) N–) group [Fig. 1S†], while the chemical shift (δ) at 76.33 ppm in the 13C NMR spectrum represents the carbon atom of the (–C
N–) group [Fig. 1S†], while the chemical shift (δ) at 76.33 ppm in the 13C NMR spectrum represents the carbon atom of the (–C![[double bond, length as m-dash]](https://www.rsc.org/images/entities/char_e001.gif) N–) group [Fig. 2S†]. The Schiff base formation was also confirmed by mass spectroscopy [Fig. 3S†]. After that, excess NaBH4 was added for the reduction of the Schiff base and the reduced Schiff base was further characterised by 1H NMR, 13C NMR and mass spectroscopy [Fig. 4S–6S†]. The chemical shifts (δ) in the 1H NMR at 1.341(t), 1.672(s), 4.028(bs), 4.483(d), 6.932(m), 7.301(m), 8.5(bs) ppm represent the hydrogen atoms of the reduced product [Fig. 4S†], while in the 13C spectrum, chemical shifts (δ) at 48.75, 147.23 and 156.8 ppm represent the carbon atom belonging to the (–CH2), (–NH) and (–OH) groups, respectively. In the mass spectrum, (m/z) peaks at 198.0915 and 200.1072 confirmed the Schiff base and the reduced product, respectively [Fig. 3S and 6S†]. The error percentage is −0.2 ppm as calculated from HRMS for both the Schiff base and the reduced product. This reduced product was further reacted with 4-nitrophenyl isocyanate or 4-nitrophenyl isothiocyanate to get ligands 1 [0.900 g, yield 55.95%] and 2 [1.549 g, yield 81.74%], respectively [Scheme 1].
N–) group [Fig. 2S†]. The Schiff base formation was also confirmed by mass spectroscopy [Fig. 3S†]. After that, excess NaBH4 was added for the reduction of the Schiff base and the reduced Schiff base was further characterised by 1H NMR, 13C NMR and mass spectroscopy [Fig. 4S–6S†]. The chemical shifts (δ) in the 1H NMR at 1.341(t), 1.672(s), 4.028(bs), 4.483(d), 6.932(m), 7.301(m), 8.5(bs) ppm represent the hydrogen atoms of the reduced product [Fig. 4S†], while in the 13C spectrum, chemical shifts (δ) at 48.75, 147.23 and 156.8 ppm represent the carbon atom belonging to the (–CH2), (–NH) and (–OH) groups, respectively. In the mass spectrum, (m/z) peaks at 198.0915 and 200.1072 confirmed the Schiff base and the reduced product, respectively [Fig. 3S and 6S†]. The error percentage is −0.2 ppm as calculated from HRMS for both the Schiff base and the reduced product. This reduced product was further reacted with 4-nitrophenyl isocyanate or 4-nitrophenyl isothiocyanate to get ligands 1 [0.900 g, yield 55.95%] and 2 [1.549 g, yield 81.74%], respectively [Scheme 1].
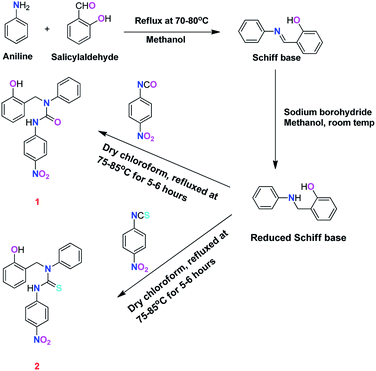 | ||
| Scheme 1 Synthesis of ligand 1, i.e., 1-(2-hydroxybenzyl)-3-(4-nitrophenyl)-1-phenylurea and ligand 2, i.e., 1-(2-hydroxybenzyl)-3-(4-nitrophenyl)-1-phenylthiourea. | ||
Ligands 1 and 2 were fully characterised by standard spectroscopic techniques, for example NMR, mass and FTIR spectroscopy. The 1H NMR spectrum of ligand 1 shows a singlet at 4.02 ppm, which indicates the presence of 2 aliphatic protons. The chemical shift (δ) values at 6.53, 6.46, 6.22, 6.0 and 5.8 ppm denote 7 aromatic protons. The two aromatic protons of the substituted benzene ring are denoted by a doublet at 6.36 ppm, while four aromatic protons of the substituted p-nitrophenyl ring are shown by doublets at 6.78 and 7.21 ppm [Fig. 7S†]. The 13C NMR spectrum of ligand 1 shows the chemical shift at 54.51 ppm, which indicates the presence of one aliphatic carbon. The aromatic carbons attached to the –NH, –NO2 and –N– groups are given by 146.86, 145.81 and 135.24 ppm, respectively. The chemical shifts at 160.07 and 150.77 ppm indicated the presence of carbon atoms attached to the –OH and –C![[double bond, length as m-dash]](https://www.rsc.org/images/entities/char_e001.gif) O group, respectively [Fig. 8S†]. The mass spectrum of ligand 1 shows the (m/z) value at 364.1305 and 386.1122 corresponding to [M − H]− and [M − Na]+ peaks, respectively [Fig. 9S†]. In the FT-IR spectrum of ligand 1, the major peaks at 3341.36 cm−1, 3067.91 cm−1, 1643.85 cm−1 and 1485.26 cm−1 marked the presence of the stretching vibrations of the amine, hydroxyl, carbonyl and nitro groups, respectively [Fig. 10S†]. Further, the purity of ligand 1 was confirmed by the elemental analysis which showed the presence of carbon, hydrogen, nitrogen and oxygen in 65.25%, 4.62%, 10.14% and 19.99%, respectively; this matches closely with the theoretical values of C: 66.11%; H: 4.72%; N: 11.56% and O: 17.61%. Similarly, ligand 2 was fully characterised by standard spectroscopic techniques. In the 1H NMR spectrum of ligand 2, a singlet at 4.47 ppm denotes two aliphatic protons. The chemical shifts (δ) at 6.46, 6.4, 6.09, 5.96 and 5.80 ppm show multiplets representing the presence of 7 aromatic protons. The doublets at (δ) 7.21 and 6.8 ppm marked the presence of 4 protons from the substituted p-nitrophenyl ring (2 close to –NO2 group and 2 close to –NH group), while 6.28 ppm showed the presence of 1 proton of the substituted phenol ring [Fig. 11S†]. The 13C NMR spectrum showed a chemical shift (δ) at 53.51 ppm, which depicts the presence of 1 aliphatic carbon, while the chemical shifts (δ) at 181.10 and 154.39 ppm denote the (–C
O group, respectively [Fig. 8S†]. The mass spectrum of ligand 1 shows the (m/z) value at 364.1305 and 386.1122 corresponding to [M − H]− and [M − Na]+ peaks, respectively [Fig. 9S†]. In the FT-IR spectrum of ligand 1, the major peaks at 3341.36 cm−1, 3067.91 cm−1, 1643.85 cm−1 and 1485.26 cm−1 marked the presence of the stretching vibrations of the amine, hydroxyl, carbonyl and nitro groups, respectively [Fig. 10S†]. Further, the purity of ligand 1 was confirmed by the elemental analysis which showed the presence of carbon, hydrogen, nitrogen and oxygen in 65.25%, 4.62%, 10.14% and 19.99%, respectively; this matches closely with the theoretical values of C: 66.11%; H: 4.72%; N: 11.56% and O: 17.61%. Similarly, ligand 2 was fully characterised by standard spectroscopic techniques. In the 1H NMR spectrum of ligand 2, a singlet at 4.47 ppm denotes two aliphatic protons. The chemical shifts (δ) at 6.46, 6.4, 6.09, 5.96 and 5.80 ppm show multiplets representing the presence of 7 aromatic protons. The doublets at (δ) 7.21 and 6.8 ppm marked the presence of 4 protons from the substituted p-nitrophenyl ring (2 close to –NO2 group and 2 close to –NH group), while 6.28 ppm showed the presence of 1 proton of the substituted phenol ring [Fig. 11S†]. The 13C NMR spectrum showed a chemical shift (δ) at 53.51 ppm, which depicts the presence of 1 aliphatic carbon, while the chemical shifts (δ) at 181.10 and 154.39 ppm denote the (–C![[double bond, length as m-dash]](https://www.rsc.org/images/entities/char_e001.gif) S) group and the aromatic carbon atom attached to the (–OH) group, respectively [Fig. 12S†]. The m/z value at 378.2277 denotes the [M − H]− peak, which confirmed the synthesis of ligand 2 [Fig. 13S†]. The major peaks at 1515.42 cm−1 and 1301.81 cm−1 in the FT-IR spectrum of ligand 2 confirmed the presence of the aromatic (–NO2) group, while 3468.91 cm−1, 3272.77 cm−1 and 1180.63 cm−1 indicated the presence of the (–C
S) group and the aromatic carbon atom attached to the (–OH) group, respectively [Fig. 12S†]. The m/z value at 378.2277 denotes the [M − H]− peak, which confirmed the synthesis of ligand 2 [Fig. 13S†]. The major peaks at 1515.42 cm−1 and 1301.81 cm−1 in the FT-IR spectrum of ligand 2 confirmed the presence of the aromatic (–NO2) group, while 3468.91 cm−1, 3272.77 cm−1 and 1180.63 cm−1 indicated the presence of the (–C![[double bond, length as m-dash]](https://www.rsc.org/images/entities/char_e001.gif) S), (–OH) and (–NH) groups, respectively [Fig. 14S†]. The elemental analysis confirmed the presence of carbon, hydrogen, nitrogen, sulphur and oxygen atoms as 60.34%, 5.33%, 10.81%, 7.89% and 15.62%, respectively which is close to the theoretical outcome, i.e. C: 63.31%; H: 4.52%; N: 11.07%; S: 8.45% and O: 12.65%.
S), (–OH) and (–NH) groups, respectively [Fig. 14S†]. The elemental analysis confirmed the presence of carbon, hydrogen, nitrogen, sulphur and oxygen atoms as 60.34%, 5.33%, 10.81%, 7.89% and 15.62%, respectively which is close to the theoretical outcome, i.e. C: 63.31%; H: 4.52%; N: 11.07%; S: 8.45% and O: 12.65%.
Development and characterisation of 1, 2-ONPs
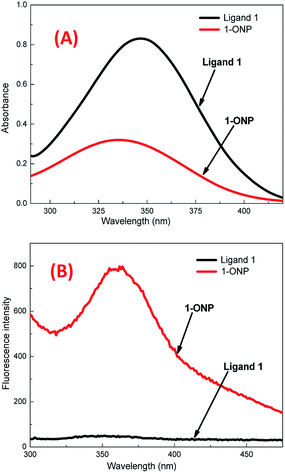
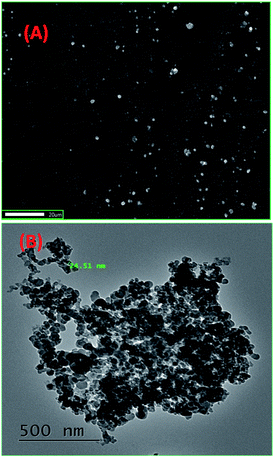
The reprecipitation method41 was used to produce organic nanoparticles (ONP). Organic ligands were dissolved in an organic solvent, i.e. N,N-dimethylformamide (DMF), followed by the injection of a small amount of ligand solution in DMF into double distilled water (with sonication), which was further sonicated for 5–10 minutes to get a uniform ONP solution. The formation of ONPs was confirmed by evaluating the average size of particles by dynamic light scattering (DLS) and surface morphology by using transmission electron microscopy (TEM) and scanning electron microscopy (SEM). The optical properties of ONPs were also studied with different spectrophotometric methods. 1-ONP was characterised by both SEM-EDX and TEM-EDX while 2-ONP was characterised by SEM-EDX only.1-ONP showed a blue shift in its absorbance as compared to ligand 1, and it had much higher fluorescence emission intensity than ligand 1 [Fig. 1(A) and (B)]. 1-ONP and ligand 1 absorb at 335 nm and 346 nm, respectively. 1-ONP emits at 362 nm, while ligand 1 emits at 352 nm when excited at 260 nm. 1-ONP has spherical morphology as shown by SEM and TEM images [Fig. 2(A) and (B)]. The TEM image of 1-ONPs revealed the diameter of the spheres as approximately 20–25 nm [Fig. 2(B)]. The SEM-EDX and TEM-EDX spectra showed the presence of C, N and O in 1-ONP [Fig. 15S(A) and (B)†]. The hydrodynamic diameter and zeta potential of 1-ONPs were obtained as 572.3 nm and −24.2 mV, respectively [Fig. 15S(B) and (C)†]. The higher value was obtained in the DLS measurement as compared to the TEM measurement because of the inclusion of the solvent sphere in the DLS measurement, which was avoided in TEM images.
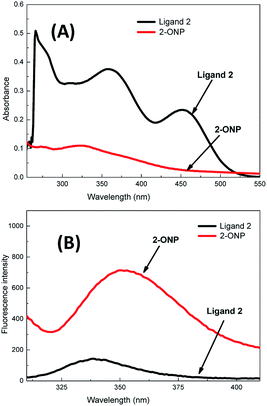
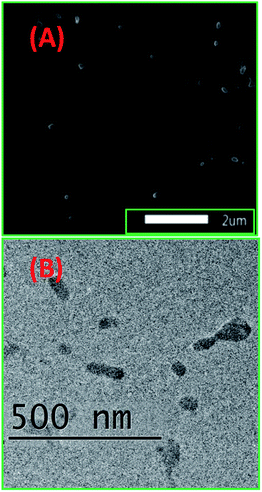
Ligand 2 absorbs at 266 nm, 357 nm and 452 nm, i.e. at 3 wavelengths, while 2-ONP absorbs over 320–327 nm with a wide absorption band [Fig. 3(A)]. Ligand 2 emits at 339 nm, while 2-ONP emits at 350 nm when excited at 270 nm. The 2-ONP solution shows a redshift in its fluorescence emission spectrum as compared to ligand 2 [Fig. 3(B)]. The spherical morphology of 2-ONP can be clearly seen from its SEM and TEM images [Fig. 4(A) and (B)].
2-ONPs are spherical structures with a diameter of approximately 30–35 nm, as obtained from the TEM image [Fig. 4(B)]. The EDX spectrum confirmed the presence of C, N, O and S atoms in 2-ONP [Fig. 16S(A)†]. The amounts of the ligands (4 mg) used for the preparation of ONPs were very small. In addition, theoretically, the sulphur atom was present in only 8.45% by molecular weight as per the molecular formula in ligand 2. As such, the signals corresponding to sulphur atoms are very weak as compared to other atoms in 2-ONP in its SEM-EDX spectrum.
The DLS study showed the hydrodynamic diameter and zeta potential of 2-ONP as 593.6 nm and 0.944 mV, respectively [Fig. 16S(B) and (C)†]. The zeta potential is the potential difference between the dispersion medium and the stationary layer of fluid attached to the dispersed particles. The higher the value (irrespective of being positive or negative), the higher will be the stability of the colloidal dispersion. If the value of the zeta potential of any colloidal dispersion is from 0 to ±5 mV, it means that the dispersion has rapid coagulation, while if the zeta potential is near ±30 mV, it is moderately stable. The zeta potential of 2-ONP is 0.944 mV while that of 1-ONP is −24.2 mV, which means that 1-ONP is more stable than 2-ONP.
The optical properties are very much dependent on the size of the particles. As we move from the bulk material to the nanomaterial, the energy band gap increases. As the energy band gap increases, the wavelength decreases, which results in the blue shift of the wavelength in the absorbance spectra of the ONPs. Similarly, an increase in the energy band gap in the nanoparticles resulted in greater absorption energy while going from the ground state to the excited state, and hence the greater fluorescence emission intensity on coming back from the excited state to the ground state.
The ONPs showed the blue shift as compared to the bulk ligands in their respective absorption spectra. Also, the emission intensities of ONPs were 600–700 times greater than that of the respective ligands. This means that ONPs are fluorescent even in very low concentrations as compared to that of their respective ligands. The absorption and emission spectra support the formation of ONPs from their respective ligands.
Chemosensing studies
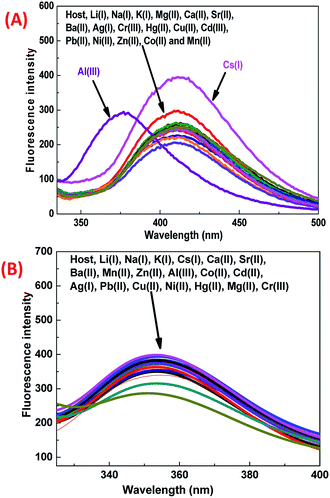
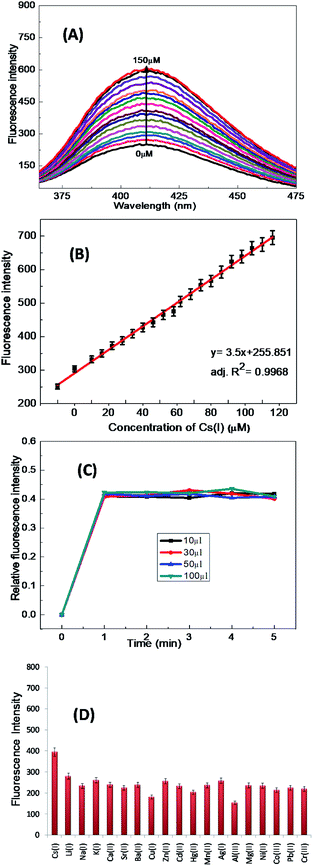
After binding, the 1-ONP–Cs(I) complex was stabilised and its energy decreased, which resulted in the lowering of the HOMO of the Cs(I) bound receptor and thus electrons of the receptor of 1-ONP were no longer available for its fluorophore, which increased the fluorescence emission intensity of the 1-ONP–Cs(I) complex. The binding behaviour of 1-ONP towards Cs(I) was confirmed by fluorometric titration of the 1-ONP–Cs(I) complex with increasing concentration of Cs(I) ions [Fig. 6(A)]. The binding of Cs(I) and 1-ONP followed a linear pattern (adjusted R2 value = 0.9968) at 411 nm [Fig. 6(B)].
The limit of detection calculated from this plot was ∼220 nM. The stability of the 1-ONP–Cs(I) complex was observed by investigating the fluorescence emission spectrum of the 1-ONP–Cs(I) complex at various concentrations of Cs(I), i.e., 10, 30, 50 and 100 μM. At each Cs(I) ion concentration, the fluorescence emission spectrum of the 1-ONP–Cs(I) complex was recorded for 5 measurements. The plot between the relative fluorescence intensity and the concentration of Cs(I) in the 1-ONP–Cs complex showed its stability during the measurements.
It was observed that the 1-ONP–Cs(I) complex was stable at all concentrations for at least 5 measurements [Fig. 6(C)]. The interference of other cations with the 1-ONP–Cs(I) complex was studied by adding Cs(I) to the 1-ONP (5 ml) solution, followed by the addition of solutions of other cations. It was observed that only Li(I) and Al(III) interfered to some extent with Cs(I) at 411 nm [Fig. 6(D)]. 1-ONP also showed chemosensing behaviour towards Al(III) via the intramolecular charge transfer (ICT) mechanism [Fig. 5(A)].
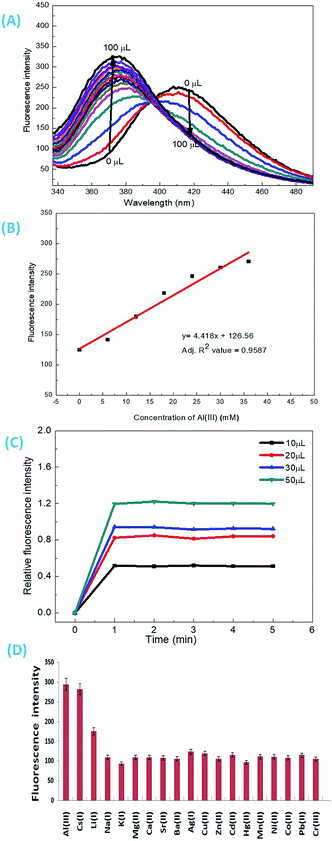
As discussed above, when other metal ions were added to the 1-ONP solution, the fluorescence emission was observed at around 410 nm, except for Al(III) which had its fluorescence emission at around 377 nm, i.e. a blue shift of 36 nm with respect to 1-ONP. Al(III) was bound to the receptor (donor) and charge transfer occurred from the receptor of the host to its acceptor on the fluorophore end. Here, the receptor acts as a donor, which binds to the Al(III). After the binding of Al(III) with 1-ONP, the LUMO shifted higher, which resulted in the increase in the band gap and hence a blue shift occurred. To confirm the binding behaviour of 1-ONP with Al(III), fluorometric titration as a function of Al(III) concentration was performed [Fig. 7(A)]. The binding pattern of the 1-ONP–Al(III) complex was found to be moderately linear (adjusted R2 value = 0.9587) at 377 nm [Fig. 7(B)]. From this plot, the limit of detection was calculated as ∼377 nM. Fluorescence titration revealed that the blue shift in the emission was due to intramolecular charge transfer (ICT) along with in increase and decrease in the fluorescence emission intensity at around 384–372 nm and 377–398 nm, respectively, because of which perfect linearity was not observed at all wavelengths in binding.
The emission intensity of the old peaks gradually decreased while new peaks were increasing, which collectively resulted in the ratiometric sensing of Al(III) by 1-ONP. For the response time study, the emission behaviour of the 1-ONP–Al(III) complex was observed as a function of various concentrations of Al(III), i.e., 10, 20, 30 and 50 μM. At each concentration, the 1-ONP–Al(III) complex was stable for at least 5 measurements under the radiation source (Xe lamp) [Fig. 7(C)].
For the interference study, Al(III) solution was added to the 1-ONP (5 ml) solution, followed by the addition of other metal nitrate solutions. It was observed that only Cs(I) and Li(I) ions were interfering with Al(III) to some extent at 377 nm [Fig. 7(D)]. Thus, 1-ONP has shown significant recognition behaviour towards Cs(I) and Al(III) by the PET-off phenomenon and ICT phenomenon, respectively.
The applicability of 1-ONP under various pH conditions was checked in acidic and basic media (HCl and NaOH solutions, respectively). It was found that the fluorescence emission spectrum of 1-ONP was not disturbed till pH 5.7 and pH 11 in acidic and basic medium, respectively, so it is applicable in the pH range of 5.7 to 11 [Fig. 17S(A)†]. The effect of the heavy ionic strength on 1-ONP was also checked by the gradual addition of various concentrations of a heavy salt, i.e. tetrabutylammonium perchlorate followed by the observation of its fluorescence emission spectra [Fig. 17S(B)†]. It was seen that the fluorescence spectrum did not change in any significant manner until the concentration of the heavy salt in 1-ONP was 600 μM; i.e., fluorescence emission intensity difference was seen at around 50 a.u. only.
Theoretical study
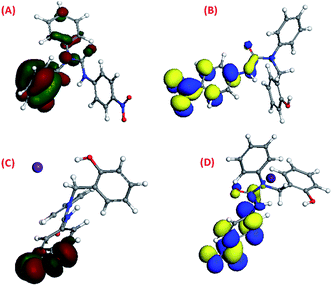
The density functional theory (DFT) study42–44 showed that the HOMO and LUMO of molecule 1 were previously located on its 95th and 96th orbitals with energy at −5.827 eV and −4.806 eV, respectively. After binding with Cs(I), it got shifted to the 122nd and 123rd orbitals with energies of −5.686 eV and −3.926 eV, respectively, upon binding with Cs(I) [Fig. 8(A)–(D)]. DFT study suggested that three arms of molecule 1 occupied three different planes in the space to avoid steric repulsion. The HOMO electron density of molecule 1 was majorly located on the phenol group, which shifted to the (–NO2) group of the p-nitrophenyl moiety after complexation with Cs(I), while the LUMO electron density of molecule 1 was majorly located on the p-nitrophenyl moiety, which was not altered after complexation.The HOMO and LUMO of molecule 2 were previously located on its 99th and 100th orbitals with energies of −5.739 eV and −4.854 eV, respectively, as shown by their density functional theory (DFT) calculations37–39 [Fig. 9(A) and (B)]. It was suggested that three arms of molecule 2 were oriented in three different planes in the space. The HOMO electron density of molecule 2 was majorly located on the p-nitrophenyl moiety and the thiourea group along with a small distribution on the phenol group, while the LUMO electron density was majorly located on the p-nitrophenyl and thiourea group.
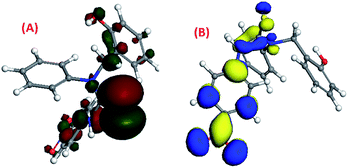 | ||
| Fig. 9 The DFT-optimised pictorial representation of (A) the HOMO of 2; (B) LUMO of 2 (red and green colour for the HOMO, blue and yellow colour for the LUMO). | ||
Conclusions
Two tripodal ligands 1 and 2 were synthesised and characterised by NMR, mass and IR spectroscopy. Ligand 1 bears the urea group, while ligand 2 bears the thiourea group. Their organic nanoparticles (ONP) were prepared by the reprecipitation method under ultrasonic waves. 1-ONP and 2-ONP have spherical morphologies with diameters of approximately 20–25 nm and 30–35 nm, respectively. The chemosensing properties of 1-ONP and 2-ONP were investigated, which revealed that 1-ONP simultaneously and clearly recognised Cs(I) and Al(III) ions, while 2-ONP did not recognise any cation in the aqueous medium. In the chemosensing study of 1-ONPs, the recognition of Cs(I) followed the PET-off mechanism path and Al(III) ion recognition followed the ICT mechanism path. The fluorometric titration of Cs(I) and Al(III), showed linear behaviour with the adjacent R2 value of >95%. The limits of detection for Cs(I), and Al(III) were calculated as ∼220 and ∼377 nM, respectively, in the chemosensing study of 1-ONP. The response time study proved the stability of the ONPs against the irradiation source and time, while the competitive binding studies proved the stability of the analyte–host complex in the presence of other cations/anions. 1-ONP was stable in the pH range of 5.7 to 11, while 2-ONP was stable in the pH range of 3.07 to 9.95. Theoretical studies proved the change in the electron density and orbitals after the interaction of analytes with host molecules. 1-ONP was proved to be highly efficient in very small amounts for the simultaneous detection of 2 cations, i.e., Cs(I) and Al(III) by different mechanisms of detection, while 2-ONP did not recognise any ion in aqueous medium. Cs(I) is highly electropositive and its d-electrons are unavailable for bonding. It has a larger size but less polarizing power, so it behaves as a hard acid. Due to the high positive charge and small size, Al(III) also behaves like a hard acid. Oxygen behaves as a hard base, so both Cs(I) and Al(III) prefer to bind with the oxygen-bearing complex, i.e. 1-ONP, as per the HSAB concept. The orientation of the atoms in 1-ONP along with the cavity size also supported its complex formation with Cs(I) and Al(III). The proper cavity size and orientation of linker molecules in 1-ONP favoured this highly selective, sensitive and simultaneous nanomolar chemosensing behaviour in 1-ONP. This work demonstrates the effect of urea and thiourea linker molecules on the chemosensing properties of the ONPs.This manuscript describes the detection of multiple cations at the same time in the aqueous medium with detection limits up to the nano level, as well as the effect of the architecture of the linker molecule on the type of detection.
Conflicts of interest
There are no conflicts to declare.Acknowledgements
Authors thank Department of Science and Technology (DST), Government of India for financial support. JM thanks Sophisticated Analytical Instrumentation Facility (SAIF), Panjab University, Chandigarh, Indian Institute of Technology (IIT), Delhi and Institute of Nano Science and Technology (INST), Mohali for instrumentation facilities.References
- P. A. Walravens, Clin. Chem., 1980, 26(2), 185–189 CrossRef CAS.
- O. Bandmann, K. H. Weiss and S. G. Kaler, Lancet Neurol., 2015, 14(1), 103–113 CrossRef CAS PubMed.
- P. Karimi, R. A. Khavari-Nejad, V. Niknam, F. Ghahremaninejad and F. Najafi, Sci. World J., 2012, 615670, DOI:10.1100/2012/615670 , 6 pages.
- R. Singh, N. Gautam, A. Mishra and R. Gupta, Indian J. Pharmacol., 2011, 43(3), 246–253 CrossRef CAS PubMed.
- B. Adhikari and S. Majumdar, Prog. Polym. Sci., 2004, 29, 699–766 CrossRef CAS.
- A. N. Shipway, E. Katz and I. Willner, ChemPhysChem, 2000, 1, 18–52 CrossRef CAS PubMed.
- W. Gopel, T. A. Jones, M. Kleitz, J. Lundstorm, T. Seiyama, J. Hesse and J. N. Zemel, Sensors, A Comprehensive survey, Wiley-VCH, Weinheim, 2008, vol. 2, Part I, Chemical and biochemical sensors, print ISBN: 9783527267682, online ISBN: 9783527620135, DOI:10.1002/9783527620135.
- G. Aragay, F. Pino and A. Merkoci, Chem. Rev., 2012, 112, 5317–5338 CrossRef CAS PubMed.
- M. Britschgi, S. von Greyerz, C. Burkhart and W. J. Pichler, Curr. Drug Targets, 2003, 4(1), 1–11 CrossRef CAS PubMed.
- N. Barsan, G. Gauglitz, A. Oprea, E. Ostertag, G. Proll, K. Rebner, K. Schierbaum, F. Schleifenbaum and U. Weimar, Chemical and Biochemical Sensors, 1. Fundamentals. Ullmann's Encyclopedia of Industrial Chemistry, Wiley-VCH, 2016, pp. 1–81, DOI:10.1002/14356007.b06_121.pub2.
- (a) E. Shoji and M. S. Freund, J. Am. Chem. Soc., 2001, 123, 3383–3384 CrossRef CAS PubMed; (b) Z.-H. Sheng, X.-Q. Zheng, J.-Y. Xu, W.-J. Bao, F.-B. Wang and X.-H. Xia, Biosens. Bioelectron., 2012, 34, 125–131 CrossRef CAS PubMed.
- (a) H.-J. Schneider, K. Kato and R. M. Strongin, Sensors, 2007, 7, 1578–1611 CrossRef CAS PubMed; (b) H. S. Tzou and C. I. Tseng, J. Sound Vib., 1990, 138(1), 17–34 CrossRef.
- (a) X. Luo, A. Morrin, A. J. Killard and M. R. Smyth, Electroanalysis, 2006, 18(4), 319–326 CrossRef CAS; (b) J. Liu and Y. Lu, Angew. Chem., 2006, 118, 96–100 CrossRef.
- (a) A. S. Klymchenko and A. P. Demchenko, J. Am. Chem. Soc., 2002, 124, 12372–12379 CrossRef CAS PubMed; (b) D. W. Kimmel, G. LeBlanc, M. E. Meschievitz and D. E. Cliffel, Anal. Chem., 2012, 84, 685–707 CrossRef CAS PubMed.
- (a) R. C. Jorgenson and S. S. Yee, Sens. Actuators, B, 1993, 12, 213–220 CrossRef CAS; (b) H. Raisanen, US Pat. 7216417B2, 15 May 2007.
- W. Gopel, J. Hesse, J. N. Zemel, T. Grandke and W. H. Ko, Sensors, A Comprehensive Survey, Wiley-VCH Weinheim, 2008, vol. 1, Fundamentals and General Aspects, print ISBN: 9783527267675, online ISBN: 9783527620128, DOI:10.1002/9783527620128.
- S. Chopra, N. Singh, P. Thangarasu, V. K. Bhardwaj and N. Kaur, Dyes Pigm., 2014, 106, 45–50 CrossRef CAS.
- G. Kaur, T. Raj, N. Kaur and N. Singh, New J. Chem., 2016, 40, 10536–10544 RSC.
- S. Kaur, A. Kaur, N. Kaur and N. Singh, Org. Biomol. Chem., 2014, 12, 8230–8238 RSC.
- A. P. Demchenko, Introduction to Fluorescence Sensing, Springer International Pulishing, Switzerland, 2nd edn, 2015, print ISBN: 978-3-319-20779-7, online ISBN: 978-3-319-20780-3, DOI:10.1007/978-3-319-20780-3.
- H. Sharma, A. Singh, N. Kaur and N. Singh, ACS Sustainable Chem. Eng., 2013, 1, 1600–1608 CrossRef CAS.
- J. M. Garcia, F. C. Garcia, F. Serna and J. L. de la Pena, Polym. Rev., 2011, 51, 341–390 CrossRef CAS.
- (a) J. C. Skou, Biochim. Biophys. Acta, 1960, 42, 6–23 CrossRef CAS; (b) R. Whittam and M. E. Ager, Biochem. J., 1964, 93(2), 337–348 CrossRef CAS PubMed.
- J. Bramham and F. G. Riddell, J. Inorg. Biochem., 1994, 53, 169–176 CrossRef CAS PubMed.
- P. Melnikov and L. Z. Zanoni, Biol. Trace Elem. Res., 2010, 135, 1–9 CrossRef CAS PubMed.
- (a) D. Krewski, R. A. Yokel, E. Nieboer, D. Borchelt, J. Cohen, J. Harry, S. Kacew, J. Lindsay, A. M. Mahfouz and V. Rondeau, J. Toxicol. Environ. Health, Part B, 2007, 10(Suppl. 1), 1–269, DOI:10.1080/10937400701597766; (b) P. Zatta, E. Lain and C. Cagnolini, Eur. J. Biochem., 2000, 267, 3049–3055 CrossRef CAS PubMed.
- R. R. Crichton, Biological Inorganic Chemistry, Elsevier, Oxford, 2nd edn, 2012, ISBN 978-0-444-53782-9 Search PubMed.
- R. Azadbakht and J. Khanabadi, Spectrochim. Acta, Part A, 2015, 139, 279–285 CrossRef CAS PubMed.
- M. Shamsipur, S. Y. Kazemi, H. Sharghi and K. Niknam, Fresenius. J. Anal. Chem., 2001, 371, 1104–1108 CrossRef CAS PubMed.
- E. D. Roper, V. S. Talanov, M. G. Gorbunova, R. A. Bartsch and G. G. Talanova, Anal. Chem., 2007, 79, 1983–1989 CrossRef CAS PubMed.
- B. Radaram, T. Mako and M. Levine, Dalton Trans., 2013, 42, 16276–16278 RSC.
- V. Souchon, I. Leray and B. Valeur, Chem. Commun., 2006, 4224–4226 RSC.
- J. S. Benco, H. A. Nienaber, K. Dennen and W. G. McGimpsey, J. Photochem. Photobiol., A, 2002, 152, 33–40 CrossRef CAS.
- H. Sharma, N. Kaur, A. Singh, A. Kuwar and N. Singh, J. Mater. Chem. C, 2016, 4, 5154–5194 RSC.
- M. Arvand, M. Moghimi and M. A. Bagherinia, Anal. Lett., 2009, 42, 393–408 CrossRef CAS.
- X.-H. Jiang, B.-D. Wang, Z.-Y. Yang, Y.-C. Liu, T.-R. Li and Z.-C. Liu, Inorg. Chem. Commun., 2011, 14, 1224–1227 CrossRef CAS.
- R. K. Bera, S. K. Sahoo, S. K. Mittal and A. Kumar, Int. J. Electrochem. Sci., 2010, 5, 29–38 CAS.
- D. Maity and T. Govindaraju, Inorg. Chem., 2010, 49(16), 7229–7231 CrossRef CAS PubMed.
- M. H. Mashhadizadeh and R. P. Talemi, Anal. Chim. Acta, 2011, 692, 109–115 CrossRef CAS PubMed.
- M. B. Gholivand, F. Ahmadi and E. Rafiee, Electroanalysis, 2006, 18(16), 1620–1626 CrossRef CAS.
- H. Kasai, H. S. Nalwa, H. Oikawa, S. Okzada, H. Matsuda, N. Minami, A. Kakuta, K. Ono, A. Mukoh and H. Nakanishi, Jpn. J. Appl. Phys., 1992, 31, L1132 CrossRef CAS.
- Accelrys, Materials Studio Release Notes, Release 4.4, Accelrys Software Inc., 2008 Search PubMed.
- R. D. L. Johnstone, A. R. Lennie, S. F. Parker, S. Parsons, E. Pidcock, P. R. Richardson, J. E. Warren and P. A. Wood, CrystEngComm, 2010, 12, 1065–1078 RSC.
- J. P. Perdew and Y. Wang, Phys. Rev. B: Condens. Matter Mater. Phys., 1992, 45, 13244–13249 CrossRef PubMed.
- A. Shrivastava and V. Gupta, Chron. Young Sci., 2011, 2, 21–25 CrossRef.
Footnote |
| † Electronic supplementary information (ESI) available. See DOI: 10.1039/d0ra03171b |
| This journal is © The Royal Society of Chemistry 2020 |

