
 Open Access Article
 This Open Access Article is licensed under a Creative Commons Attribution-Non Commercial 3.0 Unported Licence
New, inexpensive and simple 3D printable device for nephelometric and fluorimetric determination based on smartphone sensing †
Ezequiel Vidal‡
 *a,
Anabela S. Lorenzetti‡a,
Miguel Ángel Aguirreb,
Antonio Canalsb and
Claudia E. Domini*a
*a,
Anabela S. Lorenzetti‡a,
Miguel Ángel Aguirreb,
Antonio Canalsb and
Claudia E. Domini*a
aINQUISUR, Departamento de Química, Universidad Nacional del Sur (UNS)-CONICET, Av. Alem 1253, 8000 Bahía Blanca, Argentina. E-mail: ezquielvidal.estudio@gmail.com; claudia.domini@uns.edu.ar; Tel: +54 291 4595101 int 3558
bDepartamento de Química Analítica, Nutrición y Bromatología, Instituto Universitario de Materiales, Universidad de Alicante, Apdo. 99, 03080 Alicante, Spain
First published on 26th May 2020
Abstract
A new, inexpensive and easy to use 3D printable device was developed for nephelometric and fluorimetric determination. Its applicability was tested for the quantification of quinine in tonic drinks and sulfate in natural water with good analytical accuracy. In this way, sulfate determination was carried out by nephelometry using a red LED, while quinine was determined using a blue LED by fluorimetry. A smartphone camera was used to take the pictures and afterwards transform them into the RGB color space using the software ImageJ by a personal computer. The linear range was 2.0–50.0 mg L−1 for sulfate with a LOD of 0.13 mg L−1, and the corresponding quantification limit (LOQ) was 0.43 mg L−1. The linear range for quinine was from 0.42 to 3.10 mg L−1. The LOD and LOQ were 0.11 mg L−1 and 0.38 mg L−1, respectively.
1. Introduction
A large amount of analysis in low complexity laboratories is performed using colorimetric determination. Most of these works solve specific problems but are not adapted to traditional laboratory hardware.1–4 Many chemical sensors based on image detection by digital cameras or smartphones have been employed in recent years with the advantage that the latter are widely used.5 It is of utmost importance to check and standardize lighting and capture for reproducible results in this type of sensor.6 A wide variety of devices of various shapes and sizes have been developed: from boxes with external lighting7 to sophisticated systems coupled to the phone through computer interfaces.8 On the other hand, considering that developing countries do not have enough economic resources to purchase adequate instrumentation, new, smart and simple technologies offer a wide potential to provide a solution to supervise the quality of water and food.In order to validate a new device, sulfate and quinine determination were tested. A high concentration of sulfate in drinking water can cause gastrointestinal diseases in children.9 The European Council Directive 98/83/EC10 establishes a tolerance of 250 mgL−1, being gravimetric, nephelometric,11 potentiometric,12 spectrophotometric,13 conductimetric14 and volumetric ones, the commonly used methods for its determination. Quinine is used in the beverage industry, in tonic drinks and ginger ale. This alkaloid has a variety of therapeutic benefits, such as analgesic, anti-pyretic and anti-malarial. However, excessively high plasma concentrations of this compound can cause several health disorders.15 There is a wide variety of techniques which have been developed for its determination such as HPLC with fluorimetric detection,16 capillary electrophoresis using UV detection,17 fluorimetry,18 chemiluminescence,19 atomic absorption spectrometry,20 gas chromatography-mass spectrometry,21 and electrochemical detection.22 Thus, fluorimetric and nephelometric measurements are very common techniques in the analysis of water and beverages. However, versatile devices that provide the ability to perform both determinations using the same device have never been described.
In this work, we present an inexpensive, portable and easy use device for measure fluorescence and nephelometry, determining sulfate in drinking water and quinine in commercial drinks. Sulfate determination was carried out by a nephelometric method using a red LED as a source of light, while quinine was determined by fluorimetry using a blue LED, both employing a new 3D printable device. The results were compared with those obtained with reference methods, demonstrating that the proposed device is effective in the determination of both analytes in real samples in a quick and easy way.
2. Experimental
2.1. Reagents and solutions
Analytical grade chemicals were used to prepare all solutions, and deionized (DI) water (18.0 MΩ.cm) was provided by Milli-Q system (Millipore, Bedford, USA). Stock solutions of quinine sulfate and sodium sulfate (Merck Darmstadt, Germany) were prepared dissolving the appropriate amount of solid in DI water, to obtain concentrations of 50 mg L−1 and 100 mg L−1, respectively. Stock solutions were maintained al 2 °C until their use. Standard solutions of sodium sulfate and quinine sulfate were prepared every day by diluting the stock solutions. Sulfuric acid (1 M), NaCl, BaCl2, ethanol and glycerin were acquired from Merck (Darmstadt, Germany).The conditioning solution was prepared by mixing 50.0 mL of water, 25.00 g of NaCl, 10.00 mL of concentrated HCl 37% m/m (Merck, Darmstadt, Germany), 33.0 mL ethanol, 16.7 mL of glycerine, and finally adding DI water to 100.0 mL.
2.2. Instrumentation
The 3D printable device was designed using the software Autodesk from TinkerCAD (San Rafael, California, USA). After that, a 3D Creality CR-10 printer (Creality 3D Technology, China) was used, employing a 1.75 mm PLA + printing filament from High Quality Speed e-Printing as substrate. Once printed, a rigid, opaque black device was obtained.The device was equipped with interchangeable red (620 nm, 0.06 w, 5 mm, HLMP-EH31-SV000, Hewlett-Packard, Avago Technologies Ltd, Singapore, Singapore) and blue (465 nm, 0.1 w, 8 mm, Patagoniatec, Buenos Aires, Argentina) LEDs for the determination of sulfate and quinine, respectively. A Motorola Moto G5Plus smartphone equipped with a 12 MPixel camera was employed to capture the photos, and the free software ImageJ 1.50i was used to analyze them.
An Agilent 8453 spectrophotometer (equipped with diode array detector) and a JASCO FP-6500 spectrofluorometer (with a xenon lamp) were utilized for validation studies. The UV-vis absorption spectra were recorded at 450 nm and the fluorescence measures were registered at 350 nm and 450 nm as λexcitation and λemision, respectively.
2.3. Image capture
JPEG photos were captured with a Smartphone for the purpose of evaluating the changes in color after chemical reactions. The conditions selected for the capture were: ISO 400, shutter speed 1/3, opening value f/1.53 and focal length of 4.3 mm in the case of sulfate, and ISO 800, shutter speed 1/3, opening value f/1.7 and focal length of 4.3 mm in the case of quinine. In both cases the focus of the camera was set manually to infinite mode.The 3D printable capture device (see Fig. 1) was coupled to the smartphone by means of a bracket, attached to the plastic cover, which standardizes the distance from the cuvette to the camera lens. Once the cuvette was placed, the source was turned on, and the camera configuration parameters were fixed until the determination was completed.
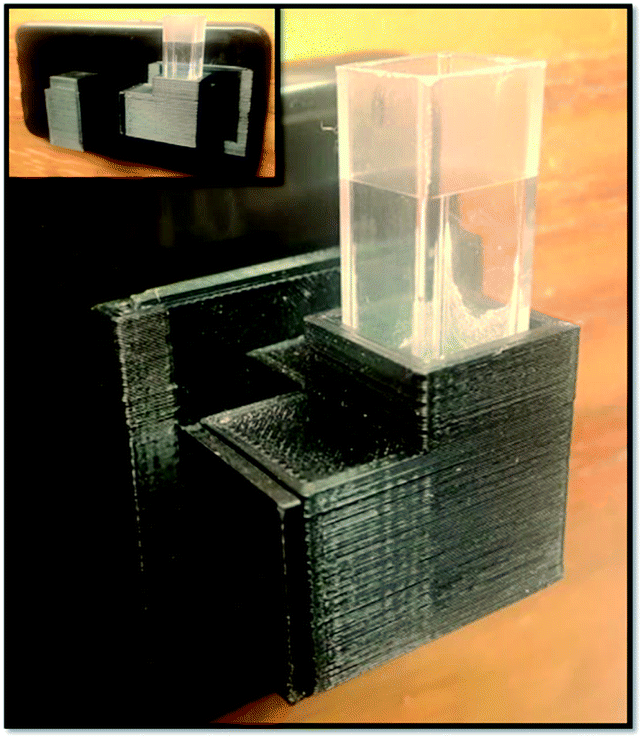 | ||
| Fig. 1 Real photograph of the proposed device. | ||
2.4. Image processing
The JPEG files were processed to find the histograms of the three RGB channels using ImageJ 1.51q software. A single rectangular region of interest (ROI) of 10![[thin space (1/6-em)]](https://www.rsc.org/images/entities/char_2009.gif) 000 pixels was used in every picture.
000 pixels was used in every picture.
The ROI was selected looking for a region with the minimum standard deviation. It was necessary to isolate a homogeneous region to measure it. The specific region was selected, thereby, the black background and the gradient effect along the illuminated region were eliminated. The Macro was created with the Macro Edit function of the software. Firstly, an example image of the determination was opened. The color of the image was split into three different channels (R, G and B). Then, the Analyze Histogram function was run, and the histogram graphic and values were displayed. The Macro function was recorded.
Every image was analyzed separately with the created Macro function (see Fig. S1†). The maximum value of the histogram was selected as an analytical signal. Automatically ROI specification allows to compare the different photographs ensuring that the variations are due only to differences in concentration.
2.5. Samples
For sulfate determination, five samples from different origins were analyzed: surgent water (A), Napostá stream water (B), groundwater from Bahía Blanca (C), and drinking water from San Miguel Arcángel (D) and Coronel Suárez (E) (Fig. 2A and B).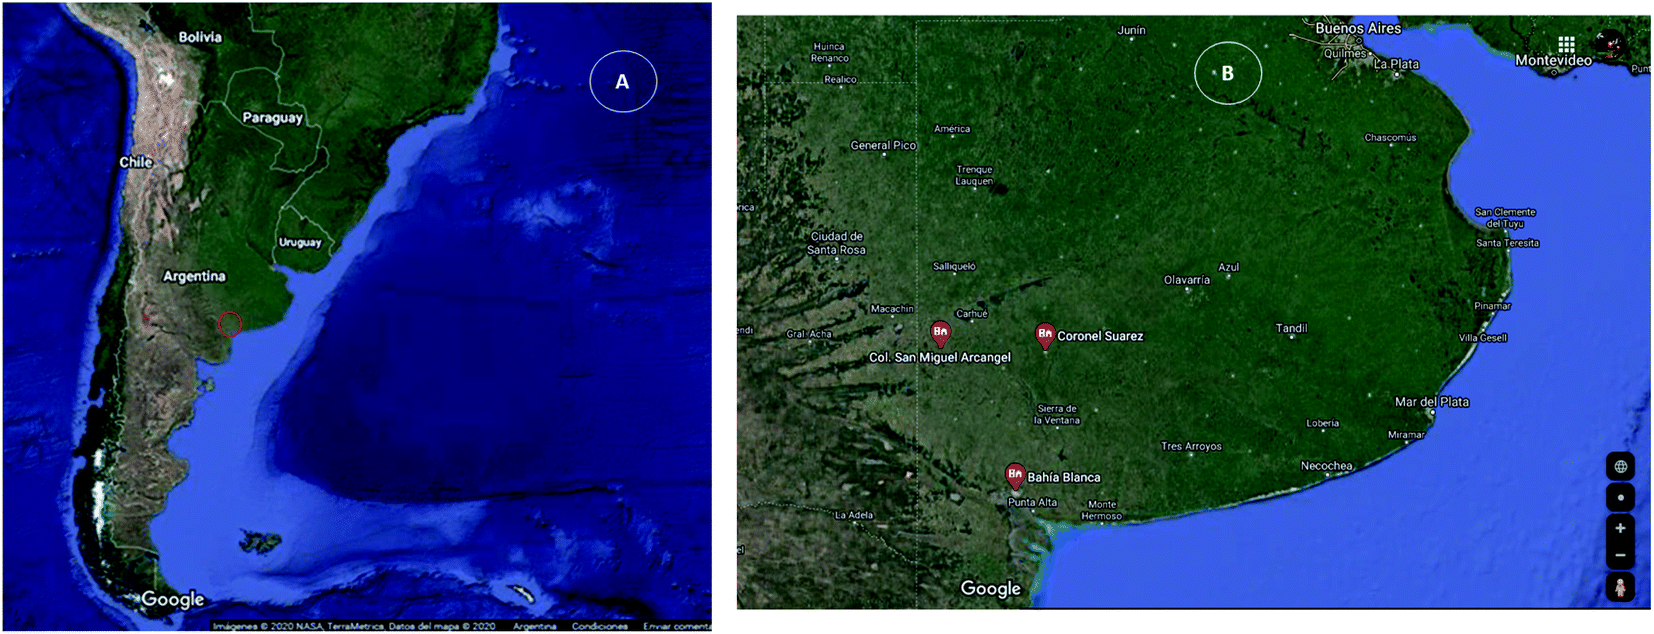 | ||
| Fig. 2 Location of the study area in Argentina (A). Detail of sampling sites (B): Bahia Blanca, Coronel Suarez and San Miguel Arcangel (Buenos Aires, Argentina). | ||
In the case of quinine determination, five tonic drinks (F, G, H, I and J) were purchased in local supermarkets of Bahia Blanca. They were previously degassed, using an ultrasonic bath (TESTLAB model TB 04 TA, 160 W ultrasonic power, 40 kHz frequency).
2.6. Procedure
The standard nephelometric11 and fluorimetric23 reference methods, for sulfate and quinine were employed for the validation study. The above mentioned reagents were also used to test the proposed method.For the sulfate determination, an aliquot of 10.00 mL of sample was placed into a 25.00 mL volumetric flask where 1.0 mL of conditioning solution and 5.0 mL of 5% BaCl2 solution were added for sulfate determination. Five minutes later, the solution became cloudy and pale white. Firstly a blank without reagents was measured to avoid interferences for other sources. The pretreated sample was placed in a 1 cm thick cuvette and then in the capture device. The red LED was turned on, the images were captured and sent to the computer to be analyzed.
In the case of quinine, 2.5 mL of 1 M H2SO4 were placed in a 25.00 mL volumetric flask into which 500 μL of sample were added and filled up to the final volume with water. In this case, it was not necessary to wait for reaction time. The conditioned sample was put into a 10 mm optical path quartz cuvette, and placed in the capture device. The blue LED was turned on and the images were captured and sent to the computer for processing.
2.7. Statistical data analysis
Every parameter of the calibration curves was calculated using Microsoft Office Excel® 2010 (Microsoft, Redmond, WA, USA). Additional statistical calculations were performed using MATLAB®, version 6.5 (The Mathworks, Natick, MA, USA).3. Results and discussion
3.1. Device fabrication
The device was printed in black color (see Fig. 1) to avoid the filtration of light from outside sources during image capture. More details about real dimensions of the device can be seen in Fig. S2† (design files available upon request).In order to adjust the device to the smartphone, a black plastic phone case (Fig. 3i) was used with a sliding support permanently attached to it (Fig. 3c). This support enabled to easily change different device configurations. A movable slide (Fig. 3g) was also built to fit into the support.
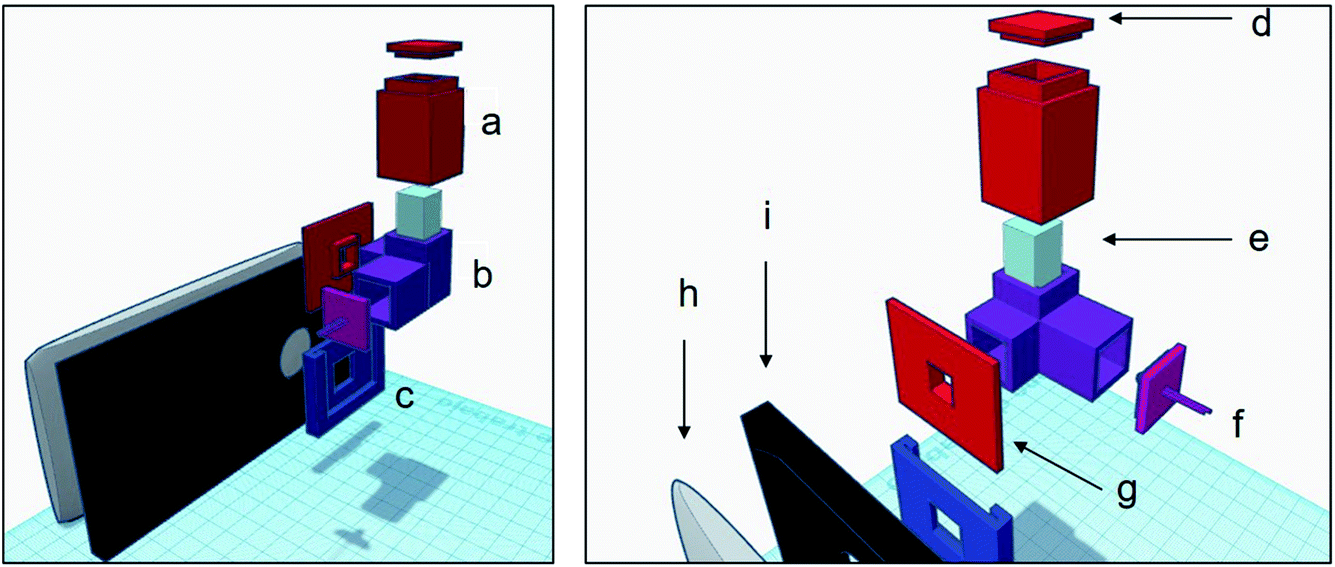 | ||
| Fig. 3 Details of each part of the proposed 3D printable device. Dark cover (a), cuvette holder (b), sliding support (c), top of dark cover (d), cuvette (e), LED light and press-in cover (f), movable slide (g), smartphone (h), plastic phone case (i). The color of the images is illustrative. | ||
A quartz cuvette (Fig. 3e) was placed inside the cuvette holder (Fig. 3b) of the device which had a 6 mm square window facing the camera lens, so that only the central area of the cuvette could be photographed. With a 90 degree angulation, facing the other side, was the 2 mm channel through which the light entered, so as to avoid the LED light dispersion. The LED light was attached to a press-in cover (Fig. 3f) at the end of the channel, connected with alligator clips to the micro USB cable of the smartphone for the measurement process. In order to capture the images, it was necessary to place a dark cover on the cuvette as shown in Fig. 3a and d.
3.2. Optimization
The best color for LED illumination for the determination of both analytes was studied, being blue, red, violet, green and white the lights tested. Red LED (620 nm) was chosen for sulfate assays to avoid absorption processes al lower wavelengths.24 Blue LED was the adequate for quinine because that wavelength intensified fluorescence intensity (see Fig. S3†).Optimal dimensions of the device were studied using different accessories printed in the same way as the device. With the proposed accessories, different distances could be tested between the camera and the cuvette, and between the light source and the cuvette (see Fig. S4†). Different configurations of the device generated distances of 20, 28, 37, 42 and 56 mm for the capture channel, and 14, 22, 33 and 40 for the lighting channel. When studying the distance of the illumination channel, the capture channel was kept steady at the smaller value. The same procedure was carried out when studying the distance of the capture channel. Based on the Gintensity for sulfate and the Bintensity for quinine, 20 and 14 mm were chosen as the best distance for the capture and for the illumination channel respectively. Shorter capture distances produce a permanent unfocused image, preventing the possibility of adjusting that parameter. In the design of the device it can be seen that the illumination channel has a longitudinal cylinder. That small tube works as a simple collimator letting partially coherent light pass. If the distance between the light and the channel is smaller, the image illumination is disperse, and the values saturate the detector.
3.3. Analytical performance
The calibration curve for sulfate standard solutions was built using the blue channel as response (Blueint = (1.28 ± 0.05) [SO4−, mg L−1] + (3.47 ± 1.30)), at concentration ranged from 2.0 to 50.0 mg L−1 (number of standard solutions (N) = 5, number of replicates (n) = 3). The determination coefficient, calculated based on the calibration curve, was R2 = 0.992. Besides, the detection and quantification limits (LOD and LOQ), calculated in accordance with IUPAC,25 were 0.13 mg L−1 and 0.43 mg L−1, respectively. The values of the relative standard deviation (% RSD) were obtained from 3 independent determinations of each sample (parallel analysis). Repeatability (intraday) was evaluated, the values obtained were lower than 1.2% for all analyzed samples.For quinine analysis, a good linearity was obtained (from 0.42 to 3.10 mg L−1) with a signal corresponding to the intensity of the green channel. The corresponding equation, after applying the regression analysis, was GreenInt = (63.52 ± 2.40) [QN, mg L−1] + (6.56 ± 3.45), with a R2 of 0.994 (N = 5, n = 3), indicating a good linear fit. Assessed as the same way as sulfate, the LOD and LOQ were 0.11 mg L−1 and 0.38 mg L−1 respectively. The % RSD values were 2.1% from 3 repetitions for each sample, in terms of repeatability (intraday).
In Fig. 4 the real photographs of each point of the calibration plots and the corresponding curves are shown.
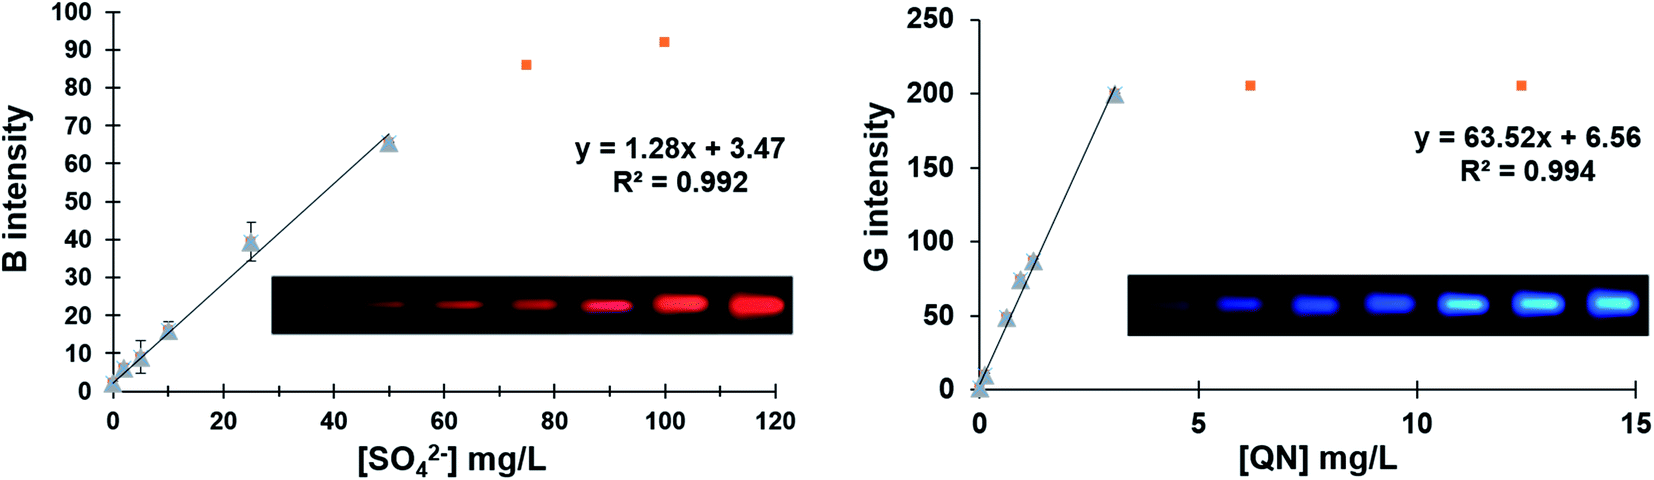 | ||
| Fig. 4 Real photographs of each point of the calibration plots and the corresponding curves for sulfate and quinine standards (including non-linear region). | ||
3.4. Analysis of real samples
In order to assess the applicability of the proposed device, five samples of commercial tonic drinks and five water samples of different origins (see Section 2.5) were analyzed. The obtained results are shown in Table 1, and they were regressed on the results obtained by the nephelometric and fluorimetric reference methods for sulfate and quinine, respectively. Therefore, a straight line is expected. An appropriate technique to perform the regression would be Bivariate Least Squares (BLS). This technique considers errors in both axes.| Sample | Sulfate | Sample | Quinine | ||
|---|---|---|---|---|---|
| Proposed methoda | Reference methoda | Proposed methoda | Reference methoda | ||
![[X with combining macron]](https://www.rsc.org/images/entities/i_char_0058_0304.gif) ± SD ± SD |
± SD |
± SD |
± SD |
||
| a : average (mg L−1); SD: standard deviation (mg L−1) (n = 3). |
|||||
| A | 499.98 ± 0.02 | 452.33 ± 0.32 | F | 31.91 ± 0.30 | 31.63 ± 0.22 |
| B | 75.93 ± 0.05 | 81.03 ± 0.15 | G | 29.30 ± 0.40 | 32.88 ± 0.32 |
| C | 283.50 ± 0.01 | 284.56 ± 0.03 | H | 20.04 ± 0.53 | 22.91 ± 0.48 |
| D | 61.32 ± 0.14 | 55.16 ± 0.09 | I | 7.70 ± 0.15 | 8.83 ± 0.22 |
| E | 247.55 ± 0.13 | 261.80 ± 0.08 | J | 5.47 ± 0.29 | 5.93 ± 0.20 |
Using the proposed device the obtained results were plotted versus the values obtained by the reference methods and the bivariate least square technique gave the following straight regression lines: [proposed device] = 1.14[reference method] −0.03 μg L−1 for sulfate and [proposed device] = 0.96[reference method] − 0.0008 μg L−1 for quinine, with a slope near 1 and an intercept near 0.
So as to test if significant differences exist between the theoretical values of zero intercept and unity slope and the regression coefficients, the joint confidence interval test for slope and intercept could be used (Fig. 5).26,27 This test confirms the presence of the theoretical point zero intercept and unity slope within the limits of the elliptical-shaped joint confidence region centered on the slope and intercept values of the straight regression line obtained. The results showed (see Fig. 5) no significant statistical difference between the reference values and those obtained by the proposed method, considering an α = 0.05 as the significance level.
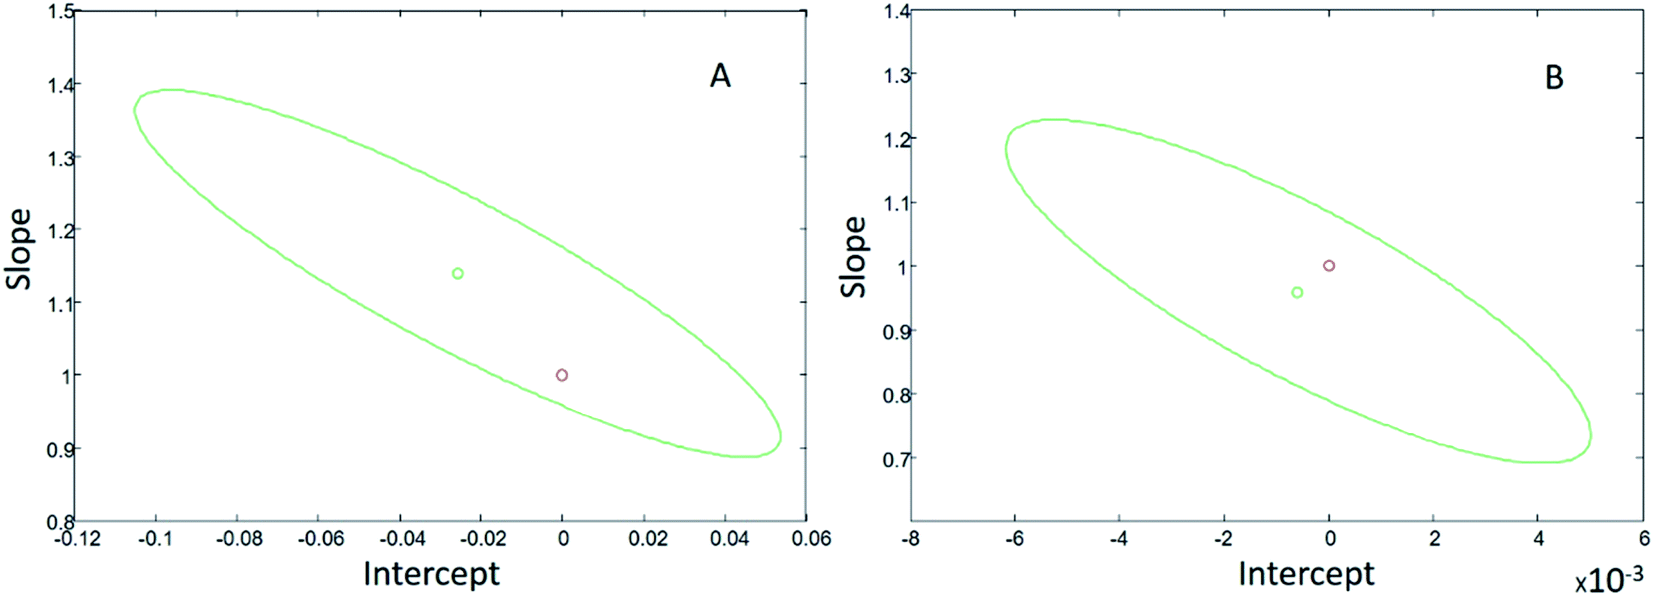 | ||
| Fig. 5 Elliptical joint confidence region for the BLS regression for the real samples studied in this work at a significance level of 5%. The green circle (o) represents the obtained values for the slope and intercept, and the red circle (o) corresponds to the theoretical value of zero intercept and unity slope for sulfate (A) and quinine (B). | ||
In comparison with other works (see Table 2), it is the first time that a device has developed for two different techniques in one single low complexity gadget. Moreover, it could be used in remote analysis since it is totally transportable and it is very inexpensive because it only needs a 3D printing store and it does not require the use of a diffraction grating, extra optical lenses or collimators. All these characteristics make it a very promising option for routine analysis opening the doors toward new devices for “point-of-need” assays.
| Technique | Analyte | Sensing | Light source | Sample reservoir | Sample matrix | Working range | Optics | Reference |
|---|---|---|---|---|---|---|---|---|
| Colorimetric | Streptomycin | Smartphone | LED | Cuvette | Honey, milk, water | 50 to 267 nM | Diffuser | 28 |
| Colorimetric | Iron(II), hypochlorite | Webcam, notebook | LED | Cuvette | Water | 0–50 mg L−1 iron, 0–1.7 mg L−1 hypochlorite | — | 29 |
| Fluorimetric | Fluorescein, quinine, calcium, rivoflavine, etc. | Smartphone | LED | Cuvette | Beer, white wine, energy drinks, and multivitamin supplement | Up to 5 mg L−1 | Lens | 30 |
| Colorimetric | Colored cherry flavored drink powder (as a demonstration purposes) | Smartphone | Desk lamp, flashlight or LED | Cuvette | Water | 0.0625 mg mL−1 to 2.0 mg mL−1 | Diffraction grating | 31 |
| Turbidimetric | Formazin standard solutions | Smartphone | Smartphone flash | Vial | River water | 0–40 NTU | Diffraction grating | 32 |
| Turbidimetric | Formazin standard solutions | Smartphone | LED | — | Natural and drinking water | 0–400 NTU | Collimator, IR filter | 33 |
| Fluorimetric and nephelometric | Sulfate and quinine | Smartphone | LED | Cuvette | Drinking natural water and commercial drinks | 2–50 mg L−1 sulfate, 0.42–3.10 mg L−1 quinine | — | This work |
4. Conclusions
The designed device forms a versatile, inexpensive and portable detection system. It is an excellent option for nephelometric and fluorimetric determinations in real beverages and water samples by a fast and accurate way. In comparison with the reference fluorimetric and nephelometric methods, which require non-portable laboratory equipment, the proposed method applies the same chemical reagents, providing a portable and inexpensive system for on-site determinations, especially in resource limited regions.The device was developed using 3D printing technology and employing smartphone camera to complete the determination. This type of device provides enormous potential for “in situ” environmental and food control determinations. The possibility of having diverse radiation sources expands the possible applications of this system, using only the camera of a smartphone as a capture device.
Described device could be adapted to any type of smartphone. This kind of system could be applied for various uses such as chemiluminescent reactions or reading of paper-based analytical microdevices (μPAD).
In this work the device was able to determine the concentration of quinine in tonic drinks, as well as the concentration of sulfate in drinking water samples below the maximum values allowed by the European Council Directive 98/83/EC.
Conflicts of interest
The authors declare that they have no known competing financial interests or personal relationships that could have appeared to influence the work reported in this paper.Acknowledgements
Financial support from Universidad Nacional del Sur is gratefully acknowledged. A.S. Lorenzetti and C.E. Domini wish to thank Consejo Nacional de Investigaciones Científicas y Técnicas (CONICET).References
- K. E. McCracken, T. Tat, V. Paz and J.-Y. Yoon, RSC Adv., 2017, 7, 9237–9243 RSC.
- S. Dutta, K. Saikia and P. Nath, RSC Adv., 2016, 6, 21871–21880 RSC.
- Y. Wen, D. Kuang, J. Huang and Y. Zhang, RSC Adv., 2017, 7, 42339–42344 RSC.
- A. Motalebizadeh, H. Bagheri, S. Asiaei, N. Fekrat and A. Afkhami, RSC Adv., 2018, 8, 27091–27100 RSC.
- P. Kassal, E. Horak, M. Sigurnjak, M. D. Steinberg and I. M. Steinberg, Rev. Anal. Chem., 2018, 37, 1–27 Search PubMed.
- K. E. McCracken and J.-Y. Yoon, Anal. Methods, 2016, 8, 6591–6601 RSC.
- E. Vidal, A. S. Lorenzetti, A. G. Lista and C. E. Domini, Microchem. J., 2018, 143, 467–473 CrossRef CAS.
- S. Kanchi, M. I. Sabela, P. S. Mdluli, Inamuddin and K. Bisetty, Biosens. Bioelectron., 2018, 102, 136–149 CrossRef CAS PubMed.
- A. Ayala, L. O. Leal, L. Ferrer and V. Cerdà, Microchem. J., 2012, 100, 55–60 CrossRef CAS.
- Council Directive, Off. J. Eur. Communities, 1998, L330, 32–54 Search PubMed.
- W. P. C. F. American Public Health Association, Am. Water Works Assoc., 2017, pp. 4–199.
- S. V. Lomako, R. I. Astapovich, O. V. Nozdrin-Plotnitskaya, T. E. Pavlova, S. Lei, V. A. Nazarov, E. B. Okaev, E. M. Rakhmanko and V. V. Egorov, Anal. Chim. Acta, 2006, 562, 216–222 CrossRef CAS.
- J. G. Ortiz-Tena, B. Rühmann and V. Sieber, Anal. Chem., 2018, 90, 2526–2533 CrossRef CAS PubMed.
- J. Rodier, Análisis de las aguas: aguas naturales, aguas residuales, agua de mar; química, fisicoquímica, bacteriología, biología, Omega, 1990 Search PubMed.
- W. R. J. Taylor and N. J. White, Drug Saf., 2004, 27, 25–61 CrossRef CAS PubMed.
- V. F. Samanidou, E. N. Evaggelopoulou and I. N. Papadoyannis, J. Pharm. Biomed. Anal., 2005, 38, 21–28 CrossRef CAS PubMed.
- W. Zhao, Y. Li, Y. Zhang, H. Zhang, H. Yu and A. Chen, Anal. Lett., 2016, 49, 1176–1183 CrossRef CAS.
- S. Pandey, T. L. Borders, C. E. Hernández, L. E. Roy, G. D. Reddy, G. L. Martinez, A. Jackson, G. Brown and W. E. Acree, J. Chem. Educ., 1999, 76, 85 CrossRef CAS.
- B. Li, Talanta, 2000, 51, 515–521 CrossRef CAS.
- M. C. Yebra and R. M. Cespón, Microchem. J., 2000, 65, 81–86 CrossRef CAS.
- R. Damien, S. Daval, B. Souweine, P. Deteix, A. Eschalier and F. Coudoré, Rapid Commun. Mass Spectrom., 2006, 20, 2528–2532 CrossRef CAS PubMed.
- M. Buleandra, A. A. Rabinca, M. C. Cheregi and A. A. Ciucu, Food Chem., 2018, 253, 1–4 CrossRef CAS PubMed.
- J. E. O'Reilly, J. Chem. Educ., 1975, 52, 610–612 CrossRef PubMed.
- M.-F. Pouet, N. Azema, E. Touraud and O. Thomas, in Techniques and Instrumentation in Analytical Chemistry, 2007, vol. 27, pp. 145–162 Search PubMed.
- D. L. Massart, B. G. Vandeginste, L. M. C. Buydens, S. De Jong, P. J. Lewi, J. Smeyers-Verbeke and C. K. Mann, Handbook of chemometrics and qualimetrics: part A, Amsterdam, The Netherlands, 1998 Search PubMed.
- N. E. Llamas, M. Garrido, M. S. Di Nezio and B. S. F. Band, Anal. Chim. Acta, 2009, 655, 38–42 CrossRef CAS PubMed.
- Analytical Methods Committee, A. N. 87, Anal. Methods, 2019, 11, 1845–1848 RSC.
- Z. Liu, Y. Zhang, S. Xu, H. Zhang, Y. Tan, C. Ma, R. Song, L. Jiang and C. Yi, Anal. Chim. Acta, 2017, 966, 81–89 CrossRef CAS PubMed.
- K. Danchana, P. Phansi, C. T. de Souza, S. L. C. Ferreira and V. Cerdà, Talanta, 2020, 206, 120250 CrossRef CAS PubMed.
- M. Granica and Ł. Tymecki, Talanta, 2019, 197, 319–325 CrossRef CAS PubMed.
- E. K. Grasse, M. H. Torcasio and A. W. Smith, J. Chem. Educ., 2016, 93, 146–151 CrossRef CAS.
- A. Bayram, E. Yalcin, S. Demic, O. Gunduz and M. E. Solmaz, Appl. Opt., 2018, 57, 5935 CrossRef CAS PubMed.
- I. Hussain, K. Ahamad and P. Nath, RSC Adv., 2016, 6, 22374–22382 RSC.
Footnotes |
| † Electronic supplementary information (ESI) available. See DOI: 10.1039/d0ra02975k |
| ‡ These authors contributed equally. |
| This journal is © The Royal Society of Chemistry 2020 |