 Open Access Article
A flower-like ZnO–Ag2O nanocomposite for label and mediator free direct sensing of dinitrotoluene†
Urmila
Chakraborty
a,
Gaurav
Bhanjana
a,
Jost
Adam
 b,
Yogendra Kumar
Mishra
 b,
Gurpreet
Kaur
 *a,
Ganga Ram
Chaudhary
 *ac and
Ajeet
Kaushik
 *d
*d
aDepartment of Chemistry, Centre of Advanced Studies in Chemistry, Panjab University, Chandigarh, 160014, India. E-mail: gurpreet14@pu.ac.in; grc22@pu.ac.in
bMads Clausen Institute, University of Southern Denmark, Alsion 2, 6400, Sønderborg, Denmark
cSophisticated Analytical Instrumentation Facility (SAIF)/CIL, Panjab University, Chandigarh, 160014, India
dNanoBioTech Laboratory, Department of Natural Sciences, Division of Science, Arts & Mathematics, Florida Polytechnic University, Lakeland-33805, Florida, USA. E-mail: akaushik@floridapoly.edu
First published on 27th July 2020
Abstract
2,4-Dinitrotoluene (2,4-DNT) is a nitro aromatic compound used as a raw material for trinitrotoluene (TNT) explosive synthesis along with several other industrial applications. Easy, rapid, cost-effective, and selective detection of 2,4-DNT is becoming essential due to its hepato carcinogenic nature and presence in surface as well as ground water as a contaminant. Keeping this in view, this research, for the first-time, reports the synthesis of novel ZnO–Ag2O composite nanoflowers on a gold (Au) substrate, to fabricate an electrochemical sensor for label-free, direct sensing of 2,4-DNT selectively. The proposed ZnO–Ag2O/Au sensor exhibits a sensitivity of 5 μA μM−1 cm−2 with a low limit of detection (LOD) of 13 nM, in a linear dynamic range (LDR) of 0.4 μM to 40 μM. The sensor showed reasonably high re-usability and reproducibility, with reliable results for laboratory and real-world samples.
Introduction
Nitro aromatic compounds are classified as a group of organic molecules consisting of an aromatic ring with at least one nitro group (–NO2) attached and are part of the volatile organic compounds (VOCs) family. Nowadays, these compounds are among the most widely used industrial chemicals, finding extensive applications in drugs, pesticides, explosives, and chemical industries. Because of their extensive use, these compounds lead to severe air, soil and groundwater contaminations. Just as an example, approximately 5.1 and 1.1 metric tons of nitrobenzene and 2,4-dinitrotoluene respectively were released into the soil only in USA in 2002.1 These chemicals are mutagenic, carcinogenic and acutely toxic in nature.1 2,4 Dinitrotoluene (2,4-DNT) is a nitro aromatic compound used as an intermediate for the synthesis of urethane foam, in airbags of automobiles, in munition industries as a modifier for smokeless powder and also as a starting material for the synthesis of explosive 2,4,6 trinitrotoluene.2 The DNT is commonly found in soil, surface water and ground water from hazardous debris buried at and around ammunition waste sites. The 2,4-DNT is generally discharged into the environment due to the process and manufacturing facilities and therefore may significantly contaminate the surface and ground water during run offs.2 Additionally, the detection of 2,4-DNT from aqueous samples is of high significance due to its heptocarcinogenicity.3 The environmental protection agency (EPA) has found the screening levels of 2.4 × 10⁻¹ μg L−1 for 2,4-DNT regarding tap water.4Various sensing techniques such as electrochemical sensing,5 fluorimetric detection,6 bacterial bioreporters,7 surface enhanced-Raman scattering (SERS),8 are in practice for the quantitative and qualitative determination of 2,4-DNT. Among these techniques, electrochemical sensing is an easy, cost effective and reliable method for the detection of organic pollutants from the aqueous medium. Various kinds of materials, like the metal and metal oxide-based nanomaterials,9–12 carbon-based nanomaterials,13 molecular imprinted polymers (MIP),14 and aptamer-based materials,15 have been utilized to modify the electrode surface in order to enhance the sensing performance of the electrochemical sensors. Bimetallic nanoparticles, metal and metal oxide-based nanoparticles and nanocomposites, etc. show quantum effects, greater catalytic activities, and low electron transfer resistance on the solid electrode surface. Such properties possessed by these materials can be attributed to a large surface area to volume ratio, resulting in the surface having a greater number of active atoms.16–18 Nanostructured metal oxides have also shown great potential in biosensing applications.19,20 Hence, metal oxide-based nanocomposites can be used as suitable materials for electrode modification. Recently, ZnO-based nanocomposites have gained considerable attention among scientific community.21 ZnO is an n-type (II–IV) semiconductor material with a wide band gap (3.37 eV) and large exciton binding energy (∼60 meV).12 It has gained wide consideration due to its multifunctional properties, rendering it a suitable material for applications like solar cells, electronics, sensors and actuators.12 Nowadays, ZnO-based nanomaterials are being used as efficient materials for the fabrication of highly selective and sensitive electrochemical sensors.22,23 ZnO nanoparticles have also been used in efficient biosensors due to their high catalytic efficiency, nontoxicity, high surface area.24,25 To improve the electrical, semiconducting and other physico–chemical properties of ZnO nanomaterials, various methods like doping with metal ions, and noble metals, formation of nanocomposites, loading with other p- or n-type metal oxide nanomaterials have been suggested in numerous reports.26 Ag2O is a p-type semiconducting material with a band gap ∼1.3 eV. In previous reported literature, the Ag2O has been utilized for nanocomposite formation with ZnO. In their work, Ma et al. have synthesized ZnO/Ag2O heterostructures, and explored their UV and visible photocatalytic activities. This heterostructured material displayed enhanced photocatalytic activity due to the formation of a p–n nanoheterojunction between the p-type Ag2O and the n-type ZnO nanomaterials.27 In another report, Kadam et al. have investigated ZnO/Ag2O nanocomposite-based highly efficient visible light photocatalyst for the degradation of methyl orange dyes.28 Thus the photocatalytic performance of the ZnO/Ag2O nanohybrid materials have been well scrutinized, but to the best of our literature knowledge, the electrocatalytic properties of such nanocomposites are still open to be explored in detail.
In the present work, we have attempted to study the electrocatalytic properties of a composite nanomaterial of ZnO and Ag2O. We have synthesized novel ZnO–Ag2O composite nanoflowers using a cost-, energy- and time-efficient chemical synthesis method (without the use of any capping or stabilizing agent). The synthesis was carried out in an aqueous medium, without the use of any toxic organic solvents, which is a greener approach to synthesize herein proposed nanoparticles.16 As mentioned above, the detection of 2,4-DNT from water sources is of utmost importance. Keeping this in view, the ZnO/Ag2O composite nanoflowers were utilized, for the first time, for the electrochemical sensing of 2,4-DNT in aqueous samples, using cyclic voltammetric (CV) and differential pulse voltammetric (DPV) techniques. In previous works, Toh et al.,29 and Yew et al.,30 have reported the electrochemical detection of 2,4 DNT in aqueous media, but the efficient electrocatalytic activity was observed under alkaline conditions. Similarly, Fierke et al.,31 Dutta et al.,32 and Caygills et al.,33 have displayed the detection of 2,4 DNT in neutral (pH 7) aqueous samples, but the observed limit of detection value was higher than reported in this present work. In our present work, the electrode modified by ZnO/Ag2O composite nanoflowers exhibited an effective detection of 2,4-DNT in neutral pH aqueous samples, with a very low limit of detection as compared to previous reports, and it also exhibited competent performance in real water samples. Hence, ZnO/Ag2O composite nanoflowers have been utilized as potential electro-catalyst for the detection of 2,4-DNT. Thus, this present research work explores the scope for utility of such metal oxide composite nanomaterials for the electrochemical detection of nitroaromatic explosive compounds.
Experimental section
Chemicals
Silver nitrate (AgNO3, ≥99%), zinc acetate dihydrate (C4H6O4Zn, ≥98%), 2,2-bis(4-hydroxyphenyl)propane (bisphenol A, (CH3)2C(C6H4OH)2, ≥99%), Nafion® per fluorinated resin solution, sodium phosphate monobasic (NaH2PO4, ≥99%), sodium phosphate dibasic (Na2HPO4, ≥99.95%), 2,4-dinitrotoluene (2,4-DNT, CH3C6H3(NO2)2 = 97%), resorcinol (C6H4-1,3-(OH)2, ≥99%), hydroquinone (C6H4-1,4-(OH)2, ≥99%), pyrocatechol (catechol, C6H4-1,2-(OH)2, ≥99%), potassium ferricyanide (C6N6FeK3, ≥99%) and sodium chloride (NaCl, ≥99%) were bought from Sigma-Aldrich, India. Zinc sulphate (ZnSO4·7H2O ≥ 99%) was purchased from Qualikems Fine Chem Pvt. Ltd., India; potassium chloride (KCl, ≥99.5%) was bought from Qualigens Fine Chemicals, India. Calcium chloride (CaCl2), sodium hydroxide (NaOH, ≥97%), hydrochloric acid (HCl) and sulphuric acid (H2SO4) were purchased from Fisher Scientific. Ethanol was bought from Changshu Yangyuan Chemical Co. Ltd., China. All the experiments were performed using double distilled water (DDW).Instrumentation for characterization
Different techniques were used to resolve the optical, structural and compositional properties of the synthesized nanoparticles. The particle size and morphology estimation were performed using high resolution-transmission electron microscopy (HR-TEM; JEM-2100 Plus electron microscope, JEOL Ltd.), the morphology was further determined using field emission scanning electron microscopy (FE-SEM; Hitachi SU8010). The elemental composition was analyzed using energy dispersive spectroscopy attached with the FE-SEM (EDS; Bruker Quantax XFlash® 6|30). The purity and crystalline nature of nanoparticles was determined by powder X-ray diffractometry (XRD; PAN analytical Xpert Pro) in the range of 0° to 90°, utilizing Cu-Kα (λ = 0.154 nm) radiation. Identification of the nanoparticles was done using Fourier transform infrared spectroscopy (FT-IR; Perkin Elmer-Spectrum RX-IFTIR) at room temperature in a range of 400 cm−1 to 4000 cm−1. The optical properties of the nanomaterials were determined using photoluminescence spectrometer (PLS; Shimadzu spectrofluorophotometer (RF 5301PC)). The UV-Visible spectrum measurements of the nanoparticles were completed using JASCO V-530 UV-Visible spectrophotometer. Particle size and dispersion estimation was carried out using dynamic light scattering (DLS; Malvern Zetasizer Nano-S90). The nanomaterials were synthesized using a microwave (MW) with 800 W power.Synthesis of Zno–Ag2O composite nanoflowers
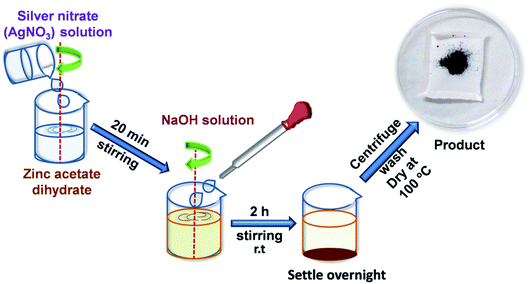
50 ml solutions each of 0.02 M zinc acetate dihydrate and 0.018 M silver nitrate were prepared in DDW. A solution of silver nitrate was added drop wise to the zinc acetate dihydrate solution and the mixture was kept for 20 minutes of stirring. 50 ml of 0.05 M NaOH solution was added drop wise to the mixture with constant stirring followed by 2 hours of stirring at room temperature (25 °C). Then the resulting precipitates were allowed to settle overnight. These precipitates were centrifuged and washed several times with DDW and ethanol followed by drying at 100 °C for 4 hours to obtain the nanoparticles. Pure Ag2O and ZnO nanoparticles were also synthesized by the similar method. A schematic synthesis procedure flowchart is represented in Scheme 1.The initial nanoflower formation process begins with the precipitation of Zn(OH)2. These Zn(OH)2 species being considerably soluble in water, dissolves to form Zn(OH)42− ions. When the concentration of these ionic species exceeds the critical super saturation level, precipitation of ZnO nuclei starts.34 This process is shown below:
| Zn2+ + 2OH− → Zn(OH)2(ppt) |
| Zn(OH)2 + 2OH− → Zn(OH)42− |
| Zn(OH)42− → ZnO(ppt) + H2O + 2OH− |
Initially, the single ZnO nuclei crystals are aggregated together. Subsequently, each nucleus in the aggregate undergoes anisotropic growth, which results in the arrangement of a flower-like structure.35 The concentration of NaOH plays an important role in deciding the nanostructure morphology. When the pH value is kept basic (9–11), enough OH− is supplied desired for the nucleation of ZnO and the anisotropic growth of crystals for the nanoflower formation. The flower-like nanostructure formation is also facilitated by water as a solvent, because this reaction medium helps to homogeneously distribute the reactants, and it also controls the extent of individual nucleus formation, and preferable direction for nucleus growth.36 The silver nitrate (AgNO3) precursor reacts with OH− to form AgOH, which result in the formation of spherical Ag2O nanoparticles as shown below:
| AgNO3 + OH− → AgOH |
| 2AgOH → Ag2O + H2O |
These nanoparticles attach on the of ZnO nanoflower surface, resulting in the formation of ZnO–Ag2O composite nanoflowers.
Fabrication of the Zno–Ag2O composite nanoflowers coated electrochemical sensor
The gold electrode was polished using an electrode polishing kit, and then cleaned with dilute H2SO4 solution, acetone and DDW using ultrasonication. The electrode was modified by coating the electrode using optimized amount (5 μL) of slurry prepared by a solution of ZnO–Ag2O composite nanoflowers (1 mg) in ethanol (0.225 ml), and 10 μL nafion as a binder. The electrode was dried completely at 60 °C. The details of the process used for optimization of the amount of coating have been provided in the ESI and have been given in Fig. 1S.†Electrochemical sensing of 2,4-DNT
Electrochemical measurements were performed using differential pulse voltammetry (DPV) and cyclic voltammetry (CV) techniques using μ-Autolab PGSTAT (Metrohm) attached to a PC with NOVA 1.10 software. The three-electrode system consisting of a working electrode (bare and nanoparticles coated gold electrode), an Ag/AgCl, KCl (3 M) reference electrode, and a platinum counter electrode were used for the measurements. All the experiments were carried out in triplicates. The electrode area was calculated by recording the CV at different scan rates (20–150 mV s−1) using the modified working electrode for solution of 0.1 mM potassium ferricyanide (in 0.1 M KCl) and then plotting the peak current (Ip) versus the square root of the scan rate (ν1/2). The slope value obtained from this plot was used for the electrode surface area calculation, using the Randles–Sevcik equation. Detailed information for this process, including the scan rate voltammograms and an Ipversus ν1/2 plot, are shown in Fig. 2S(a and b) (ESI†). All the DPV measurements were carried out at conditioning potential of 0.00 V, conditioning time of 5 seconds, modulation time 0.05 seconds, step potential −0.005 V and modulation amplitude 0.025 V. All the electrochemical measurements were done in 0.1 M phosphate buffer solution (PBS, pH 7) as supporting electrolyte, unless otherwise stated. Real water samples were filtered and diluted with 0.1 M phosphate buffer solution (25 ml) prior to the real sample studies.Results and discussions
Morphological evaluations of ZnO–Ag2O composite nanoflowers
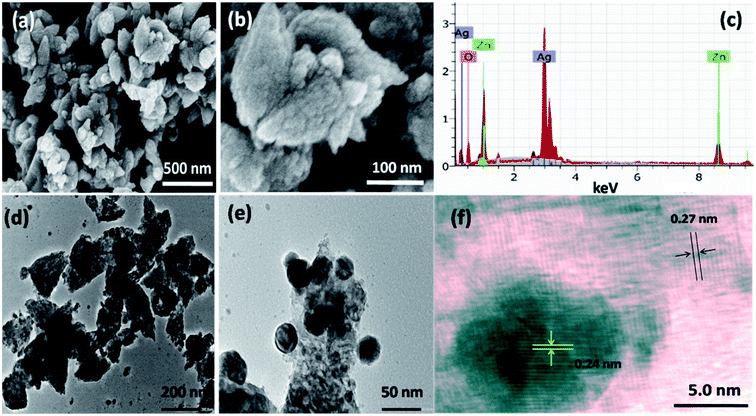
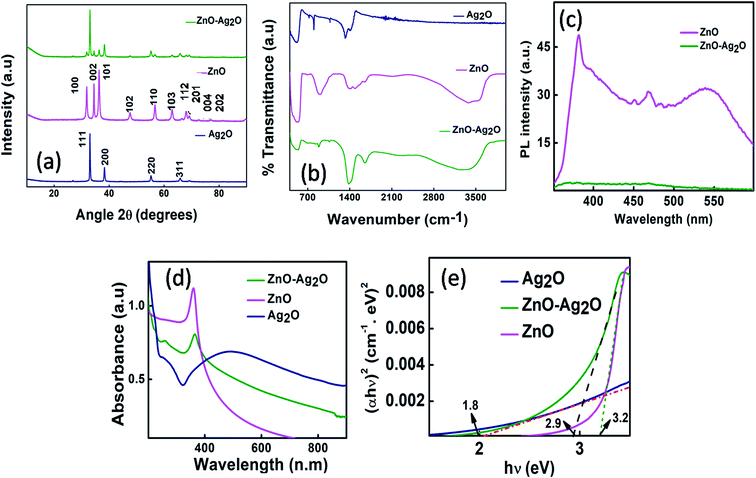
To evaluate the nanostructure morphology, field emission scanning electron microscopy (FE-SEM, as Fig. 1a and b) imaging was conceded, which showed the formation of well dispersed and crystalline nanoparticles comprising a flower-like morphology. The images also revealed nanoparticles with consistent and uniform particle distribution. Formation of pure nanocomposite without the presence of any other impurities was analyzed using energy dispersive spectroscopy (EDS) attached with the FE-SEM, and it showed peaks only associated with Zn, Ag, and O (Fig. 1c). Further, the uniformly distributed nanoflowers were clearly visible via low magnification high resolution transmission electron microscope (HR-TEM) images as shown in Fig. 1d. At higher magnification, it was observed that the spherically shaped silver oxide (Ag2O) nanoparticles (average diameter 25–30 nm) were strongly attached on the petals of the zinc oxide (ZnO) nanoflowers, thus forming the ZnO–Ag2O heterostructure (Fig. 1e). The petals had a rough surface with average length of 150–200 nm and width of 100–120 nm. The strong attachment of the Ag2O nanoparticles was evident as the particles were still attached to the surface of the petals after the ultrasonication for more than 30 minutes. Lattice fringes of ZnO and Ag2O were visible for the composite nanoflowers (Fig. 1f) and these were measured to give the interplanar spacing of ∼0.27 nm corresponding to the (002) plane for ZnO (hexagonal wurtzite) and ∼0.24 nm, which could correspond to the (200) plane of cubic phase of Ag2O.37The X-ray diffraction (XRD) patterns of the pure nanoparticles and composite nanostructure were recorded at room temperature to evaluate structural properties and purity. The XRD patterns of pure ZnO, Ag2O nanoparticles and the ZnO–Ag2O composite nanoflowers are exposed in Fig. 2a. The reflection planes at 33.03°, 38.28°, 55.25°, 65.77° observed in the XRD spectrum of Ag2O correspond to 111, 200, 220 and 311 crystal planes respectively, showing the fabrication of pure Ag2O nanoparticles of cubic symmetry (JCPDS 75-1532).38 Besides ZnO nanoparticles exhibited diffraction peaks at 2θ = 31.71°, 34.27°, 36.12°, 47.66°, 56.58°, 62.96°, 66.46°, 67.9°, 69.02°, 72.7°, 77.2° correspond to 100, 002, 101, 102, 110, 103, 112, 201, 004, 202 crystal planes respectively of hexagonal wurtzite ZnO (JCPDS 36-1451).39
In case of ZnO–Ag2O composite, no major shifts in the peak positions were located as compared to pure ZnO and Ag2O nanoparticles. This confirms that the composite comprises both the hexagonal wurtzite phase of ZnO and the cubic phase of Ag2O. The peak intensity (in the composite spectrum) reflects a greater presence of the cubic phase Ag2O as compared to the ZnO phase in the nanocomposite. Also, the nonappearance of any additional peaks in the XRD spectra shows the absence of any other kind of impurities in the ZnO–Ag2O composite nanoflowers. The Debye Scherrer formula (eqn (1)) was used for the most intense peak (111) to calculate the average crystallite particle size.
D = kλ/β![[thin space (1/6-em)]](https://www.rsc.org/images/entities/char_2009.gif) cos cos![[thin space (1/6-em)]](https://www.rsc.org/images/entities/char_2009.gif) θ θ | (1) |
Here, β denotes the full width at half maximum (FWHM) and θ represents Bragg's angle (in radians), D is the mean particle diameter for the most intense XRD peak (111), k is the shape factor (0.94 for spherical shapes), and λ denotes the wavelength of X-rays used for the analysis (0.154 nm). The mean crystallite particle size was found to be 34.61 nm.
Fourier transform infrared (FTIR) spectra of synthesized ZnO–Ag2O composite nanoflowers and the pure Ag2O and ZnO nanoparticles are shown in Fig. 2b. The peaks near 550 cm−1 could be attributed to the Zn–O and Ag–O vibrations. Peaks near 850 cm−1 were due to the bending vibrational modes of coordinated water molecules and those from 1350 cm−1 to 1500 cm−1 were due to absorbed water molecule H–O–H bending vibrations. For pure ZnO nanoparticles and ZnO–Ag2O composite nanoflowers, the peaks near 3000 cm−1 to 3500 cm−1 and 1600 cm−1 displayed stretching and bending vibrations of physically absorbed water respectively.28,40
To evaluate the effect on the optical properties of pure ZnO nanoparticles with the composite formation between ZnO and Ag2O, photoluminescence (PL) spectra of pure ZnO and composite nanoflowers were compared as shown in Fig. 2c. The spectra were recorded with an excitation wavelength of 325 nm. It was observed that pure ZnO nanoparticles exhibited a band edge emission peak near 381 nm, which is attributed to the radiative recombination of free excitons.41 The intensity of this band was highly quenched with the formation of composite nanoflowers, as Ag2O particles on the surface of ZnO can result in extraction of electrons from the ZnO conduction band, and they also act as a sink for the photogenerated electrons. This can block both trap-related and direct charge carrier pathways, resulting in the enhancement of nonradiative relaxation of the excitons generated in ZnO.27 In addition, a small peak at 467 nm and a green emission or deep-level emission at 541 nm were also observed for pure ZnO nanoparticles. The mechanism of green emission is still not well understood. This defect-related visible emission can be caused by different types of defects, like zinc vacancies, oxygen vacancies, and donor–acceptor pairs. ZnO contains oxygen vacancies, and a recombination between deep levels formed by these vacancies and free electrons can result in this green emission.42 The decrease in the oxygen vacancies due to a surface modification of ZnO in the presence of Ag2O NPs can result in the quenching of the green emission. Thus, the PL studies show the strong interaction between the ZnO and Ag2O resulting in the drastic variation of optical properties between pure ZnO nanoparticles and ZnO–Ag2O composite nanoflowers.
The UV-Visible spectra for pure Ag2O and ZnO nanoparticles and the ZnO–Ag2O composite nanoflowers are sketched in Fig. 2d. For pure ZnO nanoparticles, an absorption peak at 359 nm is observed, which is red-shifted to 364 nm in case of the composite nanoflowers. On the other hand, the pure Ag2O nanoparticles exhibited a broad absorption peak towards visible region, therefore the absorption of the composite nanoflowers displayed a shift of absorption towards higher wavelengths. The nanocomposite band gap energy also changes as compared to that of pure ZnO nanoparticles. A band gap energy (Eg) calculation for the nanoparticles was acessed using the Tauc's model eqn (2)
| αhν = α0(hν − Eg)n | (2) |
From the DLS, the polydispersity index (PDI) obtained was 0.2 showing moderate polydispersity of the nanoparticles.
Electrochemical measurements of 2,4-DNT
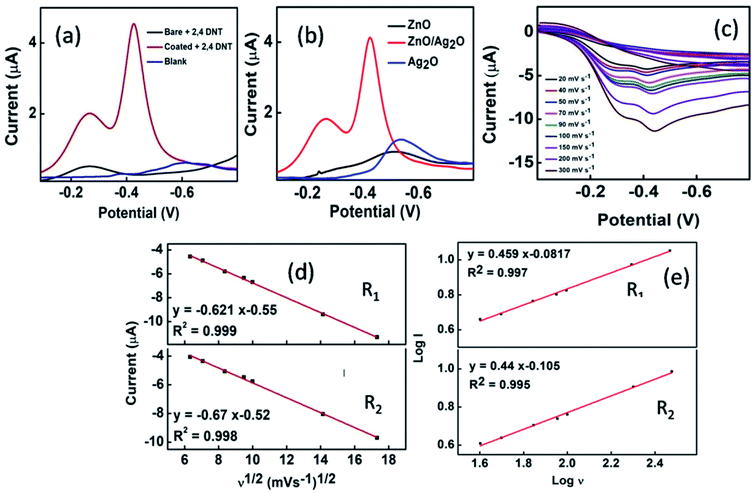
For a comparison of the electrochemical behavior of the modified gold electrode with the bare gold electrode, DPV responses were recorded (for bare and modified gold electrode with 2,4-DNT (20 μM) in PBS; Fig. 3a). It was found that two reduction peaks at a potential of −0.22 V (R1) and −0.43 V (R2) were obtained in case of the nanocomposite modified electrode, due to a stepwise reduction of two nitro groups in 2,4-DNT,46–48 whereas only one reduction peak at −0.24 V was obtained for the bare gold electrode. The response of the modified electrode in the presence of 2,4-DNT (20 μM) in PBS was also compared to that of blank PBS without 2,4-DNT (Fig. 3a). A small reduction peak near −0.6 V was obtained in the case of the blank buffer solution, but no peaks were observed as obtained in presence of 2,4-DNT. The DPV measurements for 2,4-DNT (20 μM in PBS) with pure ZnO and Ag2O nanoparticles gold electrode were also taken and compared with the response of equal amount of ZnO–Ag2O composite nanoflowers modified electrode as shown in Fig. 3b. It was realized that the composite nanoflower revealed a much better response as compared to the pure nanoparticles. This is due to the modification of the properties of nanoflowers which are caused by the formation of p–n heterostructure between p-type Ag2O and n-type ZnO resulting in a synergistic catalytic activity for electrochemical sensing. To perceive the effect of scan rate, CV measurements were taken for 2,4-DNT (20 μM in PBS) as shown in Fig. 3c.It was realized that the current response increased with the higher scan rate due to formation of the diffusion layer closer to the electrode and more flux in case of faster scan rates as compared to the slower scan rates. Plot of peak current (Ip) vs. square root of scan rate (ν1/2) (Fig. 3d) was sketched for both R1 and R2 and they showed linearity with respective linear regression equations: y = −0.621x − 0.55; R2 = 0.999 and y = −0.627x − 0.52; R2 = 0.998. To know the diffusion/adsorption-controlled nature of the process, log of Ipvs. log of ν was plotted for R1 and R2 (Fig. 3e) and following equations were obtained respectively: y = 0.459x − 0.0817; R2 = 0.997 and y = 0.44x − 0.105; R2 = 0.995. The slope values 0.459 and 0.44 for both the peaks indicate the diffusion-controlled nature of the process.49 From Ipvs. ν1/2 plot, the number of electrons involved in the irreversible reduction R1 and R2 were calculated using the Nicholson and Shain equation (eqn (3))50
Ip = (2.99 × 10⁵)![[thin space (1/6-em)]](https://www.rsc.org/images/entities/char_2009.gif) n n![[thin space (1/6-em)]](https://www.rsc.org/images/entities/char_2009.gif) (αnα)1/2ACD1/2ν1/2 (αnα)1/2ACD1/2ν1/2 | (3) |
The value of α was calculated using eqn (4)51
| αnα = 0.048/(Ep − Ep/2) | (4) |
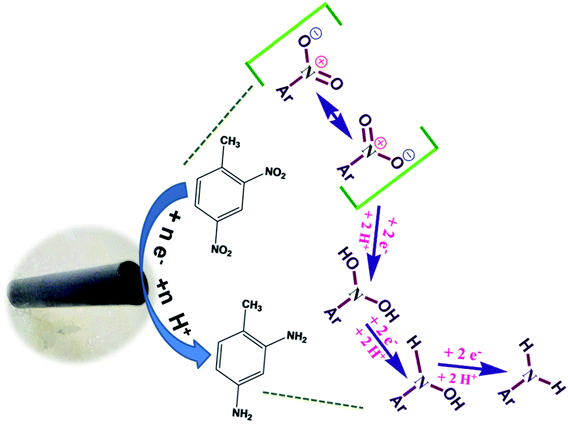
| Ar–NO2 + 2e− + 2H+ → Ar–N–(OH)2 | (5) |
| Ar–N–(OH)2 + 2e− + 2H+ → Ar–NH–OH | (6) |
| Ar–NH–OH + 2e− + 2H+ → Ar–NH2 | (7) |
| Ar–NO2 + 6e− + 6H+ → Ar–NH2 | (8) |
The effect of the analyte concentration was standardized by recording the DPV readings for different concentrations of 2,4-DNT (0.4 μM to 120 μM) as shown in Fig. 4a. The current vs. concentration calibration curve was plotted for peak R2 using the values obtained from the concentration studies are shown in Fig. 4b.
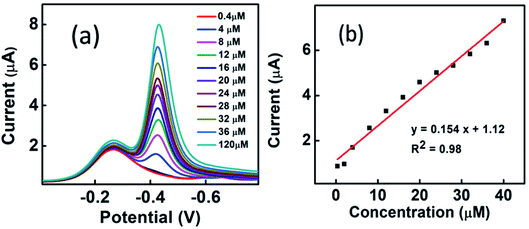 | ||
| Fig. 4 (a) DPV measurements for 2,4-DNT in 0.1 mM pH 7 PBS for different concentrations (0.4–120 μM). (b) Current vs. concentration calibration curve. | ||
The calibration curve showed linearity with the linear regression equation: y = 0.154x + 1.12; R2 = 0.98. From this calibration curve, sensor sensitivity was calculated (dividing calibration curve slope by the surface area of working electrode (0.033 cm2)) and found to have a good sensitivity of 5 μA μM−1 cm−2. Formula 3Sa/b (b = calibration curve slope, Sa = standard deviation value of the response)52 was used to calculate the limit of detection (LOD), and it was found to have a low LOD of 13 nM. The linear dynamic range (LDR) was established to be 0.4 μM to 40 μM. A comparison of the performance of modified electrode and other 2,4-DNT sensors is given in Table 1.
| Material | Technique | LODg (μM) | LDRf (μM) | Ref. |
|---|---|---|---|---|
| a Ag/C: zero valent silver modified carbon fiber material. b CV: cyclic voltammetry. c DPV: differential pulse voltammetry. d G–LiClO4: lithium perchlorate exfoliated graphene sheet. e G–Na2SO4: sodium sulphate exfoliated graphene sheet. f LDR: linear detection range. g LOD: limit of detection. h Pd–Pt: palladium–platinum nanostructures. i SPE: screen printed electrode j SWV: square wave voltammetry. k ZnO–Ag2O: zinc oxide–silver oxide l 3DOM: three dimensionally ordered macroporous. | ||||
| G–LiClO4d | DPV | 14.98 | — | 30 |
| G–Na2SO4e | 31.4 | — | ||
| Functionalized 3DOM carbon electrodesl | SWVj | 3 | — | 31 |
| Pd–Pth | DPVc | 0.82 | 10–100 | 32 |
| Disposable SPEi | CV | 0.7 | 0–200 | 33 |
| Ag/Ca | CVb | 5 | — | 53 |
| ZnO–Ag2O composite nanoflowers modified gold electrodek | DPV | 0.013 | 0.4–40 | This work |
To know the effect of pH on the sensor response, the DPV measurements were taken for 2,4-DNT (20 μM) in different pH PBS (4–10) as shown in Fig. 5a, the pH of PBS was adjusted using HCl (0.5 M) and NaOH (1 M).
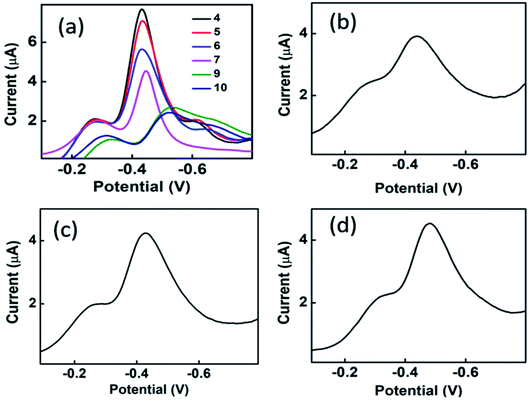 | ||
| Fig. 5 DPV response (a) 2,4-DNT (20 μM) at different pH (4–10) in 0.1 mM PBS (b) tap water (c) hand pump water (d) sewage water spiked samples. | ||
It was observed that the reduction peak current values increased with a decrease in the pH value showing that lower pH facilitate the reduction process due to more availability of protons. But as the sensor also showed a good response in neutral pH 7, and most of the real water samples also have a neutral pH, therefore pH 7 was chosen for all the electrochemical experiments.
Real water sample analysis
Real water sample analysis was done for spiked samples by DPV measurements using the modified sensor. Real environmental water samples from various sources (tap, hand pump, sewage) were collected and spiked with known amount of DNT, then analyzed by DPV technique. The DPV responses of the modified electrode in real water sample are shown in Fig. 5b–d. A good response was observed for the modified sensor with the real water samples. The sample details, spiking amount and the amount calculated from the standardized technique are provided in Table 2.| No. | Sample details | Spiking amount of DNT (μmol dm−3) | Calculated amount of DNT by proposed technique (μmol dm−3) |
|---|---|---|---|
| 1 | Tap water (P.U., Chandigarh, India) | 12 | 12.48 ± 1.2 |
| 2 | Hand pump water (Una, Himachal, India) | 16 | 16.08 ± 0.462 |
| 3 | Sewage water (Chandigarh, India) | 16 | 16.55 ± 0.07 |
Selectivity, reproducibility and reusability
The influence of other organic and inorganic species (resorcinol, hydroquinone, catechol, bisphenol A, Na+, Ca2+, K+, Zn2+, Cl−, SO42−) on electrochemical response of modified electrode was determined by the DPV measurement of 10 μM DNT in PBS buffer in the presence and absence of 50 folds higher concentration of these compounds (Fig. 6a). It was found that there was no significant interference of these chemicals on the electrochemical response for 2,4-DNT in the selected potential range, thus, showing good selectivity for 2,4-DNT.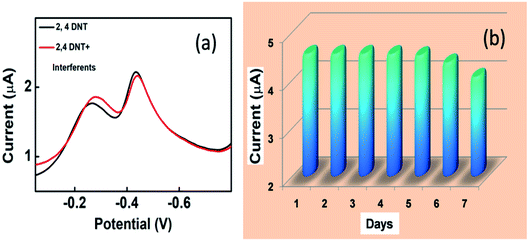 | ||
| Fig. 6 (a) DPV response for 2,4-DNT (10 μM in 0.1 mM pH 7 PBS) with and without possible interferents. (b) Reusability measurements for 2,4 DNT (20 μM in 0.1 mM pH 7 PBS) for the modified electrode. | ||
In order to determine the sensor reproducibility, all the DPV measurements were carried out in triplicates. The relative standard deviation value (RSD) was found to be 1.8%. Reusability of the modified sensor was determined by using the sensor for detection of 20 μM DNT in PBS buffer using DPV, repeatedly for one week. The sensor was washed with DDW and stored at 4 °C after each use. After one week, the sensor response was found to be 89% of that of the first day response, thus showing appreciable reusability (Fig. 6b).
Conclusion
Novel ZnO–Ag2O composite nanoflowers were synthesized in an aqueous medium without the use of any stabilizing or capping agent, by an easy, cost effective and fast synthesis method. These composite nanoflowers were used for the gold working electrode modification, and this modified electrode was further employed for the electrochemical sensing of 2,4-DNT in water samples. Different parameters for the detection process were studied using CV and DPV electrochemical techniques. The ZnO–Ag2O composite nanoflowers modified sensor showed a stepwise reduction of the two nitro groups of 2,4-DNT. Due to the synergistic effect of Ag2O and ZnO in the nanocomposite, there was an enhancement of the electrocatalytic properties of composite nanoflowers resulting in a much better electrochemical response than the pure ZnO and Ag2O nanoparticles modified sensors. The sensor showed selectivity for 2,4-DNT in the presence of other interferents and displayed reproducible results with a good sensitivity (5 μA μM−1 cm−2), a very low LOD (13 nM), a wide linear dynamic range (0.4 μM to 40 μM) and good reusability. The modified sensor also revealed satisfactory results with real water samples along with the laboratory samples at a neutral pH. Thus, the synthesized nanocomposites can be used as a suitable material for the sensing of 2,4-DNT in aqueous samples.Conflicts of interest
There are no conflicts of interest to be declared by the authors.Acknowledgements
UC thanks Council of Scientific and Industrial Research (CSIR), New Delhi for financial support under CSIR (09/135(0764)/2017-EMR-I). GB thanks UGC, for providing financial support in the form of DS Kothari post doc fellowship (Reference No. F.4-2/2006 (BSR)/EN/18-19/0005). GK thankful to DST for Inspire Faculty Award (IFA-12-CH41). GRC would like to acknowledge the support of UGC, India under the INDO-US 21st Century Knowledge Initiative Project (F.No.194-2/2016(IC)). This work is also supported by PURSE II (PURSE/2013/7) grant. Authors would also like to thank Sophisticated Analytical Instrumentation Facility (SAIF), Central Instrumentation Lab (CIL), Panjab University, Chandigarh, India, for providing instrumentation facilities (FESEM, EDS, FT-IR, and PXRD). National Institute of Technical Teachers Training and Research (NIIITR), Chandigarh, India, for providing spectro-fluorophotometer facility.References
- K. S. Ju and R. E. Parales, Microbiol. Mol. Biol. Rev., 2010, 74, 250, DOI:10.1128/mmbr.00006-10.
- Drinking Water Health Advisory for 2,4-Dinitrotoluene and 2,6-Dinitrotoluene, https://www.epa.gov/sites/production/files/201409/documents/drinking_water_health_advisory_for_24_and_26_dinitrotoluene.pdf, accessed September, 2019 Search PubMed.
- E. J. Olson, W. C. Isley, J. E. Brennan, C. J. Cramer and P. Bühlmann, J. Phys. Chem. C, 2015, 119, 13088, DOI:10.1021/acs.jpcc.5b02840.
- Technical Fact Sheet – Dinitrotoluene (DNT), United States Environmental Protection Agency, https://www.epa.gov/sites/production/files/201710/documents/emerging_contaminant_dinitrotoleune_dnt.pdf, accessed September, 2019 Search PubMed.
- J. Wang, W. Jin, X. Zhang, C. Hu, Q. Luo, Y. Lin and S. Hu, Anal. Chem., 2014, 86, 8383, DOI:10.1021/ac501973x.
- W. Wu, N. Shi, J. Zhang, X. Wu, T. Wang, L. Yang, R. Yang, C. Ou, W. Xue, X. Feng, L. Xie and W. Huang, J. Mater. Chem. A, 2018, 6, 18543, 10.1039/c8ta01861h.
- S. Yagur-Kroll, E. Amiel, R. Rosen and S. Belkin, Appl. Microbiol. Biotechnol., 2015, 99, 7177, DOI:10.1007/s00253-015-6607-0.
- S. Ben-Jaber, W. J. Peveler, R. Quesada-Cabrera, C. W. O. Sol, I. Papakonstantinou and I. P. Parkin, Nanoscale, 2017, 9, 16459, 10.1039/c7nr05057g.
- P. Bansal, G. Bhanjana, N. Prabhakar, J. S. Dhau and G. R. Chaudhary, J. Mol. Liq., 2017, 248, 651, DOI:10.1016/j.molliq.2017.10.098.
- G. Bhanjana, P. Rana, G. R. Chaudhary, N. Dilbaghi, K. H. Kim and S. Kumar, Sci. Rep., 2019, 9, 1, DOI:10.1038/s41598-019-44525-4.
- R. Malik, V. K. Tomer, Y. K. Mishra and L. Lin, Appl. Phys. Rev., 2020, 7, 021301-1, DOI:10.1063/1.5123479.
- Y. K. Mishra and R. Adelung, Mater. Today, 2018, 21, 631, DOI:10.1016/jmattod.2017.11.003.
- C. Rajkumar, P. Veerakumar, S. M. Chen, B. Thirumalraj and K. C. Lin, ACS Sustainable Chem. Eng., 2018, 6, 16021, DOI:10.1021/acssuschemeng.8b02041.
- Y. Liu, L. Zhu, Y. Zhang and H. Tang, Sens. Actuators, B, 2012, 171–172, 1151, DOI:10.1016/j.snb.2012.06.054.
- H. J. Lim, B. Chua and A. Son, Biosens. Bioelectron., 2017, 94, 10, DOI:10.1016/j.bios.2017.02.029.
- N. Kaur, G. Kaur, A. Bhalla, J. S. Dhau and G. R. Chaudhary, Green Chem., 2018, 20, 1506, 10.1039/c7gc03877a.
- P. Bansal, G. R. Chaudhary, N. Kaur and S. K. Mehta, RSC Adv., 2015, 5, 8205, 10.1039/c4ra15045g.
- G. Bhanjana, I. Toor, G. R. Chaudhary, N. Dilbaghi, K. H. Kim and S. Kumar, J. Mol. Liq., 2019, 292, 111455, DOI:10.1016/j.molliq.2019.111455.
- P. R. Solanki, A. Kaushik, V. V. Agrawal and B. D. Malhotra, NPG Asia Mater., 2011, 3, 17–24, DOI:10.1038/asiamat.2010.137.
- A. J. Ghazizadeh, A. Afkhami and H. Bagheri, Microchim. Acta, 2018, 185, 296, DOI:10.1007/s00604-018-2840-4.
- N. Chauhan, S. Gupta, D. K. Avasthi, R. Adelung, Y. K. Mishra and U. Jain, ACS Appl. Mater. Interfaces, 2018, 10, 30631, DOI:10.1021/acsami.8b08901.
- Y. Al-Hadeethi, A. Umar, A. A. Ibrahim, S. H. Al-Heniti, R. Kumar, S. Baskoutase and B. M. Raffah, Ceram. Int., 2017, 43, 6765, DOI:10.1016/j.ceramint.2017.02.088.
- P. R. Solanki, A. Kaushik, A. A. Ansari and B. D. Malhotra, Appl. Phys. Lett., 2009, 94, 143901, DOI:10.1063/1.3111429.
- R. Khan, A. Kaushik, P. R. Solanki, A. A. Ansari, M. K. Pandey and B. D. Malhotra, Anal. Chim. Acta, 2008, 616, 207, DOI:10.1016/j.aca.2008.04.010.
- A. Ali, A. A. Ansari, A. Kaushik, P. R. Solanki, A. Barik, M. K. Pandey and B. D. Malhotra, Mater. Lett., 2009, 28, 2473, DOI:10.1016/j.matlet.2009.08.038.
- H. J. Kim and J. H. Lee, Sens. Actuators, B, 2014, 192, 607, DOI:10.1016/j.snb.2013.11.005.
- S. Ma, J. Xue, Y. Zhou and Z. Zhang, J. Mater. Chem. A, 2014, 2, 7272, 10.1039/c4ta00464g.
- A. Kadam, R. Dhabbe, A. Gophane, T. Sathe and K. Garadkar, J. Photochem. Photobiol., B, 2016, 154, 24, DOI:10.1016/j.jphotobiol.2015.11.007.
- H. S. Toh, A. Ambrosi and M. Pumera, Catal. Sci. Technol., 2013, 3, 123, 10.1039/c2cy20253k.
- Y. T. Yew, A. Ambrosi and M. Pumera, Sci. Rep., 2016, 6, 1, DOI:10.1038/srep33276.
- M. A. Fierke, E. J. Olson, P. Bühlmann and A. Stein, ACS Appl. Mater. Interfaces, 2012, 4, 4731, DOI:10.1021/am301108a.
- S. Dutta, C. Ray, S. Sarkar, A. Roy, R. Sahoo and T. Pal, Electrochim. Acta, 2015, 180, 1075, DOI:10.1016/j.electacta.2015.09.062.
- J. S. Caygills, S. D. Collyer, J. L. Holmes, F. Davis and S. P. J. Higson, Analyst, 2013, 138, 346, 10.1039/c2an36351h.
- J. Fan, T. Li and H. Heng, Bull. Mater. Sci., 2016, 39, 19, DOI:10.1007/s12034-015-1145-z.
- S. Chakraborty, A. K. Kole and P. Kumbhakar, Mater. Lett., 2012, 67, 362, DOI:10.1016/j.matlet.2011.10.018.
- Q. Ahsanulhaq, S. H. Kim, J. H. Kim and Y. B. Hahn, Mater. Res. Bull., 2008, 43, 3483, DOI:10.1016/j.materresbull.2008.01.021.
- L. Xu, B. Wei, W. Liu, H. Zhang, C. Su and J. Che, Nanoscale Res. Lett., 2013, 8, 536, DOI:10.1186/1556-276x-8-536.
- Y. Chen, S. Yu, Q. Yao, S. Fu and G. Zhou, J. Colloid Interface Sci., 2018, 510, 280, DOI:10.1016/j.jcis.2017.09.073.
- R. Kumar, D. Rana, A. Umar, P. Sharma, S. Chauhan and M. S. Chauhan, Talanta, 2015, 137, 204, DOI:10.1016/j.talanta.2015.01.039.
- A. Bagabas, A. Alshammari, M. F. A. Aboud and H. Kosslick, Nanoscale Res. Lett., 2013, 8, 516, DOI:10.1186/1556-276x-8-516.
- R. Raji and K. G. Gopchandran, Journal of Science: Advanced Materials and Devices, 2017, 2, 51, DOI:10.1016/j.jsamd.201702.002.
- Y. Gong, T. Andelman, G. F. Neumark, S. O'Brien and I. L. Kuskovsky, Nanoscale Res. Lett., 2007, 2, 297, DOI:10.1007/s11671-007-9064-6.
- R. Chauhan, A. Kumar and R. P. Chaudhary, J. Sol-Gel Sci. Technol., 2012, 63, 546, DOI:10.1007/s10971-012-2818-3.
- R. Saravanan, Solid Oxide Fuel Cell (SOFC) Materials, Materials Research Forum LLC, 2018, DOI:10.21741/9781945291517.
- S. M. Hosseini, I. A. Sarsari, P. Kameli and H. Salamati, J. Alloys Compd., 2015, 640, 408, DOI:10.1016/j.jallcom.2015.03.136.
- C. X. Yuan, Y. R. Fan, T. Zhang, H. X. Guo, J. X. Zhang, Y. L. Wang, D. L. Shan and X. Q. Lu, Biosens. Bioelectron., 2014, 58, 85, DOI:10.1016/j.bios.2014.01.041.
- H. Zhang, A. Cao, J. Hu, L. Wan and S. Lee, Anal. Chem., 2006, 78, 1967, DOI:10.1021/ac051826s.
- S. Pan, L. Wang, X. Chena, Y. Tang, Y. Chen, Y. Sun, X. Yang and P. Wan, Electrochim. Acta, 2016, 203, 301, DOI:10.1016/j.electacta.2016.04.050.
- S. Wyantuti, Y. Wahyuni and C. Panatarani, Procedia Chem., 2015, 17, 170, DOI:10.1016/j.proche.2015.12.109.
- R. S. Nicholson and I. Shain, Anal. Chem., 1964, 36, 706, DOI:10.1021/ac60210a007.
- E. S. Takeuchi and R. W. Murray, J. Electroanal. Chem., 1985, 188, 49, DOI:10.1016/s0022-0728(85)80049-8.
- A. Shrivastava and V. Gupta, Chron. Young Sci., 2011, 2, 21, DOI:10.4103/2229-5186.79345.
- J. Mbah, K. Moorer, L. Pacheco-Londoño, S. Hernandaze-Rivera and G. Cruz, Electrochim. Acta, 2013, 88, 832, DOI:10.1016/j.electacta.2012.10.068.
Footnote |
| † Electronic supplementary information (ESI) available. See DOI: 10.1039/d0ra02826f |
| This journal is © The Royal Society of Chemistry 2020 |

