 Open Access Article
Removal of aqueous Hg(II) by thiol-functionalized nonporous silica microspheres prepared by one-step sol–gel method
Ruixue Liang and
Hua Zou *
*
School of Materials Science and Engineering, University of Shanghai for Science and Technology, 516 Jungong Road, Shanghai 200093, China. E-mail: hua.zou@usst.edu.cn
First published on 15th May 2020
Abstract
It is well known that thiol-functionalized silica (SiO2-SH) can be used as an effective adsorbent for the removal of Hg(II) from water. Studies in this field have focused on porous silica gels and mesoporous silicas that have large surface area and pore volume, while nonporous silica particles are seldom reported. This work aims to investigate the Hg(II) adsorption properties of nonporous SiO2-SH microspheres prepared by a simple one-step sol–gel method. The effects of pH, initial concentration of Hg(II) and temperature on the adsorption properties of the SiO2-SH microspheres were studied via batch adsorption experiments. The maximum adsorption capacity for Hg(II) at 293 K calculated from the Langmuir equation was 377.36 mg g−1. The adsorption kinetics and equilibrium data were well-fitted to the pseudo-second-order model and the Langmuir isotherm model, respectively.
1 Introduction
Hg(II) is the common form of mercury, which is one of the most toxic heavy metals existing in the environment. The origins of mercury contamination can be natural and anthropogenic, more commonly the latter. The natural sources typically involve mercury from volcanic activity and weathering of rocks; while the anthropogenic sources include coal-fired power generation, industrial production, waste incineration, mining, etc. The mercury can accumulate in the water environment on which humans depend for survival. After being ingested by the human body, it will accumulate in certain organs, causing chronic poisoning.1In the past decades, various techniques for the removal of Hg(II) (e.g. ion exchange, solvent extraction, adsorption, precipitation) have been developed.2,3 Among them, adsorption is widely used because adsorbent is easy to be operated and cost-effective. Various adsorbents such as activated carbons, silica gel, mesoporous silica, conjugated polymers, and biomass have been reported for Hg(II) removal.4–7 These materials generally carry sulfur- and nitrogen-containing functional groups on the surface, which show a high affinity for Hg(II). For example, the thiol group is an excellent ligand that can exhibit remarkable interaction to Hg(II) due to the soft Lewis acid–base interactions (thiol group is a soft Lewis base and mercury is a soft Lewis acid).8 On the other hand, silica offers some advantages such as good mechanical strength, good thermal stability and ease of recovery.9–11 Therefore, thiol-functionalized silica (SiO2-SH) has been widely studied as an effective adsorbent for the removal of Hg(II) from water.12–40 So far, studies in this field have focused on porous SiO2-SH gel,12–16 mesoporous SiO2-SH microspheres17–33 and mesoporous SiO2-SH microspheres with magnetic cores34–39 that have large surface area and pore volume. However, nonporous SiO2-SH microsphere as Hg(II) adsorbent is seldom reported, although we note that there are two reports on Fe3O4@SiO2-SH particles for Hg(II) adsorption, in which the silica is nonporous.40,41 In this context, it is perhaps also noteworthy that there are several reports on amino-functionalized,42 polypyrrole-functionalized,43 and ethylenediaminetetraacetic acid-functionalized44 CoFe2O4@SiO2 microspheres with nonporous silica shell for Hg(II) removal.
On the other hand, it is interesting to note that the number of functional groups on the absorbent surface might be more important than large surface area and pore volume, which means nonporous microsphere is also promising for heavy metal adsorption providing there are abundant functional groups on its surface. For example, Qu et al. prepared nonporous silica particles functionalized with rich sulfonic acid groups and used them for adsorbing heavy metals. It is shown that the adsorption capacity of Pb(II) could reach to 635 mg g−1 although the surface area of the adsorbent was only 1.58 m2 g−1.45 The strong adsorption ability of the sulfonic acid functionalized silica microspheres was attributed to the nonporous particles with rich sulfonic groups which facilitated the mass transport of metal ions to the active sites.
In principle, surface-modified silica microspheres can be fabricated through two common methods.46 One method is based on silanization of preformed silica microspheres with silane-coupling agents in a dried organic solvent or aqueous media, leading to monolayer or multilayer modification, respectively. However, this two-step method suffers from harsh experimental conditions (for monolayer modification) or low reproducibility (for multilayer modification). Another method involves a one-step co-condensation reaction of an organosilane and a tetraalkoxysilane precursor, in which both the size and shape of the hybrid silica spheres were much less controlled. Alternatively, hybrid silica spheres could be fabricated by using a suitable silane as the sole precursor in aqueous solution. This method is particularly suitable to prepare SiO2-SH microspheres from (3-mercaptopropyl)trimethoxysilane (MPTMS) precursor since it can easily self-hydrolyze into organosilanetriol owing to its molecular structure: there are three short carbon chains in the MPTMS molecule, which are suitable for changing from alkoxy groups to hydroxy groups.47 In addition, methanol is released during the hydrolysis reaction, which can promote dissolution of MPTMS in water.
Compared with porous SiO2-SH gel and mesoporous SiO2-SH spheres, nonporous SiO2-SH microspheres may offer the advantages of easier adsorption and desorption as the active sites are located on the surface. This study aims to investigate the Hg(II) adsorption properties of the nonporous SiO2-SH microspheres prepared by the one-step sol–gel method. The SiO2-SH microspheres were extensively characterized by laser diffraction instrument, SEM, TEM, nitrogen adsorption–desorption analyzer, FTIR, Raman spectroscopy, XPS and TGA. The isotherm, kinetics and mechanism of Hg(II) adsorbed by the SiO2-SH microspheres were studied by a series of batch experiments. Finally, the resorption property of the adsorbent was also investigated. As far as we are aware, this is the first time that nonporous SiO2-SH microsphere is reported as Hg(II) adsorbent.
2 Experimental
2.1 Materials
MPTMS (95%) and ammonium hydroxide solution (25%) were purchased from Sigma-Aldrich. Ethanol (≥99.7%), sodium hydroxide (≥96%), hydrochloric acid (36–38%), and nitric acid (65–68%) were supplied by Sinopharm Chemical Reagent Co., Ltd. Hg(NO3)2·H2O standard solution (1000 μg mL−1, in 1.0 mol L−1 HNO3) was provided by General Research Institute for Nonferrous Metals, Beijing, China. All chemicals were used as received and all water used was deionized.2.2 Synthesis of SiO2-SH microspheres
The SiO2-SH microspheres were prepared using a one-step method through the self-hydrolysis of organosilane in aqueous solution. MPTMS (2.0 g) was dissolved in water (100 g) in a single-necked round bottom flask equipped with a magnetic stir bar under vigorous stirring. Once a transparent solution was obtained, NH4OH (3.4 mL) was added to the solution and the reaction was allowed to proceed for 4 h. The resulting microspheres were then purified by repeated centrifugation and redispersion cycles, replacing supernatants with ethanol, ethanol/water mixture (1![[thin space (1/6-em)]](https://www.rsc.org/images/entities/char_2009.gif) :
:![[thin space (1/6-em)]](https://www.rsc.org/images/entities/char_2009.gif) 1) and H2O, respectively. Finally, the microspheres were redispersed in water by repeated ultrasonication for a few hours. High temperature was avoided during the ultrasonic treatment process by the addition of ice. Drying the microspheres to powder form was also avoided for adsorption studies, since this would result in aggregation of the SiO2-SH microspheres and also make redispersion of the particles more difficult.
1) and H2O, respectively. Finally, the microspheres were redispersed in water by repeated ultrasonication for a few hours. High temperature was avoided during the ultrasonic treatment process by the addition of ice. Drying the microspheres to powder form was also avoided for adsorption studies, since this would result in aggregation of the SiO2-SH microspheres and also make redispersion of the particles more difficult.
2.3 Characterization
The morphology of the SiO2-SH microspheres was observed by scanning electron microscopy (SEM, Quanta FEG 450) and transmission electron microscopy (TEM, FEI Tecnai G2 F30). The SEM samples were prepared on double-sided adhesive carbon disks and sputter-coated with gold, and the TEM samples were prepared on carbon-coated copper grids. The size and size distribution of the SiO2-SH microspheres were determined by laser diffraction using Malvern Mastersizer 2000. The measurement was conducted in triplicate on highly dilute aqueous dispersion. The nitrogen adsorption–desorption measurement of the SiO2-SH microspheres was performed using a Micromeritics ASAP 2460 instrument and the pore volume was calculated by the BJH equation. FTIR spectra were recorded on a PerkinElmer Spectrum 100 FTIR spectrometer from KBr disks. A laser Raman spectrometer (IK3301R-G) was used to obtain a Raman spectrum of the microspheres. X-ray photoelectron spectroscopy (XPS, Versa Probe PHI-5000, ULVAC-PHI Inc., Japan) was used to detect the surface composition of the sample. TGA experiments were carried out using a PerkinElmer Pyris 1 TGA instrument in N2 at a heating rate of 10 °C min−1 from room temperature to 800 °C. The concentration of heavy metal ion was determined by inductively coupled plasma atomic emission spectrometry (ICP-AES, PerkinElmer Optima 7000DV). A Ray magnetic PHS-3C pH meter was used for pH measurements.2.4 Adsorption experiments
The adsorption experiments were first carried out in the pH range of 2.5 to 6.5 as follows. The appropriate amount of the SiO2-SH microsphere dispersion (equivalent to 5 mg of dry SiO2-SH) was diluted into 25 mL aqueous dispersion at desired pH containing 5 mg of Hg(II), followed by stirring (280 rpm, 293 K) for 24 h prior to filtration. The equilibrium concentration of the Hg(II) in aqueous solution was determined by ICP-AES. The adsorption capacity (Qe, mg g−1) was calculated using the following equation:
 | (1) |
The adsorption kinetic experiments were conducted at 293 K, 303 K and 313 K, respectively. In each case, 200 mg L−1 of Hg(II) solution was set as the initial concentration of Hg(II) solution and the contact time ranged from 0 to 5 h. The adsorption isotherm study was done at 293 K, with the initial concentration of Hg(II) solution varying from 50 mg L−1 to 250 mg L−1.
2.5 Resorption experiments
Immediately after adsorption, the SiO2-SH microspheres were filtrated from the suspension and slightly washed with deionized water. The Hg-loaded microspheres were then agitated with HCl or HNO3 solution (0.5–3.0 mol L−1) for 24 h at room temperature followed by separation. Subsequently, the SiO2-SH microspheres were reused for adsorption in the succeeding cycle.3 Results and discussion
3.1 Characterization of SiO2-SH microspheres
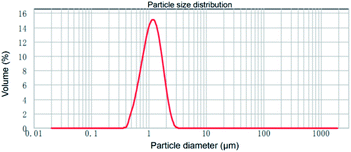
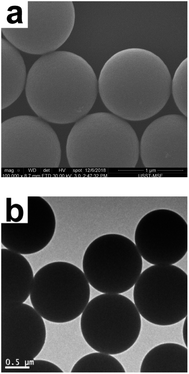
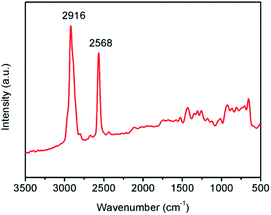
SiO2-SH microspheres were successfully synthesized via self-hydrolysis of MPTMS in aqueous solution as described by Lee and coworkers.47 The as-synthesized SiO2-SH microspheres were highly functionalized but could be redispersed in water with the aid of an ultrasonic bath, which was essential for subsequent adsorption studies. The laser diffraction confirmed that the SiO2-SH microspheres had a diameter of ∼1.2 μm with a relatively narrow size distribution (see Fig. 1). The relatively large size of the microspheres may be at least partially responsible for the moderate aqueous dispersibility. SEM and TEM studies indicated that the microspheres were spherical and had a smooth surface morphology (see Fig. 2). BET results showed that the microspheres were nonporous.FTIR study (see Fig. 3) confirmed the formation of SiO2-SH microspheres, since two strong Si–O–Si stretching vibration bands were observed at 1035 and 1120 cm−1; these bands were different to the spectrum of pure silica (only one peak at ∼1100 cm−1) because Si–C bond in the hybrid silica disrupted the symmetry of Si–O–Si structure. According to the literature,48 the –OH groups in the hybrid silica give rise to a broad stretching vibration in the range of 3100–3700 cm−1. This feature was also observed, indicating the existence of silanol groups in the SH microspheres spheres. A weak band ascribed to SH group was discernible at 2554 cm−1. This is in reasonable agreement with the literature.38,41,46 It is noteworthy that the two weak peaks of –SH at ∼2360 cm−1 due to the aggregation of thiol groups and the hydrogen binding effects were not found,35,38 indicating the thiol groups in our work were nonaggregated. Raman spectroscopy, a complementary tool to FTIR spectroscopy, was also used to characterize the SiO2-SH microspheres. As shown in Fig. 4, the strong characteristic stretching vibration of CH2 (2916 cm−1) and SH (2568 cm−1) further confirmed the presence of thiol groups on the hybrid silica microspheres.49 It should be mentioned that the characteristic peak of S–S bond (∼509 cm−1) was not observed, suggesting that the air oxidation of the thiol groups did not occur substantially.50–53 This perhaps could be explained by the fact that the SiO2-SH microspheres in this work were prepared in wet state and kept as aqueous dispersion prior to use. The surface composition of the SiO2-SH microspheres was measured by XPS with a typical sampling depth of 2–10 nm, which also provided good evidence that these microspheres were sulfur-rich at their surface: the atomic content of S 2p was determined to be 7.17%.
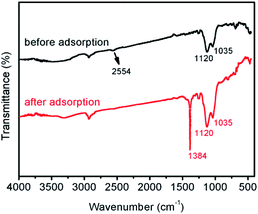 | ||
| Fig. 3 FTIR spectra of SiO2-SH microspheres before and after adsorption (adsorption conditions: SiO2-SH 10 mg, C0 = 200 mg L−1, pH = 5.5, T = 293 K, t = 24 h). | ||
3.2 Effect of pH on the adsorption capability
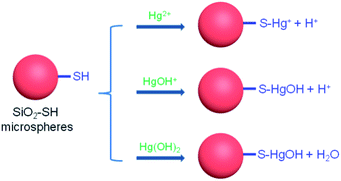
The first parameter examined in the adsorption process was the solution pH. In view of the fact that Hg(II) may precipitate in alkaline aqueous solution, the study was carried out in the pH range of 2.5–6.5. As shown in Fig. 5, the adsorption capacity of SiO2–OH for Hg(II) increased rapidly with increasing pH from 2.5 to 5.5. However, a further increase of pH value to 6.5 resulted in a slight reduction of adsorption capacity. At pH 5.5, SiO2-SH microspheres showed the highest adsorption capacity of 265.1 mg g−1. Similar results have been reported in the literature on Hg(II) adsorption.4 In this context, we note that the adsorption of Hg(II) onto the surface of SiO2-SH substrates is well-documented.21,27,38,41 As shown in Fig. 6, there might be three forms of Hg(II) in aqueous solution: Hg2+, Hg(OH)+ and Hg(OH)2. At lower pH (pH < 3), Hg2+ is the dominating specie, and its amount decreases with increasing solution pH until disappearance. In contrast, the amount of Hg(OH)+ and Hg(OH)2 increases with increasing solution pH. The complexation between the thiol group and Hg2+ generates positive S–Hg+ specie, which may prevents, to some extent, further Hg2+ adsorption due to electrostatic repulsive forces. In addition, since SiO2 has a negative zeta potential over a wide range of pH (typically from pH 2 to pH 12) due to the presence of silanol groups, there may be also an electrostatic interaction between the positively charged Hg2+ and the negatively charged SiO2-SH microsphere surface.31,36 The amount of Hg(OH)+ species has a maximum value at pH ∼ 4.0 and the amount of Hg(OH)2 species becomes dominant at higher pH (pH > 6), both of which can be adsorbed by thiol group without electrostatic repulsion. In the following discussion, the adsorption experiments were conducted at pH 5.5.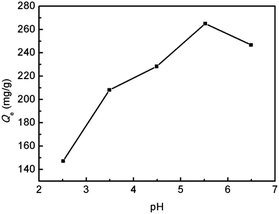 | ||
| Fig. 5 Effect of solution pH on the adsorption capacity of SiO2-SH microspheres for Hg(II) (SiO2-SH 5 mg, C0 = 200 mg L−1, pH 2.5–6.5, T = 293 K, t = 24 h). | ||
3.3 FTIR and XPS analysis of the Hg(II)-loaded SiO2-SH microspheres
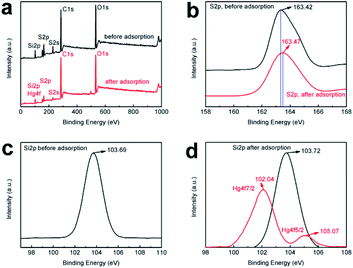
The adsorption of Hg(II) on the surfaces of SiO2-SH microspheres was investigated by FTIR and XPS. FTIR study confirmed Hg(II) adsorption (see Fig. 3), since an obvious characteristic peak of nitrate appeared at 1384 cm−1 after adsorption as Hg(NO3)2 was used as the source for Hg(II).6 In addition, the peak at 2554 cm−1 (S–H stretching vibration) disappeared after adsorption while other peaks were essentially unchanged, suggesting that only S–H participated in the adsorption process.XPS survey spectra of the microspheres before and after adsorption are shown in Fig. 7a. The presence of Hg 4f signal after adsorption provided further evidence that Hg(II) was adsorbed onto the SiO2-SH microspheres although the position of the Hg 4f signal overlapped with that of Si 2p in the overview spectrum.52 The Hg atomic content is 2.46% after adsorption. Furthermore, for the S 2p spectrum, there are a significant decrease in intensity and a shift of binding energy from 163.42 to 163.47 eV after adsorption (see Fig. 7b). This is probably due to the donation of the electrons from the S atoms to Hg(II), indicating that a complex between S and Hg formed.37,39 Fig. 7d shows the high-resolution Hg 4f spectrum of the sample after Hg(II) adsorption, which has two peaks at 102.04 eV and 105.07 eV, respectively. In comparison with Fig. 7c, it was obvious that Hg(II) was adsorbed through the binding between S and Hg(II).
3.4 Thermal stability
The TGA curves for the SiO2-SH microspheres before and after adsorption of Hg(II) are shown in Fig. 8. When the temperature is lower than 200 °C, the SiO2-SH microspheres showed an excellent thermal stability. The microspheres had a ∼56.5 wt% of residue when heated to 600 °C. The observed one sharp mass loss was attributed to the pyrolysis of the organic components of the hybrid silica microspheres, which indicated that the microspheres contained a large number of organic groups (including thiol groups).54 For the SiO2-SH microspheres after Hg(II) adsorption, there was an additional decomposition step in the range of 100–150 °C, which might be related to the desorption of the residual water and –NO3 groups bonded to the microspheres. It seemed the thermal stability of the Hg(II)-loaded SiO2-SH microspheres was lowered. However, they had a slightly higher residual weight of 57.8 wt% at 600 °C. This suggested that the interaction between the SiO2-SH microspheres and Hg(II) led to the formation a more stable complex.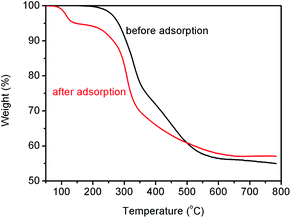 | ||
| Fig. 8 TGA curves of the SiO2-SH microspheres before and after Hg(II) adsorption (adsorption conditions: SiO2-SH 10 mg, C0 = 200 mg L−1, pH = 5.5, T = 293 K, t = 24 h). | ||
3.5 Adsorption kinetics
To better understand the adsorption process, the adsorption kinetics was studied at 293, 303 and 313 K, respectively. As shown in Fig. 9, at all temperatures, the adsorption capacities for Hg(II) increased extremely rapidly during the initial 10 min, and then increased slowly with increasing time up to 2 h. The rapid adsorption rate in the early state might be ascribed to the easy access of Hg(II) to the active sites on the nonporous microspheres, as well as the availability of abundant vacant sites.27 Thereafter they remained constant, which indicated that the adsorption reached equilibrium within 2 h. Furthermore, it is shown that the adsorption capacities increased with increasing temperature, suggesting that the adsorption process is temperature-dependent.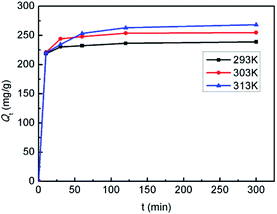 | ||
| Fig. 9 Adsorption kinetic curves of the SiO2-SH microspheres for Hg(II) at different temperatures (SiO2-SH 10 mg, C0 = 200 mg L−1, pH 5.5). | ||
The adsorption kinetics was further examined with pseudo-first-order model and pseudo-second-order model, respectively, as shown below:
Pseudo-first-order kinetic model:55
ln(Qe − Qt) = ln![[thin space (1/6-em)]](https://www.rsc.org/images/entities/char_2009.gif) Q1 − k1t Q1 − k1t
| (2) |
Pseudo-second-order kinetic model:56
 | (3) |
The adsorption data are fitted to eqn (2) and (3), respectively, and the results are shown in Fig. 10 and Table 1. The correlation coefficients obtained from the pseudo-second-order model are always closer to 1 and higher than those from the pseudo-first-order model, indicating that the adsorption process of SiO2-SH microspheres for Hg(II) is better described by the former model and is a chemical adsorption.7
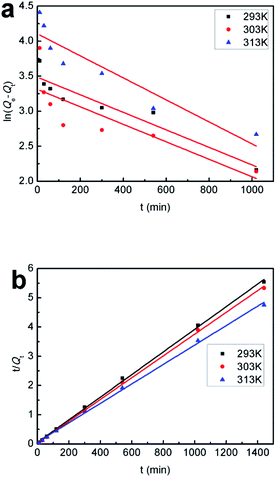 | ||
| Fig. 10 (a) Pseudo-first-order kinetic model and (b) pseudo-second-order kinetic model of the SiO2-SH microspheres for Hg(II) adsorption at different temperatures. | ||
| T (K) | Pseudo-first-order model | Pseudo-second-order model | ||||
|---|---|---|---|---|---|---|
| k1 (min−1) | Q1 (mg g−1) | R12 | k2 (g mg−1 min−1) | Q2 (mg g−1) | R22 | |
| 293 | 0.0013 | 32.60 | 0.9051 | 2.8 × 10⁻⁴ | 258.40 | 0.9990 |
| 303 | 0.0013 | 27.44 | 0.6941 | 3.9 × 10⁻⁴ | 268.82 | 0.9994 |
| 313 | 0.0016 | 60.56 | 0.8783 | 1.8 × 10⁻⁴ | 301.20 | 0.9988 |
3.6 Adsorption thermodynamics
The adsorption thermodynamic properties were studied at 293 K, 303 K and 313 K, respectively. The Gibbs free energy (ΔG), enthalpy (ΔH), and entropy (ΔS) for the adsorption process were calculated using the following equations:
 | (4) |
| ΔG = ΔH − TΔS | (5) |
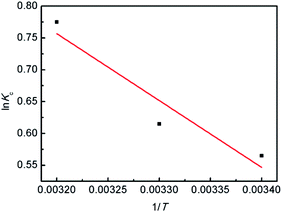
The values of ΔS and ΔH were obtained by plotting ln![[thin space (1/6-em)]](https://www.rsc.org/images/entities/char_2009.gif) Kc versus 1/T (Fig. 11). Each value of ΔG (kJ mol−1) is negative (293 K, −2.99; 303 K, −3.78; 313 K, −4.57) and less than 40 kJ mol−1, suggesting that the adsorption process of Hg(II) is thermodynamically feasible and involve a chemical reaction,39,57 which is consistent with the results obtained from the pseudo-second-order model. The positive value of ΔH = 20.1 kJ mol−1 suggests that the Hg(II) adsorption is an endothermic process, that is, an elevated temperature may facilitate adsorption. The positive value of ΔS (78.82 J K−1 mol−1) suggests that the adsorption is an entropy-driven process and the randomness at the solid/liquid interface is increasing.6
Kc versus 1/T (Fig. 11). Each value of ΔG (kJ mol−1) is negative (293 K, −2.99; 303 K, −3.78; 313 K, −4.57) and less than 40 kJ mol−1, suggesting that the adsorption process of Hg(II) is thermodynamically feasible and involve a chemical reaction,39,57 which is consistent with the results obtained from the pseudo-second-order model. The positive value of ΔH = 20.1 kJ mol−1 suggests that the Hg(II) adsorption is an endothermic process, that is, an elevated temperature may facilitate adsorption. The positive value of ΔS (78.82 J K−1 mol−1) suggests that the adsorption is an entropy-driven process and the randomness at the solid/liquid interface is increasing.6
3.7 Adsorption isotherm
The adsorption isotherm was studied based on the data collected under pH 5.5 at 293 K. At this pH, precipitation of Hg(II) may occur when its concentration is higher than 300 mg L−1. Thus the initial Hg(II) concentrations were varied from 50 to 250 mg L−1. As shown in Fig. 12, the adsorption capacity increased almost linearly with the equilibrium concentration during 30–150 mg L−1 (corresponding to initial Hg(II) concentration of 50–200 mg L−1), and after 150 mg L−1 a plateau adsorption capacity of 274.1 mg g−1 was reached.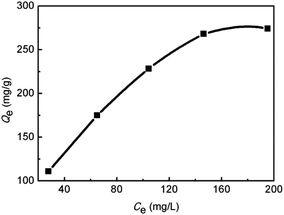 | ||
| Fig. 12 Isothermal adsorption curve of the SiO2-SH microspheres for Hg(II) (SiO2-SH 5 mg, pH 5.5, T = 293 K, t = 24 h). | ||
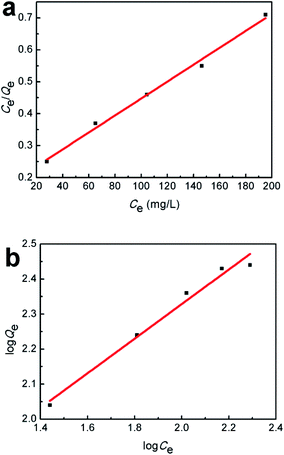
The adsorption isotherm was further examined by Langmuir and Freundlich models, respectively. The Langmuir isotherm model assumes that the surface properties of the adsorbent are uniform, the adsorption on the surface is monolayer adsorption, and there is no interaction between the adsorbates; while the Freundlich adsorption isotherm model assumes that the surface properties of the adsorbent are not uniform and describes the adsorption equilibrium of the heterogeneous adsorption surface. The models are shown as follows:
Langmuir equation:
 | (6) |
Freundlich equation:
 | (7) |
Fig. 13 and Table 2 show the fitting curves of the Langmuir and Freundlich models, and the calculation results, respectively. By comparing the linear correlation coefficient R2 values calculated from the two curves, it is found that the adsorption of Hg(II) by SiO2-SH microspheres is in better agreement with the Langmuir adsorption, indicating that the adsorption is a monolayer process. According to the Langmuir model, the maximum adsorption capacity at 293 K was estimated to be 377.36 mg g−1.
| Langmuir | Freundlich | ||||
|---|---|---|---|---|---|
| Qm (mg g−1) | KL (L mg−1) | R2 | 1/n | KF ((mg g−1) /( mg mL−1)) | R2 |
| 377.36 | 0.0145 | 0.9935 | 0.49 | 21.94 | 0.9825 |
3.8 Resorption study
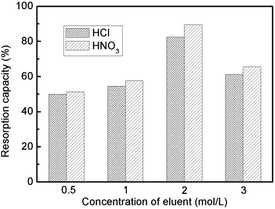
Resorption of the SiO2-SH microspheres for Hg(II) was studied by eluting them with HCl or HNO3 solution at various concentrations (0.5–3.0 mol L−1), and used again for the adsorption experiment. As shown in Fig. 14, better resorption results were obtained with HNO3 solution. This might be explained in terms of the affinity for Hg(II).30 The desorption process involves disruption and loosening the S–Hg coordination complex, and the affinity of Cl− for Hg(II) is lower than that of NO3−. However, HNO3 solution with higher concentration resulted in a lower resorption capacity, probably due to the partial destruction of the silica adsorbent under this condition. A maximum resorption capacity of 89.6% can be achieved with 2 mol L−1 HNO3 solution.3.9 Comparison to other SiO2-based adsorbents
Table 3 shows the maximum Hg(II) adsorption capacity of several SiO2-based adsorbents reported in the literature.8,58 By comparison, it can be seen that the SiO2-SH microspheres prepared in this work have a higher adsorption capacity (377.36 mg g−1 at room temperature). In addition, the microspheres have the merits of easy fabrication, rapid adsorption rate and easy to be recovered considering their relatively large size. Therefore, the SiO2-SH microsphere is a type of promising material for Hg(II) removal in water.| Type of adsorbent | Optimal adsorption conditions | Maximum adsorption capacity (mg g−1) | Ref. |
|---|---|---|---|
| MPTMS-modified diatom mesoporous silica | pH 6 | 185.2 | 26 |
| Sulfur-functionalized mesoporous silica | pH 5.8–8.2 | 62.3 | 27 |
| Periodic mesoporous organosilica with low thiol density | pH ∼ 5 and 7 | 46.1 | 30 |
| Thiol functionalization of short channel SBA-15 | pH 8 | 195.6 | 31 |
| Mesoporous Fe3O4@SiO2-SH | pH 6.0 | 207.71 | 35 |
| Thiol-functionalized silica | ∼pH 5.5 | 377.36 | This work |
4 Conclusions
In this study, the adsorption properties of highly monodisperse, nonporous SiO2-SH microspheres prepared by a one-step sol–gel method for Hg(II) in water were studied. This simple method allows a large number of thiol groups to be created on the surface of the microspheres, which have a strong affinity to Hg(II) through Lewis acid–base interactions. The adsorption process was highly dependent on the pH, the initial concentration of Hg(II) and temperature. The isotherm data fit well to the Langmuir isotherm model, while the kinetic data followed the pseudo-second-order kinetic model, indicating that monolayer adsorption was dominant and chemisorption was the main factor for determining the rate of adsorption. At 293 K, a maximum adsorption capacity of 377.36 mg g−1 was estimated. Therefore, the thiol-functionalized nonporous silica is a promising adsorbent for the removal of Hg(II) from water.Conflicts of interest
There are no conflicts to declare.Acknowledgements
This work is supported by the National Natural Science Foundation of China (51973117, 51503123), Program of Young Eastern Scholar from Shanghai Institutions of Higher Learning (QD2015014) and University of Shanghai for Science and Technology.Notes and references
- World Health Organization (WHO), https://www.who.int/en/news-room/fact-sheets/detail/mercury-and-health, accessed 18 April, 2020.
- Q. R. Wang, D. Kim, D. D. Dionysiou, G. A. Sorial and D. Timberlake, Environ. Pollut., 2004, 131, 323–336 CrossRef CAS PubMed.
- M. D. Xia, Z. X. Chen, Y. Li, C. H. Li, N. M. Ahmad, W. A. Cheemad and S. M. Zhu, RSC Adv., 2019, 9, 20941 RSC.
- W. Jing, B. L. Deng, H. Chen, X. R. Wang and J. Z. Zheng, Environ. Sci. Technol., 2009, 43, 5223–5228 CrossRef PubMed.
- H. Cui, Y. Qian, Q. Li, Q. Zhang and J. P. Zhai, Chem. Eng. J., 2012, 211–212, 216–223 CrossRef CAS.
- X. Wang, P. F. Lv, H. Zou, Y. Li, X. Y. Li and Y. Z. Liao, Ind. Eng. Chem. Res., 2016, 55, 4911–4918 CrossRef CAS.
- H. Zou, P. F. Lv, X. Wang, D. Wu and D. G. Yu, J. Appl. Polym. Sci., 2017, 134, 44879 Search PubMed.
- T. Velempini and K. Pillay, J. Environ. Chem. Eng., 2019, 7, 103350 CrossRef CAS.
- E. D. E. R. Hyde, A. Seyfaee, F. Neville and R. Moreno-Atanasio, Ind. Eng. Chem. Res., 2016, 55, 8891–8913 CrossRef CAS.
- Z. Wu, H. Han, W. Han, B. Kim, K. H. Ahn and K. Lee, Langmuir, 2007, 23, 7799–7803 CrossRef CAS PubMed.
- H. Zou, S. S. Wu and J. Shen, Chem. Rev., 2008, 108, 3893–3957 CrossRef CAS PubMed.
- A. Walcarius, M. Etienne and J. Bessière, Chem. Mater., 2002, 14, 2757–2766 CrossRef CAS.
- K. H. Nam, S. Gomez-Salazar and L. L. Tavlarides, Ind. Eng. Chem. Res., 2003, 42, 1955–1964 CrossRef CAS.
- M. Puanngam and F. Unob, J. Hazard. Mater., 2008, 154, 578–587 CrossRef CAS PubMed.
- K. Johari, N. Saman and H. Mat, Environ. Technol., 2014, 35, 629–636 CrossRef CAS PubMed.
- K. Johari, N. Saman and H. Mat, Can. J. Chem. Eng., 2014, 92, 1048–1058 CrossRef CAS.
- E. Da'na, Microporous Mesoporous Mater., 2017, 247, 145–157 CrossRef.
- A. Bibby and L. Mercier, Chem. Mater., 2002, 14, 1591–1597 CrossRef CAS.
- A. M. Walcarius and B. Lebeau, Chem. Mater., 2003, 15, 2161–2173 CrossRef CAS.
- A. Walcarius and C. Delacôte, Chem. Mater., 2003, 15, 4181–4192 CrossRef CAS.
- A. Walcarius and C. Delacôte, Anal. Chim. Acta, 2005, 547, 3–13 CrossRef CAS.
- S. J. L. Billinge, E. J. McKimmy, M. Shatnawi, H. J. Kim, V. Petkov, D. Wermeille and T. J. Pinnavaia, J. Am. Chem. Soc., 2005, 127, 8492–8498 CrossRef CAS PubMed.
- C. Delacôte, F. O. M. Gaslain, B. Lebeau and A. Walcarius, Talanta, 2009, 79, 877–886 CrossRef PubMed.
- F. O. M. Gaslain, C. Delacôte, A. Walcarius and B. Lebeau, J. Sol-Gel Sci. Technol., 2009, 49, 112–124 CrossRef CAS.
- A. Arencibia, J. Aguado and J. M. Arsuaga, Appl. Surf. Sci., 2010, 256, 5453–5457 CrossRef CAS.
- Y. Yu, J. Addai-Mensah and D. Losic, Sci. Technol. Adv. Mater., 2012, 13, 015008 CrossRef PubMed.
- N. Saman, K. Johari and H. Mat, Ind. Eng. Chem. Res., 2014, 53, 1225–1233 CrossRef CAS.
- J. M. Arsuaga, J. Aguado, A. Arencibia and M. S. López-Gutiérrez, Adsorption, 2014, 20, 311–319 CrossRef CAS.
- S. Ravi and M. Selvaraj, Dalton Trans., 2014, 43, 5299 RSC.
- P. Figueira, M. A. O. Lourenço, E. Pereira, J. R. B. Gomes, P. Ferreira and C. B. Lopesad, J. Environ. Chem. Eng., 2017, 5, 5043–5053 CrossRef CAS.
- Y. Shen, N. Jiang, S. S. Liu, C. Zheng, X. Wang, T. Y. Huang, Y. F. Guo and R. B. Bai, J. Environ. Chem. Eng., 2018, 6, 5420–5433 CrossRef CAS.
- X. L. Yan, J. F. Meng, X. Y. Hu, R. Feng and M. Zhou, J. Sol-Gel Sci. Technol., 2019, 89, 617–622 CrossRef CAS.
- M. Kalantari, Z. Y. Gu, Y. X. Cao, C. Lei and J. Zhang, Environ. Sci.: Nano, 2020, 7, 851 RSC.
- J. Dong, Z. H. Xu and F. Wang, Appl. Surf. Sci., 2008, 254, 3522–3530 CrossRef CAS.
- G. L. Li, Z. S. Zhao, J. Y. Liu and G. B. Jiang, J. Hazard. Mater., 2011, 192, 277–283 CAS.
- O. Hakami, Y. Zhang and C. J. Banks, Water Res., 2012, 46, 3913–3922 CrossRef CAS PubMed.
- X. Zhang, T. Wu, Y. Zhang, D. H. Ng, H. Zhao and G. Wang, RSC Adv., 2015, 5, 51446–51453 RSC.
- H. Zhu, Y. Shen, Q. Wang, K. Chen, X. Wang, G. W. Zhang, J. J. Yang, Y. F. Guo and R. B. Bai, RSC Adv., 2017, 7, 39204 RSC.
- Z. Z. Zhang, K. Xia, Z. W. Pan, C. X. Yang, X. Wang, G. W. Zhang, Y. F. Guo and R. B. Bai, Appl. Surf. Sci., 2020, 500, 143970 CrossRef CAS.
- S. X. Zhang, Y. Y. Zhang, J. S. Liu, Q. Xu, H. Q. Xiao, X. Y. Wang, H. Xu and J. Zhou, Chem. Eng. J., 2013, 226, 30–38 CrossRef CAS.
- Z. X. Wang, J. Xu, Y. J. Hu, H. Zhao, J. L. Zhou, Yu Liu, Z. M. Lou and X. H. Xu, J. Taiwan Inst. Chem. Eng., 2016, 60, 394–402 CrossRef CAS.
- X. Wang, Z. Z. Zhang, Y. H. Zhao, K. Xia, Y. F. Guo, Z. Qu and R. B. Bai, Nanomaterials, 2018, 8, 673 CrossRef PubMed.
- Y. H. Zhao, K. Xia, Z. Z. Zhang, Z. M. Zhu, Y. F. Guo and Z. Qu, Nanomaterials, 2019, 9, 455 CrossRef CAS PubMed.
- K. Xia, Y. F. Guo, Q. J. Shao, Q. Zan and R. B. Bai, Nanomaterials, 2019, 9, 1532 CrossRef CAS PubMed.
- Q. S. Qu, Q. Gu, Z. L. Gu, Y. Q. Shen, C. Y. Wang and X. Y. Hu, Colloids Surf., A, 2012, 415, 41–46 CrossRef CAS.
- H. Zou and H. Schlaad, J. Polym. Sci., Part A: Polym. Chem., 2015, 53, 1260–1267 CrossRef CAS.
- Y. G. Lee, J. Park, C. Oh, S. Oh and Y. C. Kim, Langmuir, 2007, 23, 10875–10878 CrossRef CAS PubMed.
- T. S. Deng, Q. F. Zhang, J. Y. Zhang, X. Shen, K. T. Zhu and J. L. Wu, J. Colloid Interface Sci., 2009, 329, 292–299 CrossRef CAS PubMed.
- A. Bertin and H. Schlaad, Chem. Mater., 2009, 21, 5698–5700 CrossRef CAS.
- C. M. Li, J. Liu, L. Zhang, J. Yang and Q. H. Yang, Microporous Mesoporous Mater., 2008, 113, 333–342 CrossRef CAS.
- X. C. Huang, L. B. Wu, J. F. Hsu, S. Shigeto and H. Y. Hsu, Acta Biomater., 2015, 23, 263–270 CrossRef CAS PubMed.
- D. Esquivel, J. Ouwehand, M. Meledina, S. Turner, G. Van Tendeloo, F. J. Romero-Salguero, J. De Clercq and P. Van Der Voort, J. Hazard. Mater., 2017, 339, 368–377 CrossRef CAS PubMed.
- N. V. Stolyarchuk, H. Kolev, M. Kanuchova, R. Keller, M. Vaclavikova and I. V. Melnyk, Colloids Surf., A, 2018, 538, 694–702 CrossRef CAS.
- Q. Z. Zhou, H. F. Xiang, H. S. Fan, X. L. Yang, N. Zhao and J. Xu, J. Mater. Chem., 2011, 21, 13056–13061 RSC.
- S. K. Lagergren, K. Sven. Vetenskapsakad. Handl., 1898, 24, 1–39 Search PubMed.
- Y. S. Ho, J. Hazard. Mater., 2006, 136, 681–689 CrossRef CAS PubMed.
- K. Chen, Z. Z. Zhang, K. Xia, X. J. Zhou, Y. F. Guo and T. Y. Huang, ACS Omega, 2019, 4, 8568–8579 CrossRef CAS PubMed.
- J. G. Yu, Y. B. Yue, X. W. Wu, Q. Liu, F. P. Jiao, X. Y. Jiang and X. Q. Chen, Environ. Sci. Pollut. Res., 2016, 23, 5056–5076 CrossRef CAS PubMed.
| This journal is © The Royal Society of Chemistry 2020 |

