
 Open Access Article
 This Open Access Article is licensed under a Creative Commons Attribution-Non Commercial 3.0 Unported Licence
Cobalt–carbon/silica nanocomposites prepared by pyrolysis of a cobalt 2,2′-bipyridine terephthalate complex for remediation of cationic dyes†
Nusaybah Alotaibi a,
Hassan H. Hammud*a,
Ranjith Kumar Karnatia,
Syed Ghazanfar Hussainb,
Javed Mazherb and
Thirumurugan Prakasamc
a,
Hassan H. Hammud*a,
Ranjith Kumar Karnatia,
Syed Ghazanfar Hussainb,
Javed Mazherb and
Thirumurugan Prakasamc
aDepartment of Chemistry, College of Science, King Faisal University, Al-Ahsa 31982, Saudi Arabia. E-mail: hhammoud@kfu.edu.sa; Tel: +966 13 589 9579
bDepartment of Physics, College of Science, King Faisal University, Al-Ahsa 31982, Saudi Arabia
cChemistry Program, New York University Abu Dhabi (NYUAD), Abu Dhabi, United Arab Emirates
First published on 6th May 2020
Abstract
Recently, carbon nanostructures have attracted interest because of their unique properties and interesting applications. Here, CoC@SiO2-850 (3) and CoC@SiO2-600 (4) cobalt–carbon/silica nanocomposites were prepared by solid-state pyrolysis of anthracene with Co(tph)(2,2′-bipy)·4H2O (1) complex in the presence of silica at 850 and 600 °C, respectively, where 2,2′-bipy is 2,2′-bipyridine and tph is the terephthalate dianion. Moreover, Co(μ-tph)(2,2′-bipy) (2) was isolated and its X-ray structure indicated that cobalt(II) has a distorted trigonal prismatic coordination geometry. 2 is a metal–organic framework consisting of one-dimensional zigzag chains within a porous grid network. 3 and 4 consist of cobalt(0)/cobalt oxide nanoparticles with a graphitic shell and carbon nanotubes embedded in the silica matrix. They were characterized by scanning electron microscopy (SEM), transmission electron microscopy (TEM), powder X-ray diffraction (XRD), Brunauer–Emmett–Teller (BET), Raman spectroscopy, and X-ray photoelectron spectroscopy (XPS). XPS revealed that the nanocomposites are functionalized with oxygen-containing groups, such as carboxylic acid groups. In addition, the presence of metallic cobalt nanoparticles embedded in graphitized carbon was verified by XRD and TEM. The efficiency of 3 for adsorption of crystal violet (CV) dye was investigated by batch and column experiments. At 25 °C, the Langmuir adsorption capacity of 3 for CV was 214.2 mg g−1 and the fixed-bed column capacity was 36.3 mg g−1. The adsorption data were well fitted by the Freundlich isotherm and pseudo-second-order kinetic model. The adsorption process was spontaneous and endothermic.
1. Introduction
Organic dyes are present in the wastewater of various industries, such as the textile, paint, and pigment industries. It has been reported that there are at least 100![[thin space (1/6-em)]](https://www.rsc.org/images/entities/char_2009.gif) 000 commercially available dye types1 and over 10000 tons of dyes are manufactured per annum worldwide. It is assumed that 1–10% of the used dyes are discharged into wastewater.2 Consequently, dyes are one of the main classes of water contaminants. They are harmful to aquatic life and human beings. Long-term exposure to dyes is considered to be a potential health hazard. They may cause skin irritation, respiratory problems, and cancer in humans.3 Thus, effective removal of dyes from wastewater has become a major concern to protect human health. Various methodologies have been developed for removal of toxic dyes from wastewater. Examples are coagulation, oxidation, and biological treatment. However, these techniques either lack flexibility in design and operation or they are very sensitive to different parameters, which limits their efficiency for removal of toxic dyes. Adsorption has become one of the most popular techniques for water purification because of its high performance for having high efficiency of removing pollutants in short time, low cost of adsorbents materials and equipment, ease of operation since no sophisticated equipment is needed. The most common sorbent is activated carbon. However, activated carbon possesses some disadvantages, such as flammability, regeneration difficulties, and weak affinity for cationic and anionic dyes in aqueous solution,4 which decrease its applicability for water treatment. Carbon nanostructures are relatively new sorbents that have some advantages over activated carbon adsorbents. They have been proven to be efficient for removal of different dyes from wastewater. They possess large surface area, high thermal and chemical stabilities,5 and low mass density,6 making them ideal candidates for adsorbents.
000 commercially available dye types1 and over 10000 tons of dyes are manufactured per annum worldwide. It is assumed that 1–10% of the used dyes are discharged into wastewater.2 Consequently, dyes are one of the main classes of water contaminants. They are harmful to aquatic life and human beings. Long-term exposure to dyes is considered to be a potential health hazard. They may cause skin irritation, respiratory problems, and cancer in humans.3 Thus, effective removal of dyes from wastewater has become a major concern to protect human health. Various methodologies have been developed for removal of toxic dyes from wastewater. Examples are coagulation, oxidation, and biological treatment. However, these techniques either lack flexibility in design and operation or they are very sensitive to different parameters, which limits their efficiency for removal of toxic dyes. Adsorption has become one of the most popular techniques for water purification because of its high performance for having high efficiency of removing pollutants in short time, low cost of adsorbents materials and equipment, ease of operation since no sophisticated equipment is needed. The most common sorbent is activated carbon. However, activated carbon possesses some disadvantages, such as flammability, regeneration difficulties, and weak affinity for cationic and anionic dyes in aqueous solution,4 which decrease its applicability for water treatment. Carbon nanostructures are relatively new sorbents that have some advantages over activated carbon adsorbents. They have been proven to be efficient for removal of different dyes from wastewater. They possess large surface area, high thermal and chemical stabilities,5 and low mass density,6 making them ideal candidates for adsorbents.
Several techniques have been developed to prepare carbon nanostructures, including plasma or thermally enhanced chemical vapor deposition,7 arc discharge,8 and laser ablation.9 However, these methods have several disadvantages making them inconvenient for both academic and industrial chemists. They require high energy and expensive instruments. The amount of nanocarbons produced is low and not sufficient for large scales application as column fillers in water treatment industries. Therefore, there is an urgent need to prepare well-developed crystalline graphitic nanostructures by low-cost synthetic procedures. In this respect, an alternative method is the pyrolytic synthesis of novel carbon nanostructures in large-scale from transition metal complex precursors. High reactivity of organometallic precursors in thermal pyrolysis, was reported by Vollhardt and co-workers in an early study.10 They reported that mixing dehydrobenzoannulene (DBA) and Co2(CO)8 increases the reactivity of the organometallic compound through complexation of the alkyne groups. Carbonization of the obtained reactive complex required 200 °C lower compared to cobalt-free DBA. Furthermore, heating to higher temperature 800 °C for 6 h led to the formation of onions, multi-walled carbon nanotubes (CNTs), graphitic and amorphous carbon.10,11 Therefore, solid-state pyrolysis of organometallic complexes under an inert atmosphere is an alternative method for preparing carbon nanostructures with a wide range of sizes and structures. It provides metal nanoparticle catalysts that enhance graphitization at relatively low temperature (catalytic graphitization), while decomposing organic ligand deposits on the metal catalyst to produce the desired carbon nanostructures. In addition, it can result in formation of functionalized metal–carbon nanocomposites, which are considered to be good candidates for dye removal. Furthermore, embedding metals into porous carbon can enhance the adsorption performance, which has recently attracted much interest.12 It has been found that encapsulation of metal particles can circumvent diffusion resistance, promotes mass transfer,13 and provides new properties, such as magnetism.12 It may also create specific binding sites that enhance adsorption.12,14 In addition, the adsorbent can be easily separated from aqueous solution after the adsorption process by applying an external magnetic field instead of centrifugation or filtration.13
Several metal–carbon nanocomposites for dye removal have been reported. For example, Fe2O3/nanoporous carbon showed a maximum adsorption capacity of 292.4 mg g−1 for methylene blue (MB).15 Hammud et al.16 also reported that cobalt–carbon nanocomposites derived from cobalt phenanthroline complex have an adsorption capacity of 492 mg g−1 for malachite green. Recently carbon-based adsorbents have been used by researchers for adsorption of crystal violet: Du et al., Fe3O4–graphene–biochar composite;17 Sellaoui et al., multi-walled carbon nanotubes functionalized with hydroxyl and carboxylic acid groups;18 Wang et al., EDTA/graphene oxide functionalized corncob;19 Hasan et al., zirconia–carbon composite;20 and Mohamed et al., grafted sodium alginate/ZnO/graphene oxide composite.21
Herein, we report the synthesis of highly porous cobalt–carbon/silica nanocomposite CoC@SiO2 by solid-state pyrolysis of Co(μ-tph)(2,2′-bipy)(H2O)2·2H2O in presence of anthracene as an additional carbon source and silica as a supportive substrate. Where 2,2′-bipy is 2,2′-bipyridine and tph is the terephthalate ion. The two ligands were chosen because they provide porous metal–organic framework complexes with cobalt ion. 2,2′-Bipyridine ligand is carbon-rich and can increase the carbon conversion yield. In addition, it is a nitrogen-containing aromatic ligand, and it is expected to play an important role in synthesis of graphitized nitrogen-doped carbon. The oxygen-donor co-ligand tph was used because the bridging properties of the two para carboxylate groups enhance formation of metal–organic frameworks (MOFs) and supramolecular networks ranging from one-dimensional (1D) to three-dimensional (3D) structures. Thus, it can be used to construct complexes with pores, which is crucial for synthesis of derivatized porous carbon nanostructures. Furthermore, cobalt ions are less likely to be leached in weakly acidic solution because of their relatively high stability owing to the graphitic shell.12 The cheap and abundant porous silica was used as substrate in order to provide easy to handle, abundant, stable and regenerable cobalt–carbon/silica nanocomposites CoC@SiO2. Finally, crystal violet (CV) dye has adverse effects on aquatic and human life, including genotoxic and carcinogenic effects. Thus, we have investigated its removal from water by the CoC@SiO2 nanocomposite.
2. Materials and methods
2.1 Materials
All of the chemicals were used as received without further purification. Cobalt(II) nitrate hexahydrate (99%, SDFCL), 1,10-phenanthroline (>99%, Acros Organics), terephthalic acid (>99%, Acros Organics), sodium hydroxide (pure, Acros Organics), ethanol (ACS grade, Scharlau), N,N-dimethylformamide (DMF, 99.9%, Panreact), CV (pure, Acros Organics), MB (pure, Acros Organics), and methyl orange (MO, pure, Acros Organics) were used in the experiments.2.2 Synthesis of Co(tph)(2,2′-bipy)·4H2O (1)
Disodium terephthalate salt was prepared by a literature procedure.22 Sodium hydroxide (2.76 g, 137.92 mmol) was dissolved in deionized water (10 mL). Terephthalic acid (3.46 g, 20.86 mmol) was added to the sodium solution and it was stirred at 60 °C. Deionized water was then slowly added up to 80 mL to completely dissolve the residue and ethanol was added to the solution at 90 °C until the solution produced a white precipitate. The reaction mixture was refluxed at 90 °C for 12 h, and the precipitate was then collected by filtration and dried at 150 °C for 1 h.Co(tph)(2,2′-bipy)·4H2O complex (1) was prepared as follows.23 2,2′-Bipyridine (0.780 g, 5 mmol) was dissolved in absolute ethanol (20 mL) and mixed with an aqueous solution (200 mL) of Co(NO3)2·6H2O (0.914 g, 5 mmol). An aqueous solution (75 mL) of disodium terephthalate (1.05 g, 5 mmol) was gradually added for 2 h under stirring. A light orange precipitate formed and the solution was left to stand overnight. The precipitate was then filtered off, washed with water and ethanol, and left to dry in air, resulting in 0.835 g yield (55.96% based on cobalt). Analysis (%) calc. for C20H20CoN2O8: C, 47.91; H, 4.47; N, 6.21. Found: C, 48.35; H, 4.53; N, 6.0.
2.3 Synthesis of Co(μ-tph)(2,2′-bipy) (2)
Co(μ-tph)(2,2′-bipy) complex (2) was prepared as follows. Cobalt nitrate hexahydrate (0.291 g, 1 mmol) was dissolved in 5 mL of DMF, and then 5 mL of DMF was added to the cobalt solution. Subsequently, 2,2′-bipyridine (0.156 g, 1 mmol) and disodium terephthalate (0.166 g, 1 mmol) were dissolved in 7 mL of DMF and layered over the bilayer solution. After 2 months, red needle crystals suitable for X-ray analysis were obtained and collected.2.4 Solid-state synthesis of the cobalt–carbon silica nanocomposites CoC@SiO2-850 (3) and CoC@SiO2-600 (4)
Co(tph)(2,2′-bipy)·4H2O (1) (0.5 g), anthracene (0.5 g), and silica (0.5 g) were mixed and placed in a crucible in a nitrogen gas furnace and heated at 300 °C for 2 h (intermediate stage) and then at 850 °C for 10 h (final stage). After slow cooling to room temperature, 0.554 g of CoC@SiO2-850 (3) was obtained as a black powder. CoC@SiO2-600 (4) (0.556 g) was obtained as a black powder by a similar procedure with an intermediate stage of 300 °C for 2 h and a final stage of 600 °C for 8 h. Treatment of 4 with 10% acid gave porous nanocomposite 5 with loss of some cobalt by dissolution.2.5 Adsorption study
In all of adsorption experiments, a conical flask containing 50 mL of dye solution with an initial concentration C0 = 50, 100, 150, 200, 250, or 300 mg L−1 and 0.05 g of CoC@SiO2-850 adsorbent (3) was placed in a shaker at a rotation speed of 120 rpm. The concentration of dye remaining in solution Ce (mg L−1) was obtained by recording the absorbance at λmax with a ultraviolet-visible (UV-Vis) spectrophotometer (Shimadzu, UV-1800). λmax was 582, 664, and 464 nm for CV, MB, and MO respectively. The amount of CV dye adsorbed at equilibrium (qe, mg g−1) was then calculated. A fixed-bed column study was performed using a column with 1 cm inner diameter and 22 cm height. The column was packed with 0.5 g adsorbent with glass wool in between. The bed height was about 1.5 cm. The dye solution with an initial concentration of 50 mg L−1 was then added into the column at a flow rate of 1 mL min−1. Effluent aliquots were collected at specified intervals of time and their absorbance was recorded with a UV-Vis spectrophotometer at λmax = 582 nm to determine the residual dye concentration. The column experiments were terminated when the column reached exhaustion. The column bed was regenerated with 0.5 M HCl. Column desorption was confirmed by UV-Vis spectrophotometry. The bed was then washed several time with deionized water until the pH of effluent remained constant at about 7.0. The column was then used for another cycle.2.6 Characterization techniques
Morphological characterization was performed by field emission scanning electron microscopy (FE-SEM, QuantaFEG450, FEI, and JSM-6460LV). Transmission electron microscopy (TEM) images were obtained with a JEM-1011 transmission electron microscope (JEOL, Tokyo, Japan) operated at 80 kV. Powder X-ray Diffraction (XRD) was performed with an Inel Equinox 1000 powder diffractometer equipped with a CPS 180 detector (filtered Co Kα1 irradiation, 30 kV, 30 mA, λ = 1.789 Å, zero background spinning sample holder). The powder patterns were analysed with Mass Crystal Impact software (version 1.11e) for phase identification, and both COD and ICSD databases were used. Raman spectra were recorded with a DXR Raman spectrometer (Thermo Scientific). X-ray photoelectron spectroscopy (XPS) measurements were performed with a SPECS GmbH high vacuum multi-technique surface analysis system equipped with a Mg Kα 1253.6 eV X-ray source. During data analysis, spectra from the surface were calibrated by setting the C 1s line to 284.8 eV. Quantification of the surface composition was obtained from the XPS peak intensities using relative sensitivity factors. Fourier transform infrared (FTIR) spectra were recorded with a Cary 630 FTIR spectrometer (Agilent). Elemental analysis (CHN) was performed with a PerkinElmer 2400 elemental analyser. Nitrogen adsorption measurements were performed with an adsorption apparatus (TriStar II Plus 2.02, Micromeritics). Adsorption isotherms were obtained at 77 K. A degassing process was performed before the measurements. The obtained data were analysed with Micro Active for Tri Star II Plus 2.02 software.2.7 X-ray crystallography
The crystal data and collection details pertaining to single-crystal X-ray analysis of Co(μ-tph)(2,2′-bipy) (2) are given in Table S1.† The XRD data of complex 2 were collected using a Bruker APEX DUO diffractometer equipped with a Cobra cooling device (Oxford Cryosystems) with graphite-monochromated Mo Kα radiation (λ = 0.71073 Å) and a charge-coupled device as the area detector. Data collection, integration, scaling, and absorption correction were performed with Bruker Apex 3 software. Data reduction was performed using SAINT2 and XPREP. All of the data were corrected for Lorentzian, polarization, and absorption effects using the SADABS4 program. Structure determination and refinement using the OLEX2 interface was performed using the full matrix least-squares method based on F2 against all reflections, as implemented in SHELXL2014/7.6. The hydrogen atoms bonded to carbon atoms were fixed using the HFIX command in SHELX-TL.3. Results and discussion
3.1 Characterization of Co(tph)(2,2′-bipy)·4H2O (1)
![[double bond, length as m-dash]](https://www.rsc.org/images/entities/char_e001.gif) N and CC bands of the 2,2′-bipy24 ligand shifted upon complexation, indicating involvement of nitrogen in coordination. In addition, absorption peaks assigned to aromatic C–H vibrations were observed in FTIR spectrum of 1, suggesting coordination of 2,2′-bipy. The bands at 1551, 1381, 742, and 506 cm−1 corresponding to the COO− vibrations of sodium terephthalate25,26 shifted to 1533, 1371, 734, and 504 cm−1. The blue shift was attributed to complexation with the cobalt ion. The coordination mode of terephthalate ion can be determined from the difference between νsym(COO−) and νasym(COO−) frequencies relative to the value of the free terephthalate ion (Δ).27 The Δ value of cobalt complex was lower than that of sodium terephthalate, suggesting that the coordination mode was bidentate.26 The broad band at about 3255 cm−1 indicated the presence of water molecules.
N and CC bands of the 2,2′-bipy24 ligand shifted upon complexation, indicating involvement of nitrogen in coordination. In addition, absorption peaks assigned to aromatic C–H vibrations were observed in FTIR spectrum of 1, suggesting coordination of 2,2′-bipy. The bands at 1551, 1381, 742, and 506 cm−1 corresponding to the COO− vibrations of sodium terephthalate25,26 shifted to 1533, 1371, 734, and 504 cm−1. The blue shift was attributed to complexation with the cobalt ion. The coordination mode of terephthalate ion can be determined from the difference between νsym(COO−) and νasym(COO−) frequencies relative to the value of the free terephthalate ion (Δ).27 The Δ value of cobalt complex was lower than that of sodium terephthalate, suggesting that the coordination mode was bidentate.26 The broad band at about 3255 cm−1 indicated the presence of water molecules.3.2 X-ray structure of Co(μ-tph)(2,2′-bipy) (2)
The polymeric structure of Co(μ-tph)(2,2′-bipy) (2) is a 1D zigzag chain (Fig. 1a). The coordination geometry around Co(II) is distorted trigonal prismatic consisting of CoN2O4 chromophore. Cobalt(II) is coordinated to two bridging bidentate terephthalate ligands and one bidentate 2,2′-bipy ligand. One trigonal face is composed of O14 and O24 oxygen atoms of two opposing terephthalate ligands and the N8 atom of the 2,2′-bipy ligand. The second face is composed of O13 and O23 atoms from two terephthalate ligands and N2 atom of the same 2,2′-bipy ligand. The angle between the planes of the two trigonal faces O14O24N8 and O13O23N2 is 9.33°. This deviates from 0°, which is the expected ideal angle for trigonal prismatic geometry.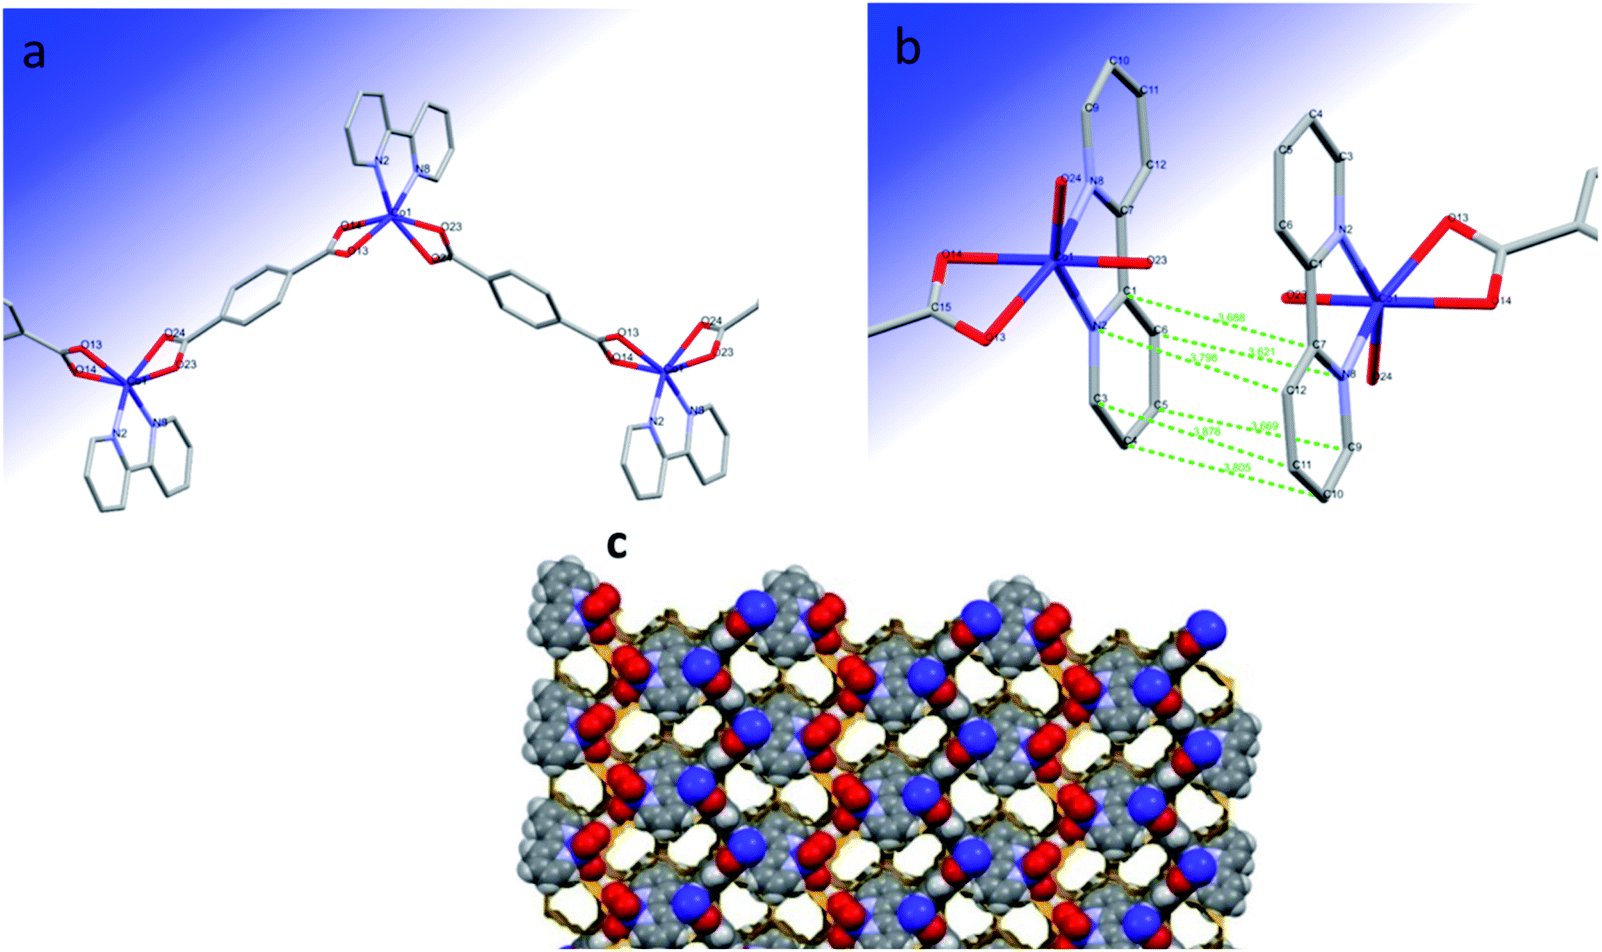 | ||
| Fig. 1 (a) Zigzag chain structure of the trigonal prismatic complex Co(μ-tph)(2,2′-bipy) (2), (b) π–π interaction and (c) 3D network with pores of complex 2. | ||
2 forms a coordination 1D zigzag chain owing to bridging by terephthalate ligands. The zigzag chains form π–π interactions with opposing alternating chains through the rings of the 2,2′-bipy ligands (Fig. 1b) and form a porous grid structure (Fig. 1c). The pores comprise 29.4% of the unit cell volume (619.43 Å3). The centroid–centroid separation between the two opposing rings is 3.738 Å. The opposing 2,2′-bipy ligands are perfectly parallel. The interplanar distance and angle are 3.450 Å and 0°, respectively. The atom–atom distances between the 2,2′-bipy rings are 3.805, 3.878, 3.669, 3.798, 3.688, and 3.621 Å, indicating strong π–π interactions.
3.3 Synthesis of the cobalt–carbon silica nanocomposite (CoC@SiO2)
Upon pyrolysis of cobalt complex 1, anthracene was added in 1:1 weight ratio as an additional bulk carbon source to increase the carbon yield and carbon to cobalt ratio. Furthermore, because it has adjacent aromatic rings, it can be considered to be graphene segments, which increases the chance of obtaining highly graphitized carbon nanostructures. Silica particles were also added in 1:1 complex:silica weight ratio. The suggested mechanism involves dissociation of the carbon precursors, deposition of carbon on the silica surface, and filling of the pores. The silica template can be removed using NaOH or HF solution.29 However, removing the silica support may cause structural changes or collapse of the carbon structures during template dissolution.30 Therefore, the cobalt–carbon nanostructure was used without post-treatment.
3.4 Characterization of CoC@SiO2
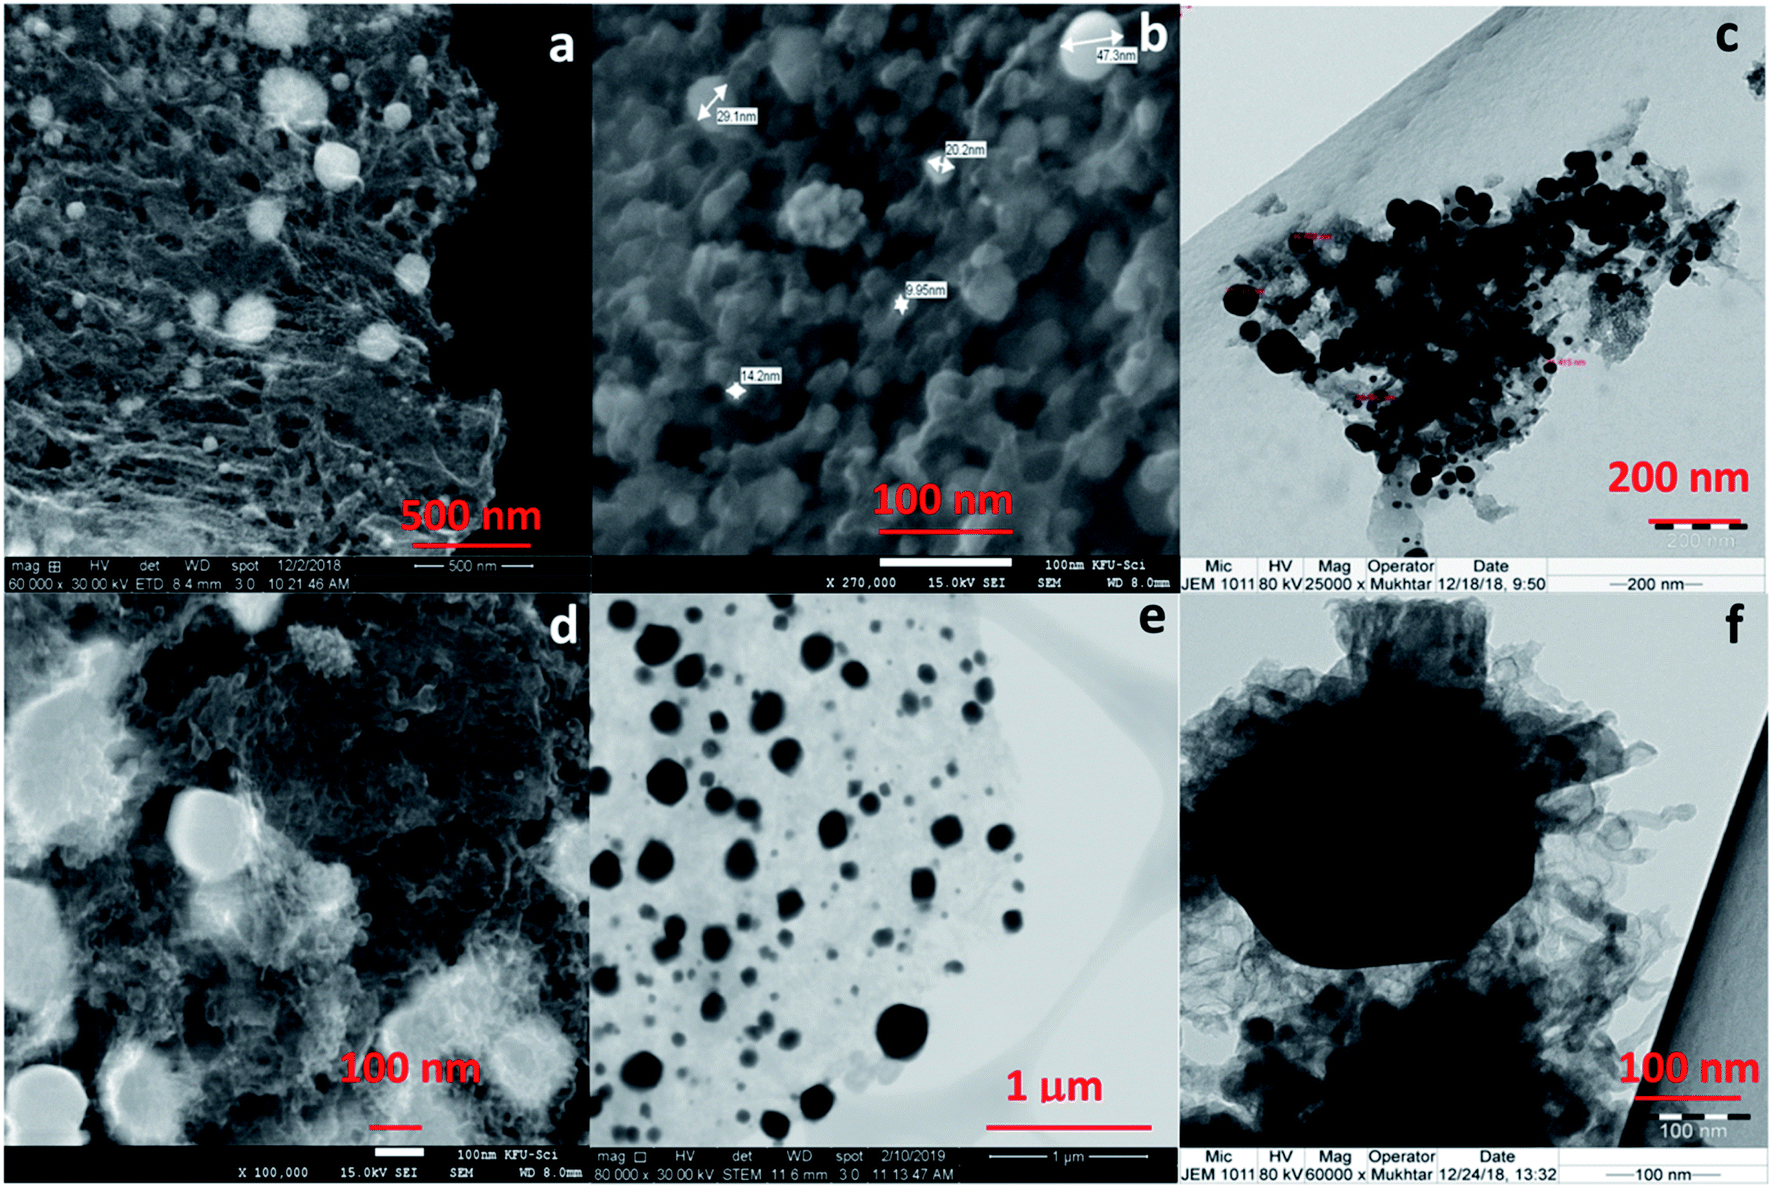 | ||
| Fig. 2 SEM images of CoC@SiO2-600 (4) (a and b), TEM image of CoC@SiO2-600 (4) (c), SEM images of CoC@SiO2-850 (3) (d and e) and TEM image of CoC@SiO2-850 (3) (f). | ||
The change in the type of nitrogen donor ligand or its combination with terephthalic ligand make difference in the structure of cobalt complex. Pyrolysis of complex provide cobalt nanoparticles, the “graphitization catalyst” which in turn determine the morphology of nanocarbon. The morphology of cobalt nanocarbon 3 is affected by the structure of catalyst precursor, the metal–organic framework cobalt complex 1. The structure of complex MOF with empty pores will results in porous nanocarbon of high surface area for better adsorption, catalytic and electrical property. Thus, the change in starting materials can improve the performance of these nanocomposites by studying the morphology of product and correlating it to adsorption performance. In other word, there should be a noticeable correlation between the preparation procedure (starting materials and heating temperature), structure of nano, and the capacity of adsorption. This is in order to optimize the experiment for better performance of nanocarbon as adsorbent. It is noteworthy to mention that the support used also affects the morphology and functional groups of the nanocarbon. Here we have used polar silica, while in another preliminary study we have used the less polar graphite as support and found that the morphology of nanocomposite product has changed.
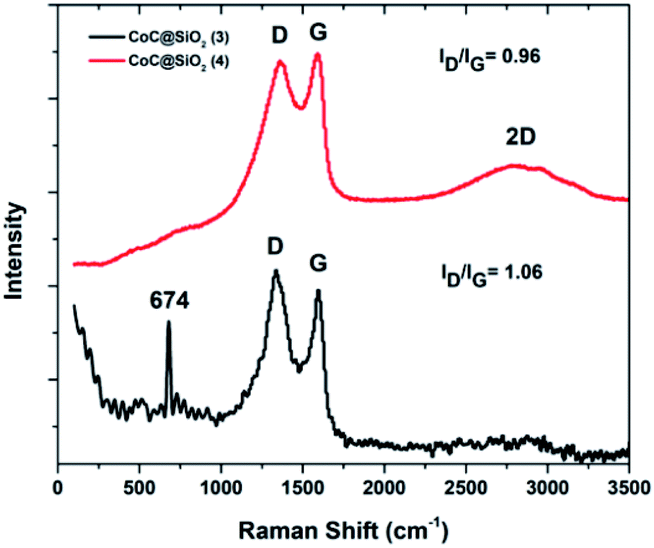 | ||
| Fig. 3 Raman spectra of CoC@SiO2-850 (3) and CoC@SiO2-600 (4). | ||
The ratio of disordered to graphitic carbon can be represented by the ratio of their corresponding intensities ID/IG, which is commonly used as a measure of the degree of graphitization.38 The ID/IG ratio for 4 was = 0.9, whereas that for 3 was 1.07 with a well-separated sharp G band. The third characteristic peak of graphite and graphene is known as the 2D band, which appears in the second-order region. Its width and shape are highly dependent on the stacking order of the graphene sheets along the c axis and the number of layers.39–41
3 showed a broad 2D band at about 2750 cm−1 with relatively low intensity owing to the large number of graphene layers,37 suggesting that 3 had more graphene layers than 4. In addition, an extra sharp peak was observed at 674 cm−1 in the Raman spectrum of 3, which is characteristic of the A1g mode of cobalt monoxide (CoO).42
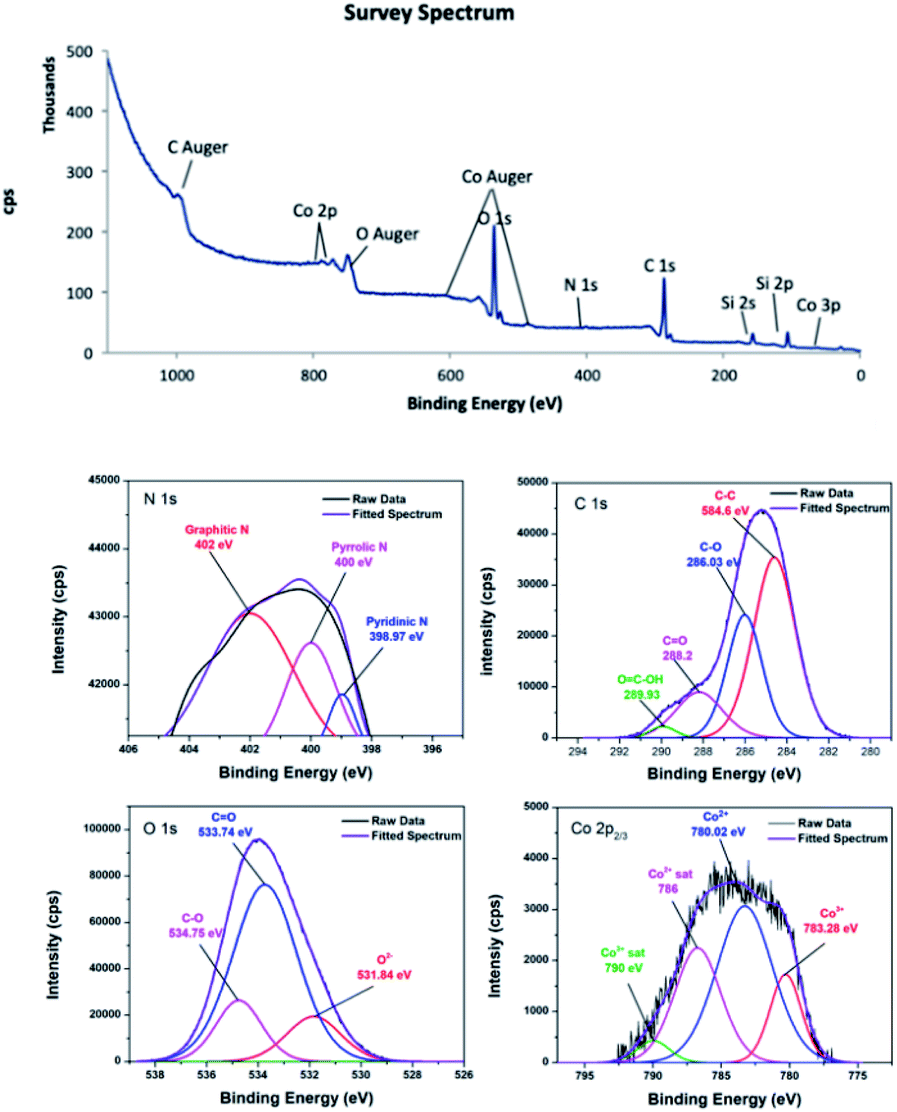
O, and COOH on the material surface.45,46 In the C 1s XPS spectrum of 4, the two peaks corresponding to C–O and CO appeared at 286.03 and 288.2 eV. The shift to higher energy can be attributed to nitrogen doping, because incorporation of nitrogen into graphitic carbon results in disordering of the graphene lattice.47,48 For 4, the peak corresponding to the carboxylic acid group was centred at 289.93 eV.49 Furthermore, the peak positions obtained by deconvolution of the O 1s spectra confirmed that different oxygen species were present on the carbon surfaces. The peak located at 531.18 eV in the O 1s spectrum of 3 was attributed to the Co–O bond or hydroxyl group,50,51 while the peak located at 531.84 eV in the O 1s spectrum of 4 was residual oxygen functional groups.52 The peaks centred at 532.78 and 534.13 eV in the O 1s spectrum of 3 were attributed to CO and C–O groups, respectively.53,54 These peaks shifted to higher energies of 533.74 and 534.75 eV in the O 1s spectrum of 4. In addition, the deconvoluted Co 2p3/2 spectra confirmed the oxidation states of the cobalt species. Although Co2+ and Co3+ appear at similar binding energies, they can be distinguishable when Co3O4 is present.55 It is noticeable that 3 and 4 contained a mixture of Co2+ and Co3+. In the Co 2p3/2 XPS spectrum of 3, the Co3+ peak was observed at about 781.13 eV accompanied by a relatively weak satellite peak at about 790.0 eV,56 whereas the Co3+ peak was at about 780.02 eV for 4.57 The peak at about 783.45 eV was attributed to Co2+.58 The XPS survey spectrum of 4 showed a trace amount of nitrogen, confirming successful nitrogen doping. The nature of nitrogen can be deduced from the deconvoluted N 1s spectrum. The deconvoluted spectrum showed peaks at 398.9, 400, and 401.81 eV, which were attributed to pyridinic, pyrrolic, and graphitic nitrogen, respectively.59–61
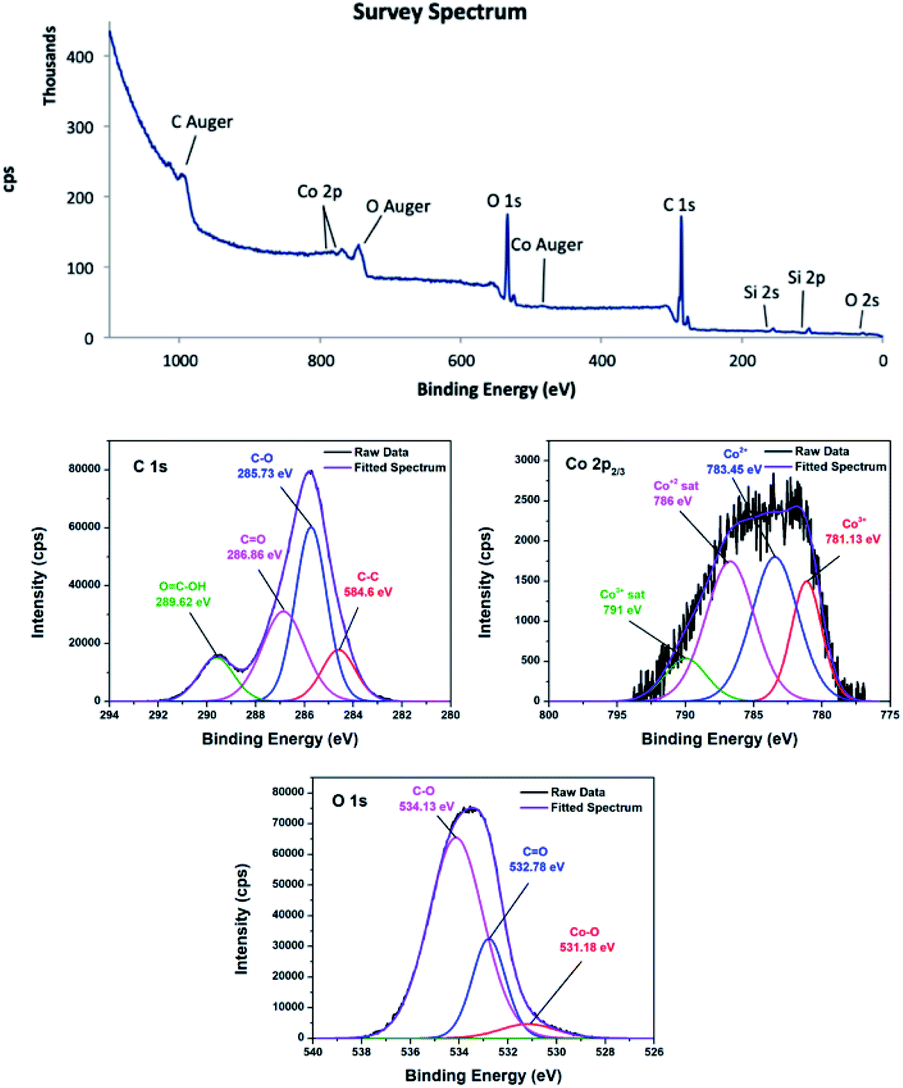 | ||
| Fig. 4 XPS survey of CoC@SiO2-850 (3), C 1s, O 1s and Co 2p3/2 spectra. | ||
 | ||
| Fig. 5 XPS survey of CoC@SiO2-850 (4), C 1s, O 1s and Co 2p3/2 spectra. | ||
The atomic% of carbon calculated from the peak intensities are 70% and 55.7% for 3 and 4, respectively. In contrast, 3 has relatively lower oxygen content (29.6%) than 4 (43.5%), assuming that pyrolysis temperature should be sufficiently high in order to obtain nanocomposite with high carbon content. In addition, the Co2+/Co3+ in 3 is 3.18 and 1.82 in 4. It can be concluded that Co2+/Co3+ is highly sensitive toward pyrolysis temperature.
 | (1) |
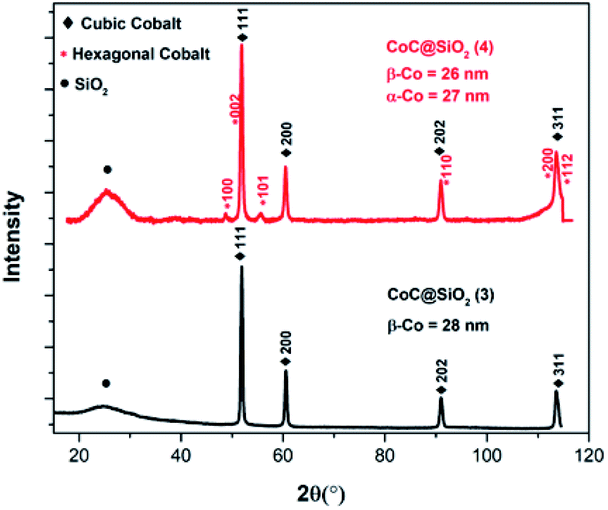 | ||
| Fig. 6 XRD patterns of CoC@SiO2-850 (3) and CoC@SiO2-600 (4). | ||
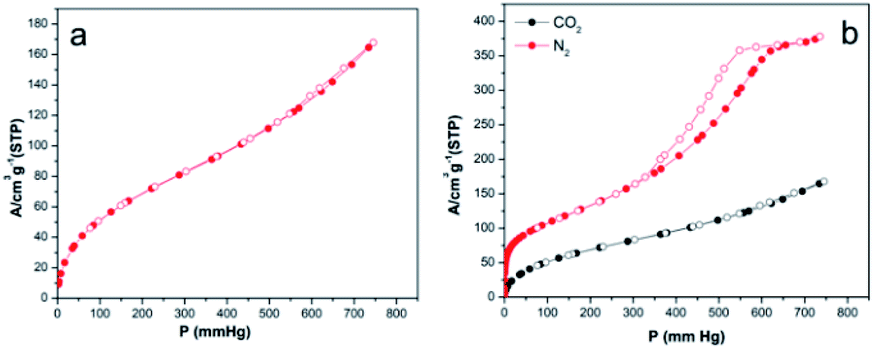 | ||
| Fig. 7 Nitrogen adsorption/desorption isotherm of 3 (a), nitrogen adsorption/desorption and carbon dioxide adsorption/desorption isotherms of 5 (b). | ||
3 exhibited gradual nitrogen uptake for P < 450, and then the uptake rapidly increased, resulting in nitrogen uptake of 50.95 cm3 g−1 at 743.9 mmHg. In addition, the hysteresis loop was significantly broader than that of 5, suggesting a different pore shape because the capillary condensation mechanism is highly dependent on the pore structure of mesoporous materials.64 The surface areas, pore volumes, and pore sizes of 3 and 5 are given in Table S3.† The surface areas of 5 calculated by the BET, single point, and Barrett–Joyner–Halenda (BJH) methods were significantly greater than those of 3, and the pore size of the pyrolytic product increased with increasing pyrolysis temperature.
3.5 Adsorption of CV to CoC@SiO2-850 (3)
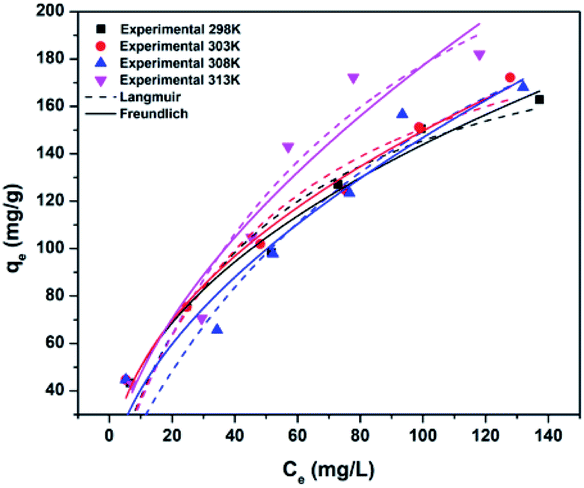 | ||
| Fig. 8 Freundlich and Langmuir non-linear fits of adsorption of CV to CoC@SiO2-850 (3) at different temperatures. | ||
To choose the best isotherm model to represent CV adsorption, the experimental data obtained at different temperatures after achieving equilibrium (24 h contact time) were fitted to the Langmuir and Freundlich isotherm models by non-linear (Fig. 8) and linear regression. The correlation coefficient (R2), Chi2, and sum of the squared error (SSE) values were used to determine the best isotherm for the experimental data.
Adsorption of CV followed the Freundlich model better than the Langmuir model because of the higher correlation coefficient and lower Chi2 and SSE values for the Freundlich model than for the Langmuir model (Table 1). The agreement of the experimental data with the Freundlich isotherm suggested that the adsorbed CV cations formed a multilayer on the surface of 3.
| Langmuir | Freundlich | |||||
|---|---|---|---|---|---|---|
| Parameter | Linear | Non-linear | Parameter | Linear | Non-linear | |
| 298 K | qmax (mg g−1) | 202.02 | 214.16 | KF (mg g−1) (L mg−1)1/n | 18.33 | 17.30 |
| KL (L mg−1) | 0.0261 | 0.0212 | n | 2.2430 | 2.1736 | |
| R2 | 0.9446 | 0.9363 | R2 | 0.9892 | 0.9835 | |
| Chi2 | 0.9776 | 133.49 | Chi2 | 0.9956 | 34.55 | |
| SSE | 0.0132 | 533.98 | SSE | 0.0107 | 138.19 | |
| RL | 0.1131 | 0.0035 | ||||
| 303 K | qmax (mg g−1) | 206.61 | 230.23 | KF (mg g−1) (L mg−1)1/n | 21.02 | 16.74 |
| KL (L mg−1) | 0.0269 | 0.0189 | n | 2.3774 | 2.1026 | |
| R2 | 0.9128 | 0.9076 | R2 | 0.9819 | 0.9847 | |
| Chi2 | 0.9645 | 208.52 | Chi2 | 0.9927 | 34.37 | |
| SSE | 0.0187 | 834.09 | SSE | 0.0179 | 137.49 | |
| RL | 0.1101 | 0.1495 | ||||
| 308 K | qmax (mg g−1) | 225.22 | 314.31 | KF (mg g−1) (L mg−1)1/n | 19.55 | 11.16 |
| KL (L mg−1) | 0.0186 | 0.0090 | n | 2.3558 | 1.7868 | |
| R2 | 0.7535 | 0.8745 | R2 | 0.8744 | 0.9201 | |
| Chi2 | 0.8960 | 303.33 | Chi2 | 0.9484 | 193.2101 | |
| SSE | 0.0489 | 1213.32 | SSE | 0.1343 | 772.8405 | |
| RL | 0.1515 | 0.2687 | ||||
| 313 K | qmax (mg g−1) | 278.55 | 321.18 | KF (mg g−1) (L mg−1)1/n | 12.93 | 12.61 |
| KL (L mg−1) | 0.0163 | 0.01235 | n | 1.7701 | 1.7427 | |
| R2 | 0.7892 | 0.9204 | R2 | 0.9308 | 0.9125 | |
| Chi2 | 0.9118 | 250.32 | Chi2 | 0.9719 | 275.30 | |
| SSE | 0.0196 | 1001.28 | SSE | 0.0888 | 1101.20 | |
| RL | 0.1692 | 0.2125 | ||||
Upon treatment of 10 mL of dye with an initial concentration of 100 ppm with 0.04 g of 3 for 24 h at 25 °C, the % removal of CV (98.3%) was little higher than that of MB (96.6%) and MO (88.3%) (Fig. S4†). The prepared cobalt nanocarbon acted efficiently as adsorbent for these three dyes. But the focus in this paper was only on crystal violet.
Interestingly, 3 showed almost equal capacities for anionic and cationic dyes, suggesting that π–π interaction between the aromatic rings of the dye and nanocarbon plays a major role in the adsorption process.
An in-depth understanding of adsorption mechanism aids in determining the rate-limiting step, which in turn aids in optimizing the adsorption conditions.81 The rate-controlling step can be film diffusion, where the adsorbate passes through the boundary layer to the external surface of the adsorbent particles, and/or intra-particle diffusion, where adsorbate molecules move into the interior of the adsorbent particles.82
The Weber–Morris intra-particle diffusion equation is widely used to determine if intra-particle diffusion is the rate-controlling step.79
| qt = Kit1/2 + Ci | (2) |
Applying the Weber–Morris intra-particle diffusion equation resulted in a double linear plot, suggesting that the adsorption process occurs in two stages before it reaches its equilibrium (Fig. S5†). The first line is attributed to instantaneous or external surface adsorption. The second line is attributed to the intra-particle diffusion stage, where the dye molecules diffuse through the pores of the adsorbent.86 Adsorption was initially rapid owing to availability of vacant adsorption sites. After 90 min, adsorption slowed down in the second stage owing to fractional occupation of the adsorption sites and blocking of their accessibility. The linear line of the second stage did not pass through the origin. Therefore, intra-particle diffusion was not the only rate-limiting step but other mechanisms were involved.79 The contribution of surface adsorption to the rate-controlling step can be deduced from the value of Ci because it represents the thickness of the boundary layer. The contribution of surface adsorption to the rate-limiting step is greater for larger Ci value.76,79 Applying the intra-particle diffusion equation gave Ki = 0.52907 mg g−1 min−1/2 and Ci = 36.7035 mg g−1 with R2 = 0.9080.
K versus 1/T.67,87 The positive ΔH value (18.902 kJ mol−1) indicated that the adsorption process was endothermic in nature. This agrees with the isotherm results, where qmax increased with increasing temperature (Table 1). The positive ΔS value (66.367 J mol−1 K−1) indicated the spontaneous nature of the adsorption process in the temperature range investigated. The increase of the ΔG value with increasing temperature (−0.875 at 298 K, −1.207 at 303 K, −1.539 at 308 K and −1.871 at 313 K) indicated that the adsorption process was more favourable at high temperature.C stretching vibration of the aromatic ring and the C–N stretching vibration of the aromatic tertiary amine of CV, respectively.89 Except for the two bands assigned to CV, no new peaks appeared after adsorption, suggesting that the adsorption process occurred by weak bonds, such as π–π stacking of the aromatic rings between CV and the carbon nanostructures.3.5.8.1 Breakthrough curves. A breakthrough curve is a plot of the ratio of the solute concentration in the effluent to its concentration in the feed solution (Ce/C0) against time (min) or effluent volume (mL). A fixed-bed adsorption column was studied in order to investigate the capability, regeneration and recycling efficiency of (3) in the continuous adsorption system. In the desorption process, dilute hydrochloric acid was used as a suitable eluting agent since it is inexpensive and widely used as elution agent for desorbing cationic dyes from adsorbents.
The breakthrough curves for the three cycles of CV adsorption onto (3) in the fixed-bed column are shown in Fig. 9. In the first cycle, the breakthrough point was reached after 120 min. In the second and third cycles, the breakthrough point occurred after about 50 min. In addition, it is obvious that the column in the first cycle and the second cycles required more than 720 min to be fully saturated and reach equilibrium, while it required only 290 min in the first cycle. Fig. S7† shows the plot of the concentration of adsorbed amount of CV (Cad), versus time (t) for each cycle, from which the area under the breakthrough curve was determined.90,91 The maximum bed capacity (qe) is 36.29, 22.85 and 12.30 mg g−1 for the first, second and third cycles, respectively, while the percentage removal is 50.40% in the first cycle. It decreased to 42.40% in the third cycle.
 | ||
| Fig. 9 Yan et al. non-linear fit of adsorption of CV using column packed with 3. | ||
The first desorption cycle of 3 required about 200 mL of 0.5 M HCl solution at a flow rate of 1 mL min−1, after which further desorption was negligible. Around 47.3% of the CV species were desorbed in the first cycle and the eluting solution was initially highly concentrated, which leads to easy handling, recovery and reuse of CV. The column bed was then washed with deionized water with continuous measurement of the pH, to ensure the removal of excess H+ ions from the column. Mineral acids are proton-exchange agents that can extract CV cations from 3. An excessive amount of H+ ions can reduce the CV adsorption uptake. Therefore, washing 3 with deionized water can remove H+ ions and thus 3 can be regenerated for use in further adsorption cycles.
The relatively low efficiency of HCl solution as an elution agent is because of the strongly adsorbed CV, which may require higher concentration of HCl. In addition, this explains the decrease in capacities of the bed column in the second and third cycles.
3.5.8.2 Column kinetic study. Several models can be used to describe the column behaviour, including the Thomas,92 Yoon–Nelson,93 and Yan et al.94 models.
The Thomas model assumes that the adsorption process follows Langmuir kinetics of adsorption–desorption with negligible axial dispersion in the column because the rate-driving force follows pseudo-second-order reversible kinetics. The non-linear expression of the Thomas model is
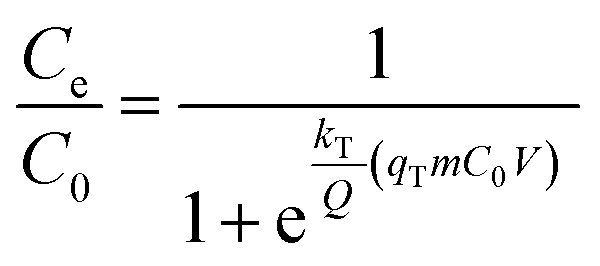 | (3) |
The Yoon–Nelson model assumes that the rate of decrease of the probability of adsorption for each adsorbate species is proportional to the probability of adsorbate adsorption and the probability of adsorbate breakthrough on the adsorbent. The non-linear form of the Yoon–Nelson model is
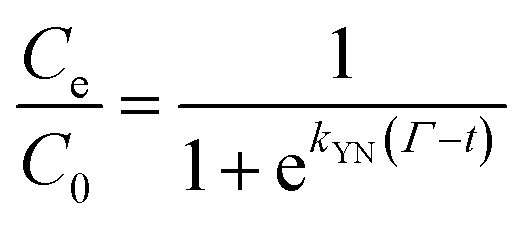 | (4) |
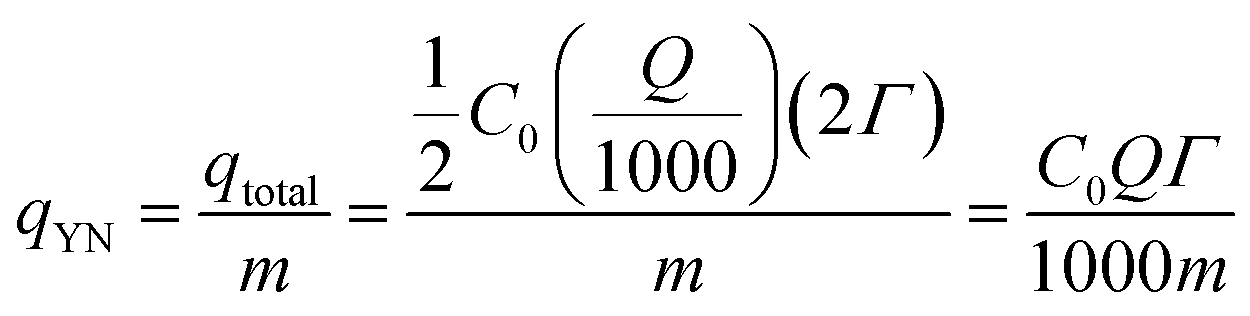 | (5) |
The empirical Yan et al.94 model can overcome the limitations of the Thomas model, especially its inability to predict the effluent concentration with respect to zero time. The non-linear form of the Yan et al. model is
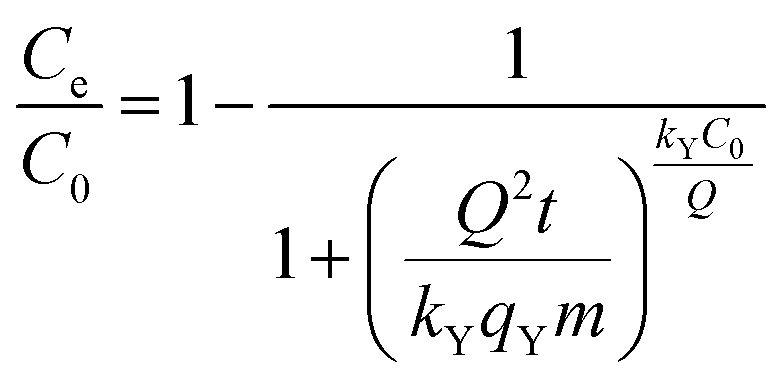 | (6) |
Comparing the values of Chi2, SSE, and R2 (Table 2), Yan et al. model fits the experimental data best with the highest R2 value and lowest Chi2 and SSE values (Fig. 9). Thus, the Yan et al. model can be used to describe the adsorption behaviour of CV to 3 in the fixed-bed column. The value of correlation coefficients for Thomas and Yoon–Nelson models were lower than that for the Yan et al. model under the same experimental conditions, which makes them less applicable. The column capacities obtained by the Thomas and Yoon–Nelson models were 20.66 mg g−1, and that obtained by the Yan et al. model was 8.49 mg g−1 (Table 2).
| Thomas | Yoon–Nelson | Yan et al. | |||
|---|---|---|---|---|---|
| Cycle 1 | |||||
| kT (mL min−1 mg−1) | 0.1279 | kYN (min−1) | 0.0064 | kY (mL min−1 mg−1) | 0.04031 |
| qT (mg g−1) | 35.80 | qYN (mg g−1) | 35.80 | qY (mg g−1) | 15.88 |
| Γ (min) | 358.09 | ||||
| R2 | 0.9408 | R2 | 0.9408 | R2 | 0.9891 |
| Chi2 | 0.00467 | Chi2 | 0.00467 | Chi2 | 0.00085 |
| SSE | 0.3270 | SSE | 0.3270 | SSE | 0.06018 |
|
|||||
| Cycle 2 | |||||
| kT (mL min−1 mg−1) | 0.207 | kYN (min−1) | 0.01039 | kY (mL min−1 mg−1) | 0.04279 |
| qT (mg g−1) | 20.66 | qYN (mg g−1) | 20.66 | qY (mg g−1) | 8.49 |
| Γ (min) | 206.65 | ||||
| R2 | 0.94403 | R2 | 0.9440 | R2 | 0.9945 |
| Chi2 | 0.00518 | Chi2 | 0.00518 | Chi2 | 0.00051 |
| SSE | 0.3627 | SSE | 0.36267 | SSE | 0.03589 |
|
|||||
| Cycle 3 | |||||
| kT (mL (min−1 mg−1)) | 0.645 | kYN (min−1) | 0.03229 | kY (mL (min−1 mg−1)) | 0.07775 |
| qT (mg g−1) | 12.53 | qYN (mg g−1) | 12.52 | qY (mg g−1) | 3.09 |
| Γ (min) | 125.29 | ||||
| R2 | 0.9805 | R2 | 0.9805 | R2 | 0.9964 |
| Chi2 | 0.00282 | Chi2 | 0.00282 | Chi2 | 0.00051 |
| SSE | 0.07605 | SSE | 0.07605 | SSE | 0.01397 |
4. Conclusion
1D zigzag chain of new polymeric structure of the porous MOF Co(μ-tph)(2,2′ bipy) (2) was successfully synthesized and the crystal structure was confirmed by single-crystal X-ray. The 1D chains are stacked in alternating fashion along “a” axis through π–π interactions to form a 3D supramolecular network. In addition, CoC@SiO2 nanocomposites with interesting morphologies were also successfully synthesized by solid-state pyrolysis of a mixture of the mixed-ligand complex Co(tph)(2,2′-bipy)·4H2O (1), anthracene and silica. Based on SEM and TEM, pyrolysis at 600 °C gave CoC@SiO2-600 (4) with sponge-like cobalt–carbon nanostructures, while pyrolysis at 850 °C gave CoC@SiO2-850 (3) with a rough surface decorated with pointing cobalt species and CNTs, suggesting that the morphology of nanocarbon, size and shape of the cobalt species are highly dependent on the pyrolysis temperature. Furthermore, XPS revealed that the carbon nanostructures were functionalized with different oxygen-containing functional groups, including carboxylic acid group. In addition, the presence of metallic cobalt nanoparticles embedded within the graphitized carbon was confirmed by XRD. The efficiency of (3) for removal of CV from aqueous solution was also investigated. The Langmuir adsorption capacity was 214 mg g−1. It was found that the adsorption process best fitted Freundlich isotherm and pseudo-second-order kinetic model. In addition, thermodynamic study, showed that the adsorption process was endothermic and entropically favourable. In addition, ΔG values indicated that the adsorption process was spontaneous and more favourable at higher temperature. Furthermore, fixed-bed column study showed that the adsorption capacity was 36.29 mg g−1 and that Yan et al. model adequately described the continuous adsorption process.Conflicts of interest
There are no conflicts to declare.Acknowledgements
The authors acknowledge the Deanship of Scientific Research at King Faisal University for the financial support under Annual Research Project (Grant No. 180101). Prof. Michael Zaworotko, University of Limerick, is acknowledged for his contribution to gas adsorption analysis.References
- V. K. Gupta, J. Environ. Manage., 2009, 90, 2313–2342 CrossRef CAS PubMed.
- E. Forgacsa, T. Cserháti and G. Orosb, Environ. Int., 2004, 30, 953–971 CrossRef PubMed.
- H. S. Rai, M. S. Bhattacharyya, J. Singh, T. K. Bansal, P. Vats and U. C. Banerjee, Crit. Rev. Environ. Sci. Technol., 2005, 35, 219–238 CrossRef CAS.
- A. K. Mishra, T. Arockiadoss and S. Ramaprabhu, Chem. Eng. J., 2010, 162, 1026–1034 CrossRef CAS.
- Y.-H. Li, J. Ding, Z. Luan, Z. Di, Y. Zhu, C. Xu, D. Wu and B. Wei, Carbon, 2003, 41, 2787–2792 CrossRef CAS.
- C. Chen, J. Hu, D. Xu, X. Tan, Y. Meng and X. Wang, J. Colloid Interface Sci., 2008, 323, 33–41 CrossRef CAS PubMed.
- M. Endo, K. Takeuchi, S. Igarashi, K. Kobori, M. Shiraishi and H. W. Kroto, J. Phys. Chem. Solids, 1993, 54, 1841–1848 CrossRef CAS.
- S. Iijima, Nature, 1991, 354, 56–58 CrossRef CAS.
- T. Guo, P. Nikolaev, A. Thess, D. T. Colbert and R. E. Smalley, Chem. Phys. Lett., 1995, 243, 49–54 CrossRef CAS.
- P. I. Dosa, C. Erben, V. S. Iyer, K. P. C. Vollhardt and I. M. Wasser, J. Am. Chem. Soc., 1999, 121, 10430–10431 CrossRef CAS.
- S. Rondeau-Gagné and J.-F. Morin, Chem. Soc. Rev., 2014, 43, 85–98 RSC.
- L. Tang, Y. Cai, G. Yang, Y. Liu, G. Zeng, Y. Zhou, S. Li, J. Wang, S. Zhang, Y. Fang and Y. He, Appl. Surf. Sci., 2014, 314, 746–753 CrossRef CAS.
- Y. Pang, G. Zeng, L. Tang, Y. Zhang, Y. Liu, X. Lei, Z. Li, J. Zhang and G. Xie, Desalination, 2011, 281, 278–284 CrossRef CAS.
- T. Phenrat, Y. Liu, R. D. Tilton and G. V. Lowry, Environ. Sci. Technol., 2009, 43, 1507–1514 CrossRef CAS PubMed.
- C. Jiao, Y. Wang, M. Li, Q. Wu, C. Wang and Z. Wang, J. Magn. Magn. Mater., 2016, 407, 24–30 CrossRef CAS.
- H. H. Hammud, B. El Hamaoui, N. H. Noubani, X. Feng, Z.-S. Wu, K. Mullen and K. Ayub, Nanosci. Nanotechnol.--Asia, 2018, 8, 263–280 CrossRef CAS.
- C. Du, Y. Song, S. Shi, B. Jiang, J. Yang and S. Xiao, Sci. Total Environ., 2020, 711, 134662 CrossRef CAS PubMed.
- L. Sellaoui, G. L. Dotto, E. C. Peres, Y. Benguerba, É. C. Lima, A. Ben Lamine and A. Erto, J. Mol. Liq., 2017, 248, 890–897 CrossRef CAS.
- H. Wang, X. Lai, W. Zhao, Y. Chen, X. Yang, X. Meng and Y. Li, RSC Adv., 2019, 9, 21996–22003 RSC.
- Z. Hasan, D.-W. Cho, I.-H. Nam, C.-M. Chon and H. Song, Materials, 2016, 9, 261 CrossRef PubMed.
- S. K. Mohamed, S. H. Hegazy, N. A. Abdelwahab and A. M. Ramadan, Int. J. Biol. Macromol., 2018, 108, 1185–1198 CrossRef CAS PubMed.
- Y. Park, D.-S. Shin, S. H. Woo, N. S. Choi, K. H. Shin, S. M. Oh, K. T. Lee and S. Y. Hong, Adv. Mater., 2012, 24, 3562–3567 CrossRef CAS PubMed.
- J. Rogan, D. Poleti, L. Karanović, G. Bogdanović, A. Spasojević-De Biré and D. M. Petrović, Polyhedron, 2000, 19, 1415–1421 CrossRef CAS.
- N. Preda, L. Mihut, M. Baibarac, I. Baltog, M. Husanu, C. Bucur and T. Velula, Rom. J. Phys., 2009, 54, 667–675 CAS.
- H. T. Varghese, C. Y. Panicker, D. Philip, K. Sreevalsan and V. Anithakumary, Spectrochim. Acta, Part A, 2007, 68, 817–822 CrossRef PubMed.
- C. A. Téllez S, E. Hollauer, M. Mondragon and V. M. Castaño, Spectrochim. Acta, Part A, 2001, 57, 993–1007, DOI:10.1016/S1386-1425(00)00428-5.
- M. Nara, H. Torii and M. Tasumi, J. Phys. Chem., 1996, 100, 19735–20174 CrossRef.
- R. J. Acheson and A. K. Galwey, J. Chem. Soc. A, 1967, 1174–1178 RSC.
- J. Liu, N. P. Wickramaratne, S. Z. Qiao and M. Jaroniec, Nat. Mater., 2015, 14, 763–774 CrossRef CAS PubMed.
- L. Lafi, D. Cossement and R. Chahine, Carbon, 2005, 43, 1347–1357, DOI:10.1016/j.carbon.2004.12.032.
- X. Liu, B. Frank, W. Zhang, T. P. Cotter, R. Schlögl and D. S. Su, Angew. Chem., Int. Ed., 2011, 50, 3318–3322 CrossRef CAS PubMed.
- M. B. Vázquez-Santos, E. Geissler, K. László, J.-N. Rouzaud, A. Martínez-Alonso and J. M. D. Tascón, J. Phys. Chem. C, 2012, 116, 257–268 CrossRef.
- A. Das, B. Chakraborty and A. K. Sood, Bull. Mater. Sci., 2008, 31, 579–584 CrossRef CAS.
- X. Duan, H. Son, B. Gao, J. Zhang, T. Wu, G. G. Samsonidze, M. S. Dresselhaus, Z. Liu and J. Kong, Nano Lett., 2007, 7, 2116–2121 CrossRef CAS PubMed.
- A. Das, S. Pisana, B. Chakraborty, S. Piscanec, S. K. Saha, U. V Waghmare, K. S. Novoselov, H. R. Krishnamurthy, A. K. Geim, A. C. Ferrari and A. K. Sood, Nat. Nanotechnol., 2008, 3, 210–215 CrossRef CAS PubMed.
- D. Graf, F. Molitor, K. Ensslin, C. Stampfer, A. Jungen, C. Hierold and L. Wirtz, Nano Lett., 2007, 7, 238–242 CrossRef CAS PubMed.
- D. Wei, Y. Liu, Y. Wang, H. Zhang, L. Huang and G. Yu, Nano Lett., 2009, 9, 1752–1758 CrossRef CAS PubMed.
- G. Yuan, X. Li, Z. Dong, A. Westwood and B. Rand, Carbon, 2013, 68, 426–439 CrossRef.
- A. C. Ferrari, J. C. Meyer, V. Scardaci, C. Casiraghi, M. Lazzeri, F. Mauri, S. Piscanec, D. Jiang, K. S. Novoselov, S. Roth and A. K. Geim, Phys. Rev. Lett., 2006, 97, 187401 CrossRef CAS PubMed.
- A. Gupta, G. Chen, P. Joshi, S. Tadigadapa and P. C. Eklund, Nano Lett., 2006, 6, 2667–2673 CrossRef CAS PubMed.
- M. A. Pimenta, G. Dresselhaus, M. S. Dresselhaus, L. G. Cançado, A. Jorio and R. Saito, Phys. Chem. Chem. Phys., 2007, 9, 1276–1290 RSC.
- N. Sanpo, C. C. Berndt, A. S. M. Ang and J. Wang, Surf. Coat. Technol., 2013, 232, 247–253 CrossRef CAS.
- Y. Huang, Y. Gao, Q. Zhang, Y. Zhang, J. Cao, W. Ho and S. C. Lee, J. Hazard. Mater., 2018, 354, 54–62 CrossRef CAS PubMed.
- Y. Zhu, J. Cui, S. An, Z. Li, Y. Zhang and W. He, J. Alloys Compd., 2019, 810, 151932 CrossRef CAS.
- S. Indrawirawan, H. Sun, X. Duan and S. Wang, Appl. Catal., B, 2015, 179, 352–362 CrossRef CAS.
- M. B. Ahmed, J. L. Zhou, H. H. Ngo, W. Guo, A. H. Johir, K. Sornalingam, D. Belhaj and M. Kallel, Chem. Eng. J., 2017, 322, 571–581 CrossRef CAS.
- Z. Mou, X. Chen, Y. Du, X. Wang, P. Yang and S. Wang, Appl. Surf. Sci., 2011, 258, 1704–1710 CrossRef CAS.
- R. Droppa Jr, P. Hammer, A. C. M. Carvalho, M. C. Dos Santos and F. Alvarez, J. Non-Cryst. Solids, 2002, 299, 874–879 CrossRef.
- K. Tadyszak, K. Chybczyńska, P. Ławniczak, A. Zalewska, B. Cieniek, M. Gonet and M. Murias, J. Magn. Magn. Mater., 2019, 492, 165656 CrossRef CAS.
- Y. Ge, K. Kan, Y. Yang, L. Zhou, L. Jing, P. Shen, L. Li and K. Shi, J. Mater. Chem. A, 2014, 2, 4961–4969, 10.1039/c3ta14607c.
- H. Wang, C. Qing, J. Guo, A. A. Aref, D. Sun, B. Wang and Y. Tang, J. Mater. Chem. A, 2014, 2, 11776–11783 RSC.
- G. Bharath, R. Madhu, S.-M. Chen, V. Veeramani, D. Mangalaraj and N. Ponpandian, J. Mater. Chem. A, 2015, 3, 15529–15539 RSC.
- M. M. Aghayan, Appl. Organomet. Chem., 2019, 33, 1–11 Search PubMed.
- X. Miao, D. Qu, D. Yang, B. Nie, Y. Zhao and H. Fan, Adv. Mater., 2018, 30, 1704740 CrossRef PubMed.
- A. Gabe, J. García-Aguilar, Á. Berenguer-Murcia, E. Morallón and D. Cazorla-Amorós, Appl. Catal., B, 2017, 217, 303–312 CrossRef CAS.
- P. W. Menezes, A. Indra, D. González-Flores, N. R. Sahraie, I. Zaharieva, M. Schwarze, P. Strasser, H. Dau and M. Driess, ACS Catal., 2015, 5, 2017–2027 CrossRef CAS.
- K. J. Kim, J. H. Lee, T. Y. Koh and M. H. Kim, Electrochim. Acta, 2016, 200, 84–89 CrossRef CAS.
- X. Zhang, J. Zhao, Z. Song, H. Zhao and W. Liu, ChemistrySelect, 2019, 4, 8902–8909 CrossRef CAS.
- Y. Liu, Z. Jin, J. Wang, R. Cui, H. Sun, F. Peng, L. Wei, Z. Wang, X. Liang and L. Peng, Adv. Funct. Mater., 2011, 21, 986–992 CrossRef CAS.
- T. Susi, T. Pichler and P. Ayala, Beilstein J. Nanotechnol., 2015, 6, 177–192 CrossRef PubMed.
- T. Schiros, D. Nordlund, L. Pálová, D. Prezzi, L. Zhao, K. S. Kim, U. Wurstbauer, C. Gutiérrez, D. Delongchamp and C. Jaye, Nano Lett., 2012, 12, 4025–4031 CrossRef CAS PubMed.
- J. Sort, J. Nogués, S. Suriñach, J. S. Muñoz and M. D. Baró, Mater. Sci. Eng., A, 2004, 375–377, 869–873 CrossRef.
- K. S. W. Sing, Pure Appl. Chem., 1985, 57(4), 603–619 CAS.
- S. J. Gregg and K. S. W. Sing, Adsorption Surface Area and Porosity, Academic Press, London, 2nd edn, 1982 Search PubMed.
- S. Dantas, K. C. Struckhoff, M. Thommes and A. V. Neimark, Langmuir, 2019, 35, 11291–11298 CrossRef CAS PubMed.
- Q. Yang, P. Hou, S. Bai, M. Wang and H. Cheng, Chem. Phys. Lett., 2001, 345, 18–24 CrossRef CAS.
- Z. Liu and F. S. Zhang, J. Hazard. Mater., 2009, 167, 933–939 CrossRef CAS PubMed.
- S. K. Low, M. C. Tan and N. L. Chin, Ultrason. Sonochem., 2018, 48, 64–70 CrossRef CAS PubMed.
- J. Fu, Z. Chen, M. Wang, S. Liu, J. Zhang, J. Zhang, R. Han and Q. Xu, Chem. Eng. J., 2015, 259, 53–61 CrossRef CAS.
- M. S. Chiou and H. Y. Li, Chemosphere, 2003, 50, 1095–1105 CrossRef CAS PubMed.
- A. S. Negi and S. C. Anand, Textbook of Physical Chemistry, New Age International, New Delhi, 1985 Search PubMed.
- I. Langmuir, J. Am. Chem. Soc., 1917, 39, 1848–1906 CrossRef CAS.
- T. W. Weber and R. K. Chakravorti, AIChE J., 1974, 20, 228–238 CrossRef CAS.
- K. Y. Foo and B. H. Hameed, Chem. Eng. J., 2010, 156, 2–10 CrossRef CAS.
- H. M. F. Freundlich, J. Phys. Chem., 1906, 57, 385–471 CAS.
- A. Gürses, Ç. Doǧar, M. Yalçin, M. Açikyildiz, R. Bayrak and S. Karaca, J. Hazard. Mater., 2006, 131, 217–228 CrossRef PubMed.
- S. K. Lagergren, K. Sven. Vetenskapsakad. Handl., 1898, 24, 1–39 Search PubMed.
- W. Rudzinski and W. Plazinski, J. Phys. Chem. B, 2006, 110, 16514–16525 CrossRef CAS PubMed.
- M. A. Ahmad and R. Alrozi, Chem. Eng. J., 2011, 171, 510–516 CrossRef CAS.
- Y.-S. Ho and G. McKay, Water Res., 2000, 34, 735–742 CrossRef CAS.
- H. K. Boparai, M. Joseph and D. M. O'Carroll, J. Hazard. Mater., 2011, 186, 458–465 CrossRef CAS PubMed.
- E. Worch, Adsorption Technology in Water Treatment: Fundamentals, Processes, and Modeling, Walter de Gruyter GmbH, Dresden, 2012 Search PubMed.
- I. A. W. Tan, A. L. Ahmad and B. H. Hameed, J. Hazard. Mater., 2009, 164, 473–482 CrossRef CAS PubMed.
- B. H. Hameed and M. I. El-Khaiary, J. Hazard. Mater., 2008, 154, 639–648 CrossRef CAS PubMed.
- A. A. Lewinsky, Hazardous Materials and Wastewater: Treatment, Removal and Analysis, Nova Science Publishers, New York, 2007 Search PubMed.
- Q. Huang, X. Lin, L. Xiong, C. Huang, H. Zhang, M. Luo, L. Tian and X. Chen, RSC Adv., 2017, 7, 23896–23906 RSC.
- P. W. Atkins, Physical Chemistry, Oxford University Press, London, 4th edn, 1990 Search PubMed.
- J. Serra, P. González, S. Liste, C. Serra, S. Chiussi, B. León, M. Pérez-Amor, H. O. Ylänen and M. Hupa, J. Non-Cryst. Solids, 2003, 332, 20–27 CrossRef CAS.
- J. Cheriaa, M. Khaireddine, M. Rouabhia and A. Bakhrouf, Sci. World J., 2012, 2012, 512454 Search PubMed.
- B. Sivasankar, Engineering Chemistry, Tata McGraw-Hill Education, New Delhi, 2008 Search PubMed.
- S. H. Hasan, D. Ranjan and M. Talat, J. Hazard. Mater., 2010, 181, 1134–1142 CrossRef CAS PubMed.
- H. C. Thomas, J. Am. Chem. Soc., 1944, 66, 1664–1666 CrossRef CAS.
- Y. H. Yoon and J. H. Nelson, Am. Ind. Hyg. Assoc. J., 1984, 45, 509–516 CrossRef CAS PubMed.
- G. Yan, T. Viraraghavan and M. Chen, Adsorpt. Sci. Technol., 2001, 19, 25–43 CrossRef CAS.
- Z. Aksu and F. Gönen, Process Biochem., 2004, 39, 599–613 CrossRef CAS.
- J. Qu, Y. Li, T. Zang, Y. Jin, X. Liu and L. Yan, Environ. Eng. Sci., 2019, 36, 1162–1169 CrossRef CAS.
Footnote |
| † Electronic supplementary information (ESI) available: Additional figures and tables and X-ray crystallographic data. CCDC 1966192 contains the supplementary crystallographic data for crystal (2) in this paper. For ESI and crystallographic data in CIF or other electronic format see DOI: 10.1039/d0ra02752a |
| This journal is © The Royal Society of Chemistry 2020 |