
 Open Access Article
 This Open Access Article is licensed under a
 Creative Commons Attribution 3.0 Unported Licence
Effect of temperature and large guest molecules on the C–H symmetric stretching vibrational frequencies of methane in structure H and I clathrate hydrates†
Go Fuseya a,
Satoshi Takeyab and
Akihiro Hachikubo*a
a,
Satoshi Takeyab and
Akihiro Hachikubo*a
aKitami Institute of Technology, 165, Koen-cho, Kitami 090-8507, Japan. E-mail: hachi@mail.kitami-it.ac.jp
bNational Institute of Advanced Industrial Science and Technology (AIST), Central 5, 1-1-1, Higashi, Tsukuba 305-8565, Japan
First published on 6th May 2020
Abstract
Large molecules such as 2-methylbutane (C5H12) or 2,2-dimethylbutane (C6H14) form structure H (sH) hydrates with methane (CH4) as a help gas. In this study, the Raman spectra of the C–H symmetric stretch region of CH4 enclathrated within various sH hydrates and structure I CH4 hydrates were analyzed in the temperature range 137.7–205.4 K. Thermal expansions of these sH hydrate samples were also measured using powder X-ray diffraction. Symmetric stretch vibrational frequencies of CH4 in host–water cages increased because of varying temperature, and the sizes of the host–water cages also increased; variation of CH4 in small cages was less than in larger cages. Comparing the variations of the C–H symmetric stretching frequencies of CH4 in gas hydrates with varying pressure and temperature, we suggest that the observed trend is caused by thermal vibrations of the CH4 molecule in water cages.
Introduction
Clathrate hydrates are crystalline inclusion compounds that consist of guest molecules of suitable sizes and shapes trapped in well-defined cages formed by water molecules. Both synthetic and naturally occurring clathrate hydrates with natural gases as guest molecules are commonly known as gas hydrates. Gas hydrates with enclathrated hydrocarbon gases that exist in sea/lake bottom sediments and permafrost layers have attracted considerable interest as a potential source of unconventional natural gas.1Three typical crystal structures of clathrate hydrates have been identified on earth: cubic structure I (sI), cubic structure II (sII), and hexagonal structure H (sH).2–4 The unit cell of sI hydrates comprises two pentagonal dodecahedral (512) and six tetrakaidecahedral (51262) water cages.2 For sII hydrates, the unit cell is formed by sixteen 512 cages and eight hexakaidecahedral (51264) water cages.3 Finally, the unit cell of sH hydrates comprises three 512 cages, two irregular dodecahedral (435663) cages, and one icosahedral (51268) cage4 as shown in Fig. 1. Small guest molecules such as methane (CH4) or ethane form sI-type hydrates, whereas larger molecules like propane or 2-methylpropane (C4H10) form sII hydrates. sH hydrates are obtained from even larger molecules, e.g., 2-methylbutane (C5H12) or 2,2-dimethylbutane (C6H14), in the presence of a help gas as CH4.1 Moreover, sH hydrate that is capable of encapsulating these larger molecules in natural gas than either structure I or II hydrates was found at the Barkley Canyon (northern Cascadia margin).5 Since sH hydrates exhibit a hexagonal structure (space group P6/mmm), there are two unit-cell parameters, a-axis and c-axis (Fig. 1). Under isothermal conditions, the lattice size of clathrate hydrates has been reported to change depending on the type of guest molecule. For sH hydrates, large guests cause an increase in the a-axis direction and a slight decrease in the c-axis direction.6
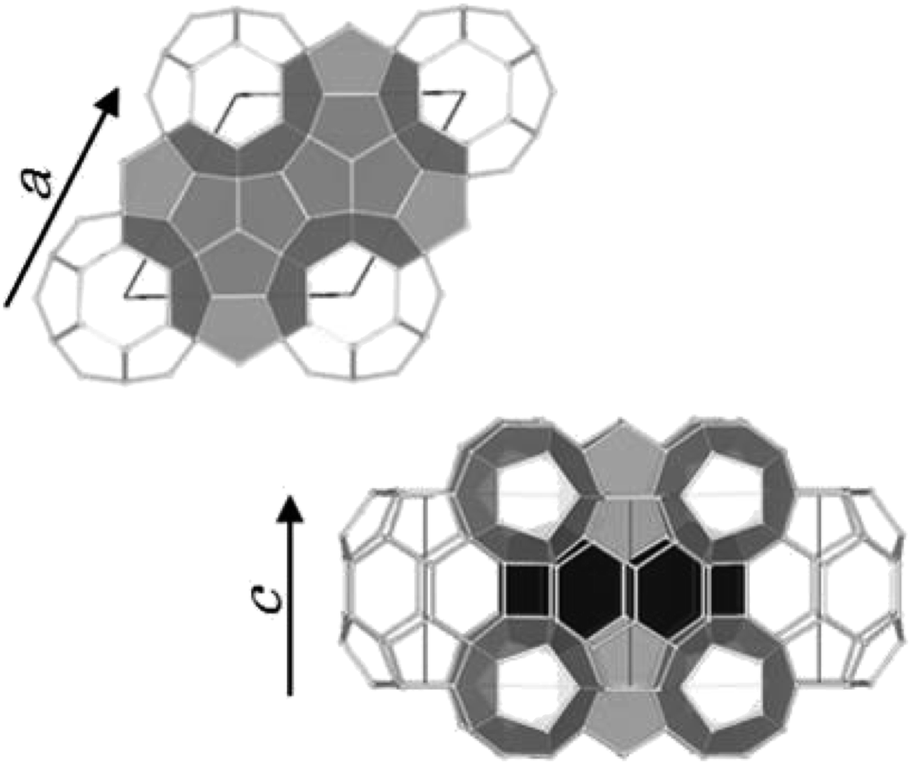 | ||
| Fig. 1 Unit cell of sH hydrates. The unit-cell comprises three 512 cages (light gray), two 435663 cages (black), and one 51268 cage (white). | ||
To date, Raman spectroscopy has been commonly used for gas hydrates to identify the type of crystal phase7–9 and phase transformations10,11 or to analyze cage occupancy,7 type of guest molecule,9 and hydration number.7,12 The Raman spectra of the C–H symmetric stretch region of enclathrated CH4 are commonly used to identify the types of crystal phase and guest molecules.13 Trends in the C–H stretching vibrational frequency of CH4 enclosed in different clathrate hydrate cages have therefore been studied. Experimentally, the Raman spectra of hydrocarbon hydrates have demonstrated that the C–H stretching frequency of CH4 in large cages is generally lower than that for CH4 in small cages.7–9 This observation was rationalized by Subramanian and Sloan9 in terms of the guest–cage intermolecular interactions using the loose cage–tight cage (LCTC) model as an explanation for matrix-isolation IR experiments.14 Also, a qualitative agreement between experimental results and theoretical calculations for CH4 enclathrated in sI and sH hydrates was obtained using ab initio MD simulations.15–17 Additionally, using quantum-chemical computations, the C–H stretching frequencies of hydrocarbons in different clathrates were demonstrated to be lower in larger cages.18 This vibrational frequency for CH4 enclosed in a water cage may change depending on temperature, and these information are useful for better understanding of the stability of gas hydrates under natural setting. However, thermal effects such as thermal expansion of water cages have not been considered for these calculations yet.
In this study, various sH CH4 and large-molecule mixed hydrates and an sI CH4 hydrate were prepared, and the Raman spectra in the C–H symmetric stretch region of enclathrated CH4 were studied in a temperature range of 137.7–205.4 K. Thermal expansions of all samples were also measured using powder X-ray diffraction (PXRD). From these results, the variations in Raman spectra of the C–H symmetric stretch and the guest–host interaction energy with varying temperature are discussed; moreover, the differences in crystal structures are analyzed. The results of this study help to consider computational elements of follow theoretical calculation study of thermal effect on sH hydrate and sI CH4 hydrates, also may help to better understand the effect of temperature on clathrate hydrate stability and guest–host interactions.
Experimental section
Sample preparation
In this study, six large-molecule guest substances as shown in Fig. 2 were used. Six gas hydrate samples were prepared: CH4 + 2,2-dimethylbutane (22DMB); CH4 + 2,3-dimethylbutane (23DMB); CH4 + 3-methylpentane (3MP); CH4 + 2-methylbutane (2MB); CH4 + methylcyclopentane (MCP); and CH4 + methylcyclohexane (MCH). To synthesize these gas hydrate samples, fine ice powder (3.0 g) was prepared and loaded onto a high-pressure cell (internal volume: ∼20 mL), which was precooled in a freezer at 253 K. Afterwards, 0.3 mL of the large-molecule guest was added into the cell (Wako Pure Chemical Industries Ltd.; 22DMB 99.3%; 23DMB 99.9%; 3MP 99.6%; 2MB 99.6%; MCP 97.9%; MCH 99.8%). To prevent melting of ice or evaporation of the guest molecules, the high-pressure cell and hydrate components were precooled in a cold room at 253 K. After loading at 253 K, the high-pressure cell was cooled to below 90 K and pure CH4 gas (99.99% certified purity; Takachiho Chemical Industrial Co. Ltd.) was slowly introduced into the cell. Then, the high-pressure cell was transferred into a water bath at 273.2 K for hydrate formation. The CH4 applied pressure was maintained at 2.2–2.3 MPa to not form pure sI CH4 hydrate. As the hydrates formed, the pressure decreased. When the pressure stabilized, the cell was cooled below 90 K and the sample was removed from the cell. For the sI CH4 hydrate (MH), powder ice (3.0 g) was loaded into the cell, and the cell was pressurized using CH4 to over 2.6 MPa.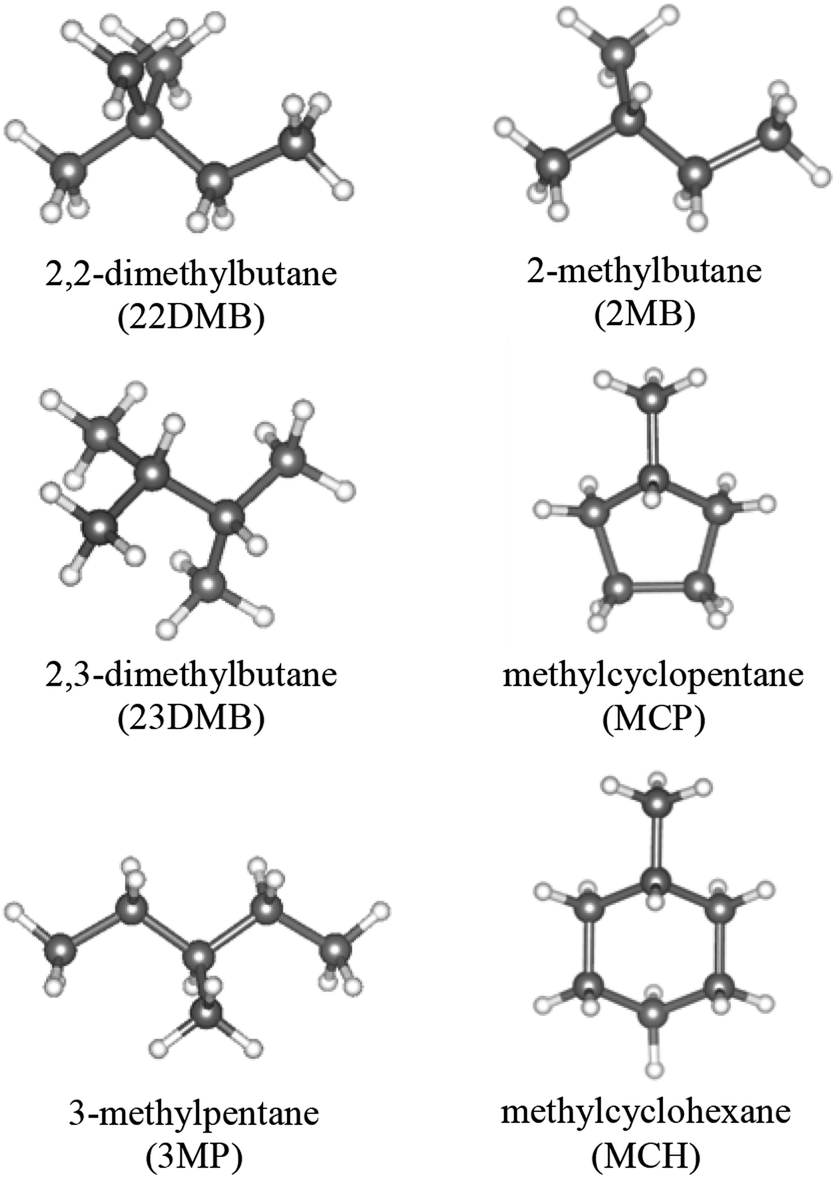 | ||
| Fig. 2 Structures of the large-molecule guest. | ||
Raman spectroscopy
A Raman spectrometer (JASCO Corporation, RMP-210) equipped with a 532 nm excitation source (100 mW), a single holographic diffraction grating (1800 grooves per mm), and a CCD detector was used. The spectrum pixel resolution, which is the sampling interval of the spectrum, was 0.9 cm−1 per pixel in the range of 2500–3000 cm−1. A polypropylene peak at 1460 cm−1 was used for routine calibration of the monochromator. The wave number was also calibrated using atomic emission lines from a neon lamp. The Raman spectra for the C–H symmetric stretch region of enclathrated CH4 in small cages of six sH mixed-gas hydrates and the sI CH4 hydrate were obtained for a temperature range of 137.7–205.4 K. The sample temperature was confirmed using a thermocouple (Type T; Ninomiya Electric Wire Co. Ltd., 01-T). The calibrated thermocouple was accurate within 0.1 °C. Here, the peak position can be rigorously analysed by Voigt fitting functions to obtain a high positional accuracy. Based on the reproducibility of the CH4 peak position of the sH 512 and 435663 cages of CH4 + 2MB hydrate at 163.6 K, the standard deviation of peak positions, which is 18 times measurement at same sample position, was approximately 0.1 cm−1.Powder X-ray diffraction
PXRD measurements were performed using a laboratory X-ray diffractometer (40 kV, 40 mA; RIGAKU model Ultima-III) with parallel beam optics and a low-temperature chamber. Fine powder hydrate samples were mounted on a PXRD sample holder made of 2.5 mm thick Cu at a temperature comparable to liquid N2 (∼100 K). Each measurement was obtained in a θ/2θ step scan mode with a step width of 0.02° using Cu Kα radiation (λ = 1.541 Å).Results and discussion
As expected, PXRD measurements showed that the crystal structure of the six different gas hydrates was sH (Fig. S1†). The effect of temperature on the unit-cell parameters in the range of 93–168 K is shown in Fig. 3 for all samples. Each unit-cell size and effect of temperature varied with varying unit-cell parameters differ with guest molecules. However, unit-cell parameters of all the samples increased with increasing temperature and volume expansion of unit cells.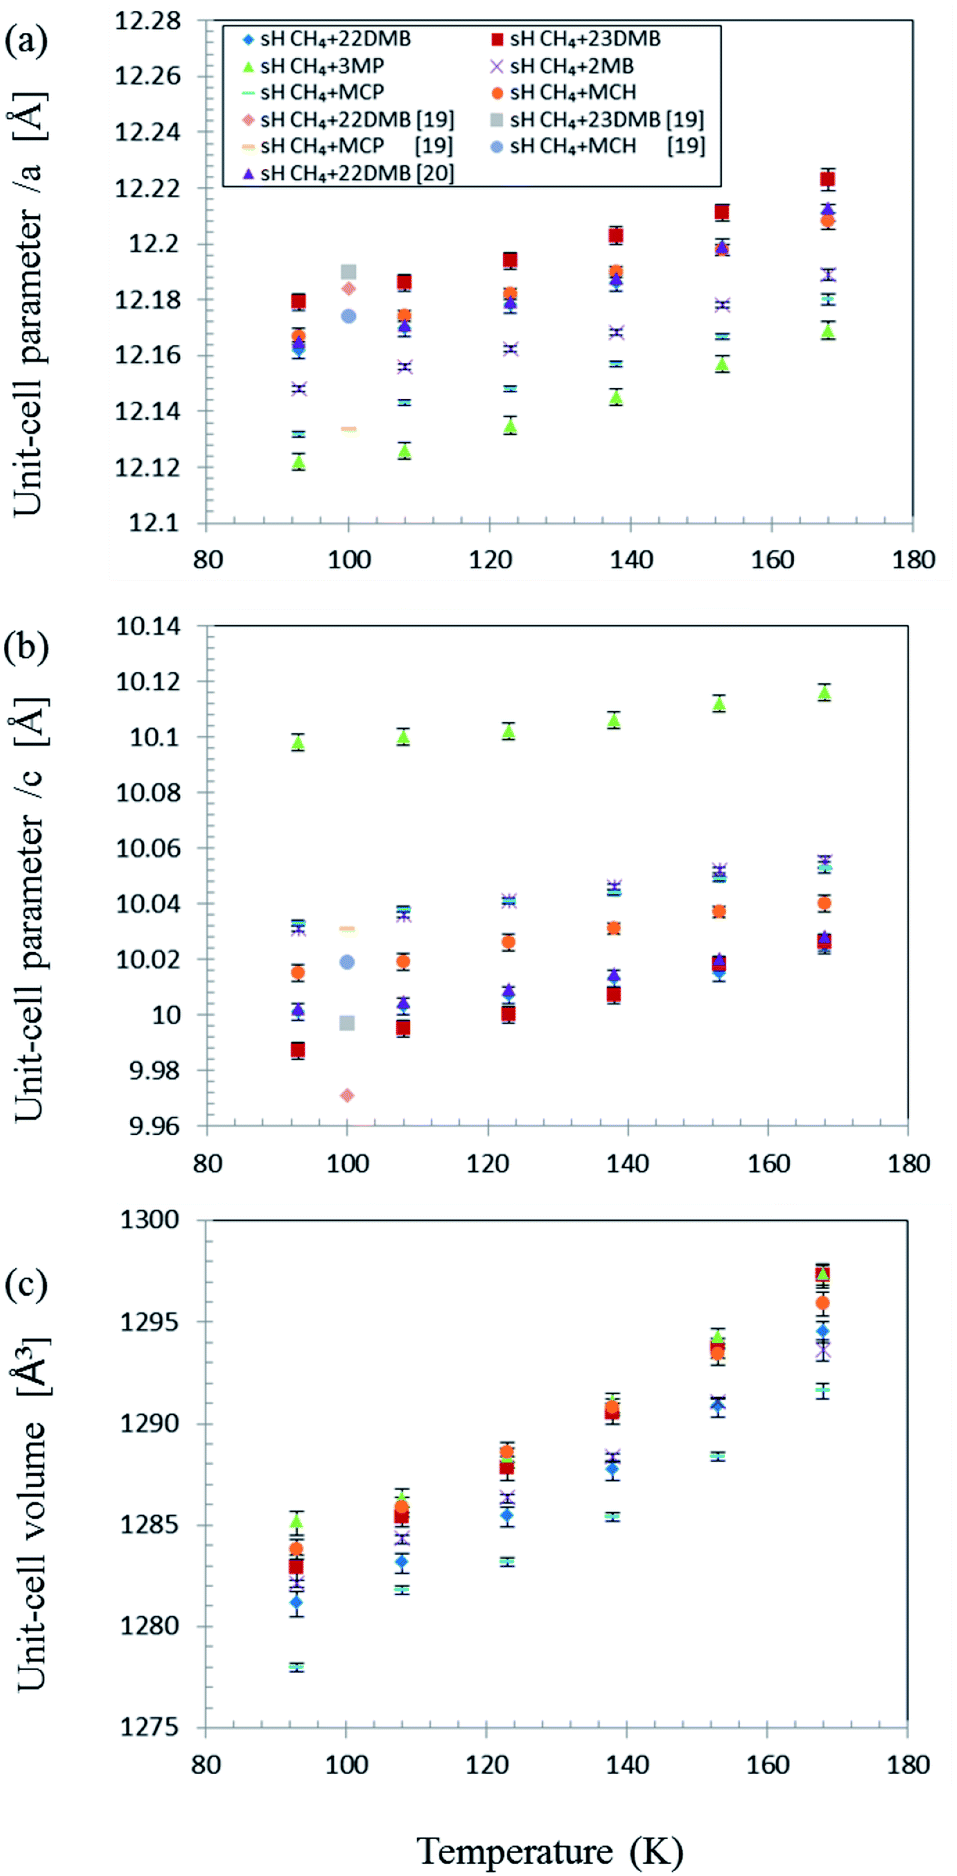 | ||
| Fig. 3 Effect of temperature on sH hydrate unit-cell parameters with various guest molecules and CH4. (a) a-axis; (b) c-axis; (c) unit-cell volume.19,20 | ||
Fig. 4 also depicts the C–H symmetric stretch of CH4 in the 512 and 51262 cages of the sI CH4 hydrate for comparison. Information from each Raman spectrum of CH4 in the 512 and 51262 cages is summarized in Table 1. In the case of sI CH4 hydrate, Raman spectra on CH4 vibrations in the 512 and 51262 cages agree well with those of natural methane hydrate21 and results from molecular dynamics simulation.22 Sum et al. reported that the Raman peaks of CH4 in the 512 cages of sI and sH are 2915 and 2913 cm−1, respectively.7 Experimental results in this study are in agreement with the earlier study. It is suggested that CH4 is enclathrated into the sH 51268 cages under high-pressure condition at above 1.36 GPa and the Raman peak appears around 2930 cm−1.23 However, such peaks were not detected at around 2930 cm−1 (Fig. 4) because large molecules fully occupied the 51268 cages as is reported in earlier studies.24–26
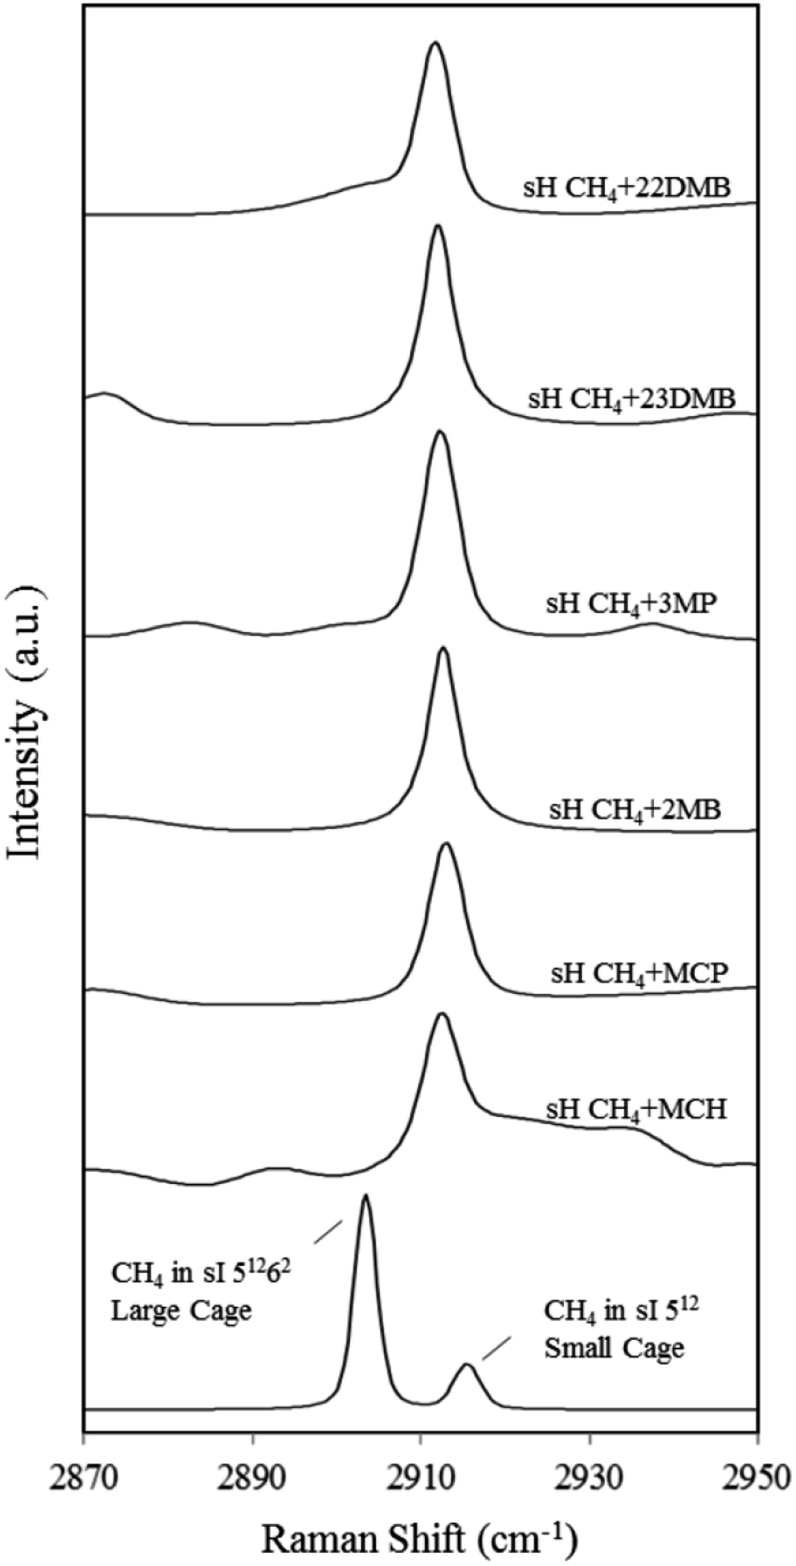 | ||
| Fig. 4 Raman spectra of CH4 in the 512 (small) and 51262 (large) cages of the sI hydrate (MH) and the 512 and 435663 cages of six types of sH hydrates at 137.7 K. Raman peaks for CH4 in the 512 and 435663 sH cages overlap; only one peak was observed. | ||
| Cage type and guest molecules | Raman shift of CH4 at 137.7 K [cm−1] | Slope of Raman shift between 137.7–205.4 K [cm−1/100 K] |
|---|---|---|
| sH CH4 + 22DMB | 2912.0 ± 0.2 | 1.2 |
| sH CH4 + 23DMB | 2911.9 ± 0.2 | 1.7 |
| sH CH4 + 3MP | 2912.2 ± 0.2 | 1.7 |
| sH CH4 + 2MB | 2912.6 ± 0.4 | 1.9 |
| sH CH4 + MCP | 2912.9 ± 0.3 | 0.7 |
| sH CH4 + MCH | 2912.2 ± 0.2 | 1.4 |
| sI 512 CH4 | 2915.4 ± 0.1 | 1.5 |
| sI 51262 CH4 | 2903.2 ± 0.2 | 2.8 |
Fig. 5 depicts the effect of temperature on the C–H symmetric stretch of CH4. These Raman shifts increased with increasing temperature. For CH4 + 22DMB, CH4 + 23DMB, CH4 + 3MP, CH4 + 2MB, and CH4 + MCH hydrates, the slope of Raman shifts was about 1.2–1.9 cm−1/100 K, whereas for CH4 + MCP, it was 0.7 cm−1/100 K (Table 1). This is consistent with the C–H stretching frequency of gaseous CH4, which shifts to higher wavenumbers as the temperature increases.27 Except for CH4 + MCP, the temperature effect on the Raman shift of CH4 in the sH hydrate seemed to be the same as that for CH4 in the 512 cages of sI CH4 hydrates. These results suggest that there is a general trend of the Raman shift with the size of the host cage. If Raman measurements with higher resolution can be obtained, it is possible to discuss effect of temperature depending on the size and/or shape of large guest molecules.
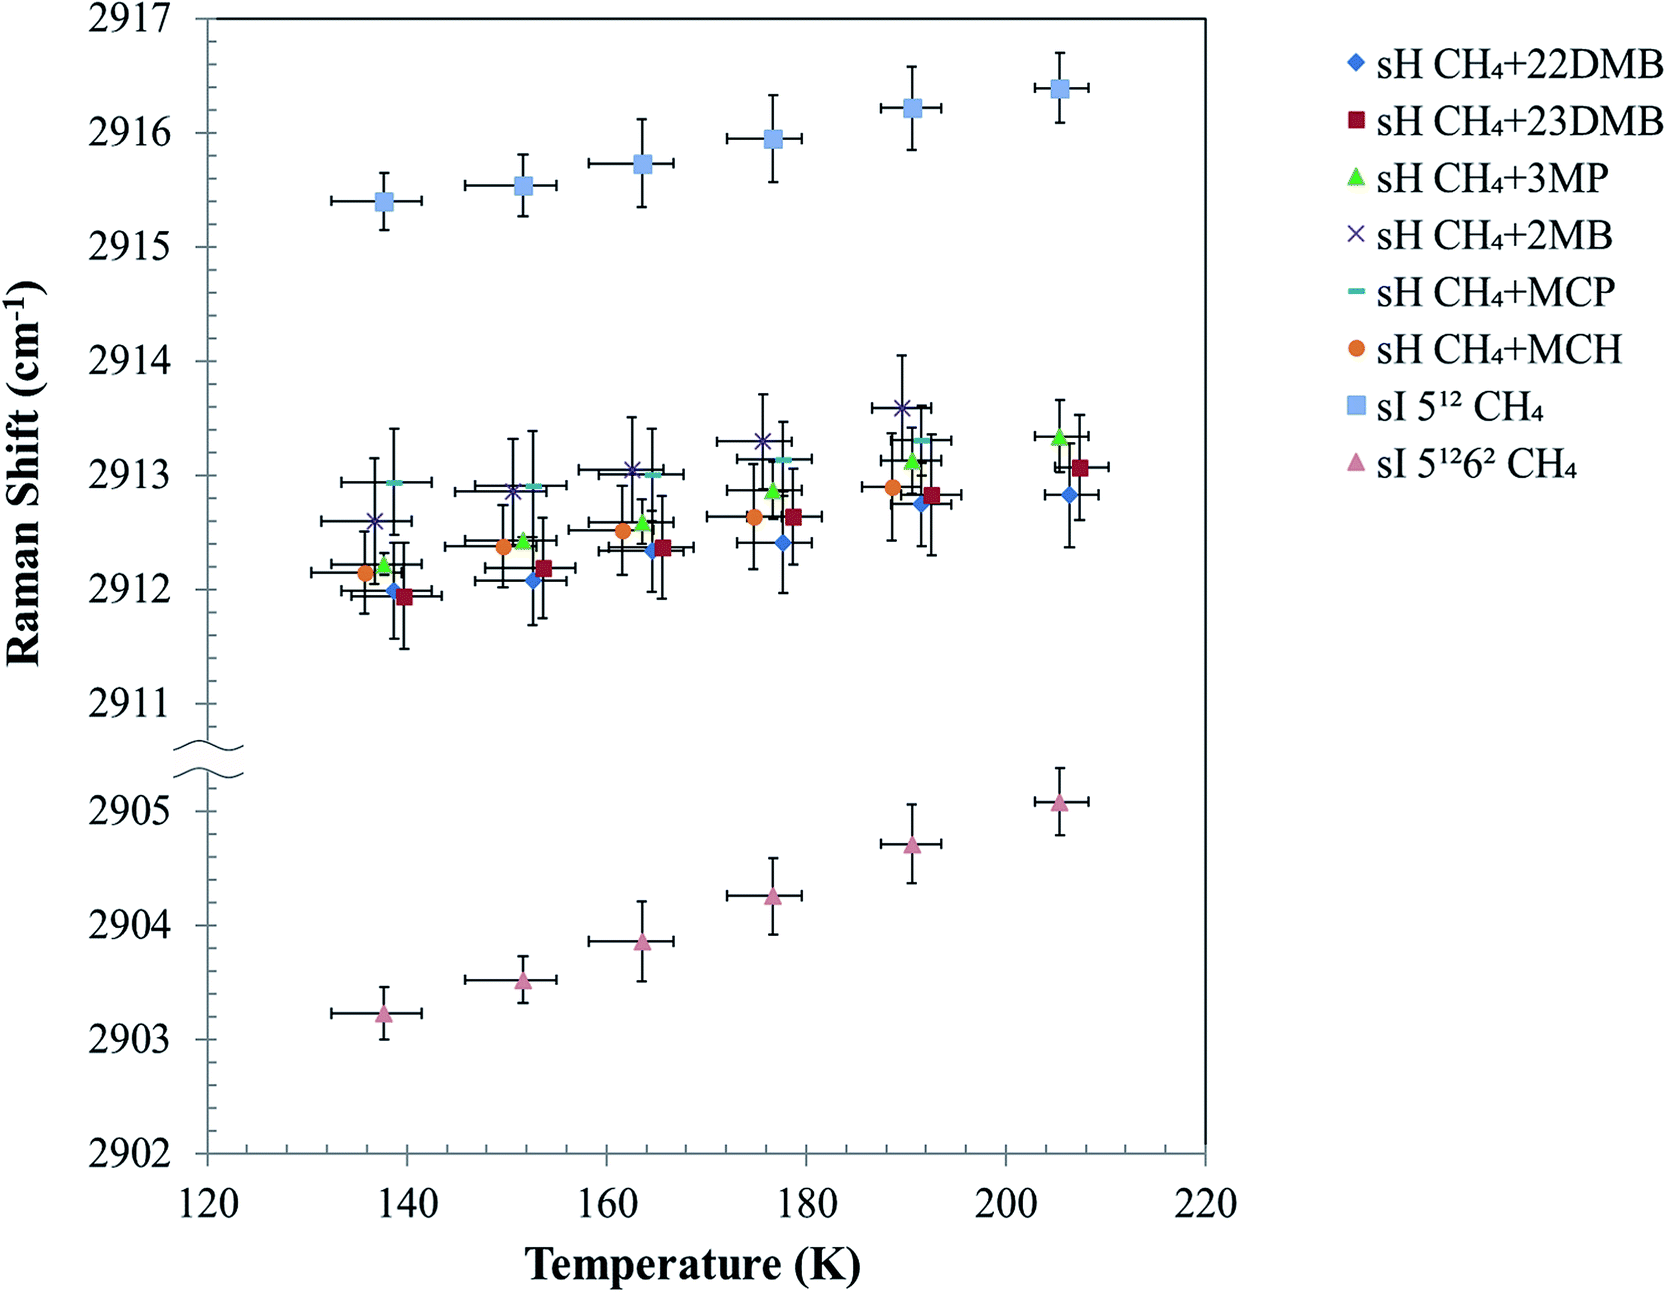 | ||
| Fig. 5 Temperature effect on Raman shift of C–H symmetric stretch of enclathrated CH4 in 512 and 435663 cages of six types sH hydrates and in 512 (small) and 51262 (large) cages of sI CH4 hydrate (MH). In the case of CH4 + 2MB, CH4 + MCP and CH4 + MCH, samples dissociated at 205.4 K. The errors in the temperature are the max and minimum values of 10 times measurements. | ||
To evaluate the increase with temperature in the Raman shift of CH4 in the sH hydrate, the overlap of Raman peaks for the 512 and 435663 cages needs to be considered. The temperature effect on peak full widths at half maxima (FWHMs) of all peaks from Fig. 5 are shown in Fig. 6. FWHMs of all samples increased when temperature increased from 137.7 to 190.6 K. Here, we focus on the values of increase in FWHMs from 137.7 to 190.6 K. In the case of CH4 + 22DMB, CH4 + 23DMB, CH4 + 3MP, CH4 + 2MB, and the sI 512 cage, the FWHMs increased by 0.86–0.97 cm−1. In the case of CH4 + MCP, CH4 + MCH, and the sI 51262 cage, the FWHMs increased by 0.53 cm−1, 0.30 cm−1 and 1.42 cm−1, respectively. The variations of the effect of temperature on FWHMs were almost the same or lower for the overlapped sH CH4 peaks than those for the sI CH4 Raman peaks in the 512 and 51262 cages. Hence, it was indicated that the effects of temperature on the sH CH4 Raman peaks in both 512 and 435663 cages are comparable to each other, although each of the Raman peak for CH4 in the sH 512 and 435663 cages were not measured separately.
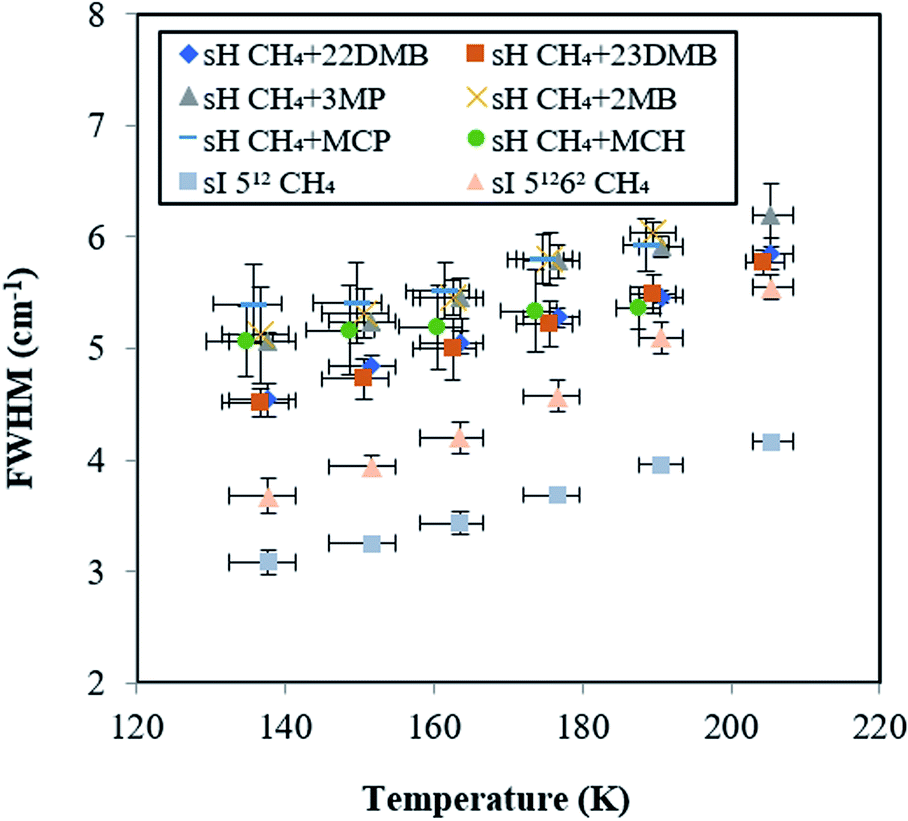 | ||
| Fig. 6 Temperature effect on peak full widths at half maximums (FWHMs) for CH4 in sI and in six types sH hydrates. These errors in the FWHM of 0.4 cm−1 are standard deviation of 9 times measurement. | ||
The C–H stretching frequency of the guest CH4 is usually lower in larger cages than in smaller ones under isothermal conditions, as predicted by the LCTC model.9,15,18 The experimental results in this study indicate that Raman shifts of the C–H symmetric stretch of the guest CH4 increased with temperature because of thermal vibration of the CH4 molecule in water cages; however, cage size also increased, and this might induce a decrease in Raman shifts due to unit-cell expansions with temperature (Fig. 3).
Fig. 5 illustrates that the effect of temperature on Raman shifts of the sI 512, sH 512, and sH 435663 cages were smaller than that of the sI 51262 cage. This may suggest different interactions between the host, water, and guest (CH4) in these cages. In previous studies, the distribution of CD4 molecules in a sI deuterated hydrate cage was analyzed using neutron diffraction experiments.28,29 It was shown that CD4 in the sI 51262 cage distributes longitudinally within the cage at temperatures higher than 80 K, whereas in the 512 cage, CD4 distributes spherically around the center of the cage even at higher temperatures. It was suggested that the distance change between the guest and host molecules in the sI 51262 cage is smaller than that in the sI 512 cage due to changes in temperature. Accordingly, the experimental results in Fig. 5 show that the Raman shifts of the C–H symmetric stretch of enclathrated CH4 in the sI 51262 cage increased with temperature more than in the sI 512, sH 512, and sH 435663 cages. The size of these small cages might be too small for translational motion of CH4 within the cages.
The CH4 hydrate phase is known to transition from the sI to sH structure at 0.9 GPa, and the structure is maintained until about 1.9 GPa.25 In this work, the Raman shift of CH4 in the sH 512 and 435663 cages was larger than that for the sI 512 cage at 0.9 GPa.30 This suggests that the sH 512 cage is smaller than the sI 512 cage as predicted by the LCTC model.9,15,18 Conversely, variations in the C–H symmetric stretching frequency of CH4 with changing pressure under isothermal conditions are not the same as the temperature-induced changes obtained in this study. With pressures of up to 0.8 GPa, the variation of the C–H symmetric stretching frequency of CH4 in the sI 512 cage is higher than that in the sI 51262 cage.30 Contrastingly, the variations of the frequencies of CH4 enclathrated in larger cages (sI 51262 and sH 51268 cage) are smaller than that in the 512 and 435663 cages with changing pressure.30 Therefore, it can be implied that the increase in temperature enhances the C–H symmetric stretching frequency of guest CH4 because of thermal vibration, whereas the increase in pressure enhances this stretching frequency because of shrinking of cages, as predicted by the LCTC model. The increase in pressure from 0.9 GPa to 1.9 GPa under isothermal conditions causes a volume reduction of 3% for sH,31 and the increase in temperature from 93 K to 168 K causes a volume expansion of 1% for sI and sH (Fig. S2†). Therefore, the difference in these volume expansion ratios affects the trend of C–H stretching frequency of CH4 in the cages.
These experimental trends of temperature effect of C–H stretching frequency of CH4 in the water cages may help to consider computational elements of follow theoretical calculation study of thermal effect on sH hydrate and sI CH4 hydrates, although it is not yet complete. For example, the difference in unit-cell sizes is different depending on the type of guest molecule and may change the guest–host interactions. In fact, for CH4 + 22DMB, CH4 + 23DMB, CH4 + 3MP, CH4 + 2MB, CH4 + MCH; the Raman shifts increased by 0.7–1.0 cm−1, but that of CH4 + MCP was smaller. Raman measurements with higher resolution coupled with precise crystal structure data are necessary for further understanding of other correlating factors.
Conclusions
In this work, six different sH clathrate hydrates with CH4 as a help gas were investigated: CH4 + 22DMB; CH4 + 23DMB; CH4 + 3MP; CH4 + 2MB; CH4 + MCP; and CH4 + MCH. PXRD measurements and Raman spectra of the C–H symmetric stretch region of the enclathrated CH4 within these sH hydrates were analyzed in the temperature range of 137.7–205.4 K.The C–H symmetric stretch vibrational frequencies of enclathrated CH4 in the sH and sI hydrates increase with increasing temperature. Raman shifts of the C–H symmetric stretch vibrational frequencies of CH4 enclathrated in larger cages decreased than in smaller cages. However, in this work, these Raman shifts increased even though unit-cell sizes of all samples increased with increasing temperature.
The distribution of CH4 in the water cage increases with increasing temperature, implying that the distance between the CH4 and water molecules of the lattice is small. The variation of the C–H symmetric stretching frequency of CH4 in the large cages was greater than that in small cages, because the thermal vibration of CH4 in the former were bigger than that in the latter.
These results contribute to understand the stability and guest–host interactions of sH hydrate and sI CH4 hydrates. These results of C–H stretching frequency of CH4 in the water cages may help to consider computational elements of follow theoretical calculation study of thermal effect on sH hydrate and sI CH4 hydrates. However, the trend of the Raman spectra peaks of CH4 in the sH hydrate has not yet been interpreted. For example, variations of the C–H symmetric stretching frequency of CH4 in sH hydrates vary depending on the guest molecule. To further comprehend other correlating factors, Raman spectroscopy with higher resolution coupled with precise crystal structure data is needed.
Conflicts of interest
There are no conflicts to declare.Acknowledgements
This study was supported by Grant-in-Aid for Scientific Research (B) 26303021 of the Japan Society for the Promotion of Science (JSPS).References
- E. D. Sloan and C. A. Koh, Clathrate Hydrates of Natural Gases, CRC Press/Taylor&Francis Group, Boca Raton, FL, 3rd edn, 2008 Search PubMed.
- H. R. Müller and M. V. Stackelberg, Naturwissenschaften, 1952, 39, 20 CrossRef.
- M. V. Stackelberg and H. R. Müller, Naturwissenschaften, 1951, 38, 456 CrossRef.
- J. A. Ripmeester, J. S. Tse, C. I. Ratcliffe and B. M. Powell, Nature, 1987, 325, 135 CrossRef CAS.
- H. Lu, Y. T. Seo, J. W. Lee, I. Moudrakovski, J. A. Ripmeester, N. R. Chapman, R. B. Coffin, G. Gardner and J. Pohlman, Nature, 2007, 445, 303–306 CrossRef CAS PubMed.
- S. Takeya, A. Hori, T. Uchida and R. Ohmura, J. Phys. Chem. B, 2006, 110, 12946 CrossRef PubMed.
- A. K. Sum, R. C. Burruss and E. D. Sloan, J. Phys. Chem. B, 1997, 101, 7371–7377 CrossRef CAS.
- S. Subramanian, R. A. Kini, S. F. Dec and E. D. Sloan, Chem. Eng. Sci., 2000, 55, 1981–1999 CrossRef CAS.
- S. Subramanian and E. D. Sloan, J. Phys. Chem. B, 2002, 106, 4348–4355 CrossRef CAS.
- M. M. Murshed and W. F. Kuhs, J. Phys. Chem. B, 2009, 113, 5172–5180 CrossRef CAS PubMed.
- T. Uchida, S. Takeya, Y. Kamata, I. Y. Ikeda, J. Nagao, T. Ebinuma, H. Narita, O. Zatsepina and B. A. Buffett, J. Phys. Chem. B, 2002, 106, 12426–12431 CrossRef CAS.
- T. Uchida, T. Hirano, T. Ebinuma, H. Narita, K. Gohara, S. Mae and R. Matsumoto, AIChE J., 1999, 45, 2641–2645 CrossRef CAS.
- S. Subramanian and E. D. Sloan, Ann. N. Y. Acad. Sci., 2000, 912, 583–592 CrossRef CAS.
- G. C. Pimentel and S. W. Charles, Pure Appl. Chem., 1963, 7, 111 CAS.
- J. S. Tse, J. Supramol. Chem., 2002, 2, 429 CrossRef CAS.
- M. Hiratsuka, R. Ohmura, A. K. Sum and K. Yasuoka, J. Chem. Phys., 2012, 136, 044508 CrossRef PubMed.
- M. Hiratsuka, R. Ohmura, A. K. Sum and K. Yasuoka, J. Chem. Phys., 2012, 137, 144306 CrossRef PubMed.
- Y. Liu and L. Ojamäe, J. Phys. Chem. C, 2015, 119, 17087–17089 Search PubMed.
- K. Tezuka, K. Murayama, S. Takeya, S. Alavi and R. Ohmura, J. Phys. Chem. C, 2013, 117, 10476 CrossRef.
- K. Murayama, S. Takeya, S. Alavi and R. Ohmura, J. Phys. Chem. C, 2014, 118, 21323–21330 CrossRef CAS.
- K. C. Hester, Z. Huo, A. L. Ballard, C. A. Koh, K. T. Miller and E. D. Sloan, J. Phys. Chem. B, 2007, 111, 8830–8835 CrossRef CAS PubMed.
- J. A. Greathouse, R. T. Cygan and B. A. Simmons, J. Phys. Chem. B, 2006, 110, 6428–6431 CrossRef CAS PubMed.
- T. Kumazaki, Y. Kito, S. Sasaki, T. Kume and H. Shimizu, Chem. Phys. Lett., 2004, 388, 18–22 CrossRef CAS.
- K. A. Udachin, C. I. Ratcliffe and J. A. Ripmeester, J. Supramol. Chem., 2002, 2, 405–408 CrossRef CAS.
- M. T. Kirchner, R. Boese, W. E. Billups and L. R. Norman, J. Am. Chem. Soc., 2004, 126(30), 9407–9412 CrossRef CAS PubMed.
- S. Takeya, K. A. Udachin, I. L. Moudrakovski, R. Susilo and J. A. Ripmeester, J. Am. Chem. Soc., 2010, 132(2), 524–531 CrossRef CAS PubMed.
- L. Shang, I. M. Chou, R. C. Burruss, R. Hu and X. Bia, J. Raman Spectrosc., 2014, 45, 696–702 CrossRef CAS.
- C. Gutt, B. Asmussen, W. Press, M. R. Johnson, Y. P. Handa and J. S. Tse, J. Chem. Phys., 2000, 113, 4713–4721 CrossRef CAS.
- A. Hoshikawa, N. Igawa, H. Yamauchi and Y. Ishii, J. Chem. Phys., 2006, 125(3–6), 034505 CrossRef PubMed.
- H. Shimizu, T. Kume and S. Sasaki, J. Phys. Chem. B, 2002, 106, 30–33 CrossRef CAS.
- H. Hirai, Y. Uchihara, H. Fujihisa, M. Sakashita, E. Katoh, K. Aoki, K. Nagashima, Y. Yamamoto and T. Yagi, J. Phys. Chem., 2001, 115, 7066–7070 CrossRef CAS.
Footnote |
| † Electronic supplementary information (ESI) available. See DOI: 10.1039/d0ra02748k |
| This journal is © The Royal Society of Chemistry 2020 |